Zscaler Private Access

The Zscaler Private Access App collects logs from Zscaler using the Log Streaming Service (LSS) to populate pre-configured searches and Dashboards. The dashboards provide easy-to-access visual insights into user behaviors, security, connector status, and risk.
Log Types
The Sumo Logic App for Zscaler Private Access uses LSS to send the following logs, as documented here:
- App Connector Status: Information related to an App Connector's availability and connection to ZPA. To learn more, see App Connector Status Log Fields.
- User Activity: Information on end user requests to Applications. To learn more, see User Activity Log Fields.
- User Status: Information related to an end user's availability and connection to ZPA. To learn more, see User Status Log Fields.
- Browser Access Logs: HTTP log information related to Browser Access. To learn more, see Browser Access Log Fields and About Browser Access.
- Audit Logs: Session information for all admins accessing the ZPA Admin Portal. To learn more, see Audit Log Fields and About Audit Logs.
Collect Logs for the Zscaler Private Access (ZPA) App
Zscaler Private Access uses the Log Streaming Service (LSS), to stream logs from the Zscaler service and deliver them to the Sumo Logic Hosted collector via Syslog.
LSS is deployed using two components, a log receiver and a ZPA App Connector. LSS resides in ZPA and initiates a log stream through a ZPA Public Service Edge (formerly Zscaler Enforcement Node or ZEN). The App Connector resides in your company's enterprise environment. It receives the log stream and then forwards it to Sumo Logic Cloud Syslog.
To collect logs for Zscaler Private Access, perform these steps, detailed in the following sections:
- Configure Sumo Logic Hosted Collector and a Cloud Syslog Source
- Configure App Connector in ZPA
- Deploy an App Connector on a Supported Platform
- Configure Log Receivers in ZPA to send logs to Sumo Logic
Configure Sumo Logic Hosted Collector and a Cloud Syslog Source
To collect logs for ZPA, do the following in Sumo Logic:
- Configure a Hosted Collector.
- Perform the steps in Configure a Cloud Syslog Source. and configure the following Source fields:For details see Best Practices.
* **Name**. (Required) A name is required. Description is optional.
* **Source Category**. (Required) [Provide a realistic Source Category example for this data type.] The Source Category metadata field is a fundamental building block to organize and label Sources. - In the Advanced section, specify the following configurations:
- Enable Timestamp Parsing. True
- Time Zone. Use time zone from log file. If none is detected use: Use Collector Default.
- Timestamp Format. Auto Detect
- In the Processing Rules for Logs section, add a Processing Rule:
- Name:
Remove Syslog String - Filter:
(\<\d+\>1 - - - - - - \{) - Type:
Mask messages that match - Mask String:
{
- Name:
- Click Save.
Copy and paste the Token, Host and Port in a secure location. You will need these when you configure ZPA LSS.
Configure App Connector in ZPA
Configure a new App Connector in ZPA. Copy the provisioning key created/selected during App Connector configuration.
Deploy an App Connector on a Supported Platform
After you add an App Connector, you must deploy it. Deployment consists of installing the App Connector and also enrolling the App Connector, which allows the App Connector to obtain a TLS client certificate that it must use to authenticate itself to the ZPA cloud. After deployment, the App Connector is ready to send logs to Sumo Logic.
Before you begin a deployment, read App Connector Deployment Prerequisites which provides detailed information on VM image sizing and scalability, supported platform requirements, deployment best practices, and other essential guidelines.
The deployment process differs depending on the platform used for the App Connector. Zscaler recommends that App Connectors be deployed in pairs, to ensure continuous availability during software upgrades.
To deploy the App Connector, see the Deployment Guide for your platform.
Configure Log Receivers in ZPA to send logs to Sumo Logic
Once you have deployed the App Connector, configure log receivers to send logs to the Sumo Logic cloud syslog endpoint using the following steps:
- Log into your ZPA system.
- Go to Administration > Log Receivers.
- Click Add Log Receiver.
- In the Add Log Receiver window, configure the following tabs:
Name: Enter a name for the log receiver. The name cannot contain special characters, with the exception of periods (.), hyphens (-), and underscores ( _ ).
Description: (Optional) Enter a description.
Domain or IP Address: Enter the Domain name from the Sumo Logic Cloud Syslog Source.
TCP Port: Enter the TCP port number from the Sumo Logic Cloud Syslog Source. Default: 6514
TLS Encryption: Select Enabled.
Connector Groups: Choose the App Connector groups that can forward logs to the receiver, and click Done. You can search for a specific group, click Select All to apply all groups, or click Clear Selection to remove all selections.
Click Next.
1. In the **Log Stream** tab, select a **Log Type** from the dropdown menu:
    1. **User Activity**: Information on end user requests to applications. To learn more, see[ User Activity Log Fields](https://help.zscaler.com/zpa/user-activity-log-fields).
    2. **User Status**: Information related to an end user's availability and connection to ZPA. To learn more, see[ User Status Log Fields](https://help.zscaler.com/zpa/user-status-log-fields).
    3. **Connector Status**: Information related to an App Connector's availability and connection to ZPA. To learn more, see[ App Connector Status Log Fields](https://help.zscaler.com/zpa/connector-status-log-fields).
    4. **Browser Access**: HTTP log information related to Browser Access. To learn more, see[ Browser Access Log Fields](https://help.zscaler.com/zpa/http-log-fields) and[ About Browser Access](https://help.zscaler.com/zpa/about-BrowserAccess).
    5. **Audit Logs**: Session information for all admins accessing the ZPA Admin Portal. To learn more, see[ About Audit Log Fields](https://help.zscaler.com/zpa/about-audit-log-fields) and[ About Audit Logs](https://help.zscaler.com/zpa/about-audit-logs).
2. In the **Log Template** field, select **JSON.**
3. The default **Log Stream Content **that is displayed will change based on the **Log Type** and **Log Template** you selected in previous steps.
\ You can also edit the log stream content within the text field in order to capture specific fields and create a Custom log template. To learn more, see Understanding the Log Stream Content Format. \ Edit the the log stream content, paste the following text in the beginning of the template:
<165>1 - - - - - - <Syslog Token>
For Syslog Token, enter the token from the Sumo Logic Cloud Syslog Source. The token should end with @41123. This number is the Sumo Logic Private Enterprise Number (PEN).
- You can define a streaming Policy for the log receiver. For example, you can create a policy where the receiver will only capture logs for a specified segment group or a specific set of session status error codes. The criteria you can use is dependent upon the Log Type you selected. For various options to define a streaming policy, see ZPA help.
- Click Next.
- Review
- In the Review tab, review your log receiver configuration, and click Save.
- Repeat the previous steps for all the Log Types:
- User Activity: Information on end user requests to applications. To learn more, see User Activity Log Fields.
- User Status: Information related to an end user's availability and connection to ZPA. To learn more, see User Status Log Fields.
- Connector Status: Information related to an App Connector's availability and connection to ZPA. To learn more, see App Connector Status Log Fields.
- Browser Access: HTTP log information related to Browser Access. To learn more, see Browser Access Log Fields and About Browser Access.
- Audit Logs: Session information for all admins accessing the ZPA Admin Portal. To learn more, see About Audit Log Fields and About Audit Logs.
- The end result should look like below:
- At this point, ZPA should start sending logs to Sumo Logic.
Installing the Zscaler Private Access App
Now that you have set up collection for HAProxy, you can install the HAProxy App to use the pre-configured searches and dashboard that provide insight into your data.
To install the app, do the following:
Locate and install the app you need from the App Catalog. If you want to see a preview of the dashboards included with the app before installing, click Preview Dashboards.
- From the App Catalog, search for and select the app.
- Select the version of the service you're using and click Add to Library.
Version selection is applicable only to a few apps currently. For more information, see Installing the Apps from the Library.
- To install the app, complete the following fields.
- App Name. You can retain the existing name, or enter a name of your choice for the app.
- Data Source. Select either of these options for the data source.
- Choose Source Category, and select a source category from the list.
- Choose Enter a Custom Data Filter, and enter a custom source category beginning with an underscore. Example: (
_sourceCategory=MyCategory).
- Advanced. Select the Location in Library (the default is the Personal folder in the library), or click New Folder to add a new folder.
- Click Add to Library.
Once an app is installed, it will appear in your Personal folder, or other folder that you specified. From here, you can share it with your organization.
Panels will start to fill automatically. It's important to note that each panel slowly fills with data matching the time range query and received since the panel was created. Results won't immediately be available, but with a bit of time, you'll see full graphs and maps.
Viewing ZPA Dashboards
Template variables provide dynamic dashboards that can rescope data on the fly. As you apply variables to troubleshoot through your dashboard, you view dynamic changes to the data for a quicker resolution to the root cause. You can use template variables to drill down and examine the data on a granular level. For more information, see Filter with template variables.
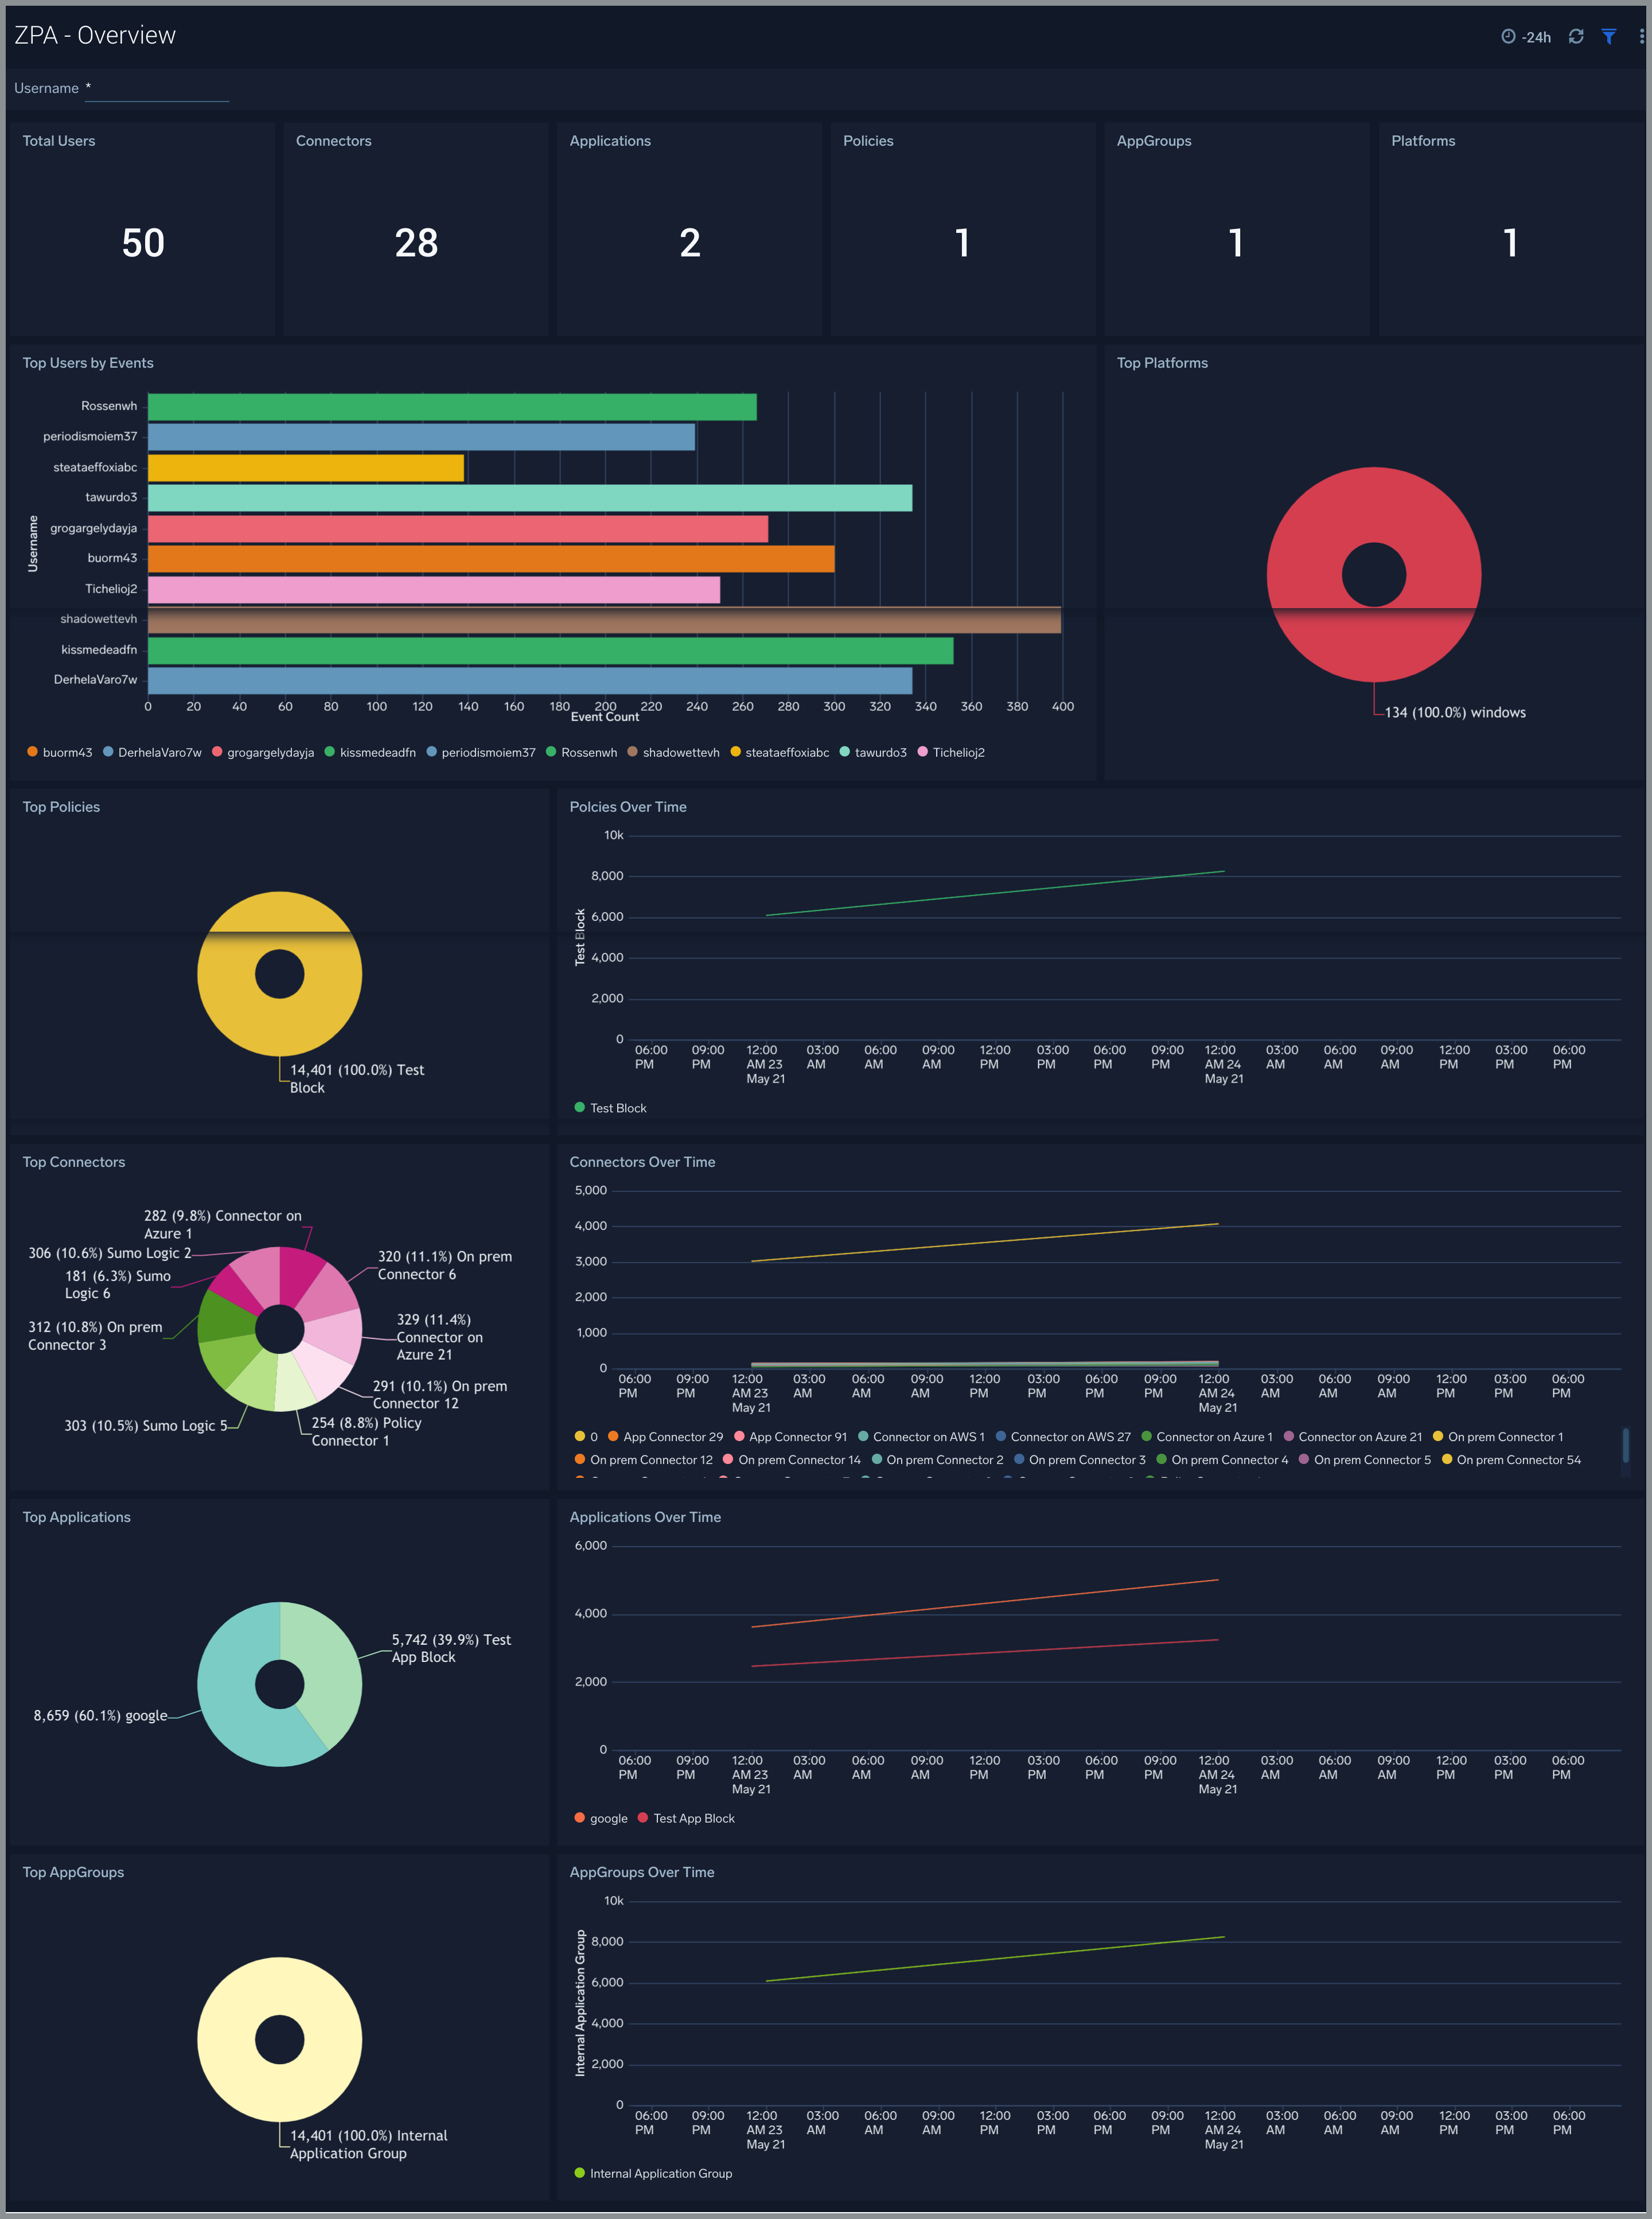
Overview
The ZPA - Overview Dashboard focuses on the overall health of the ZPA system.
Use this dashboard to:
- Gain insights into ZPA health.
- Manage ZPA connector health.
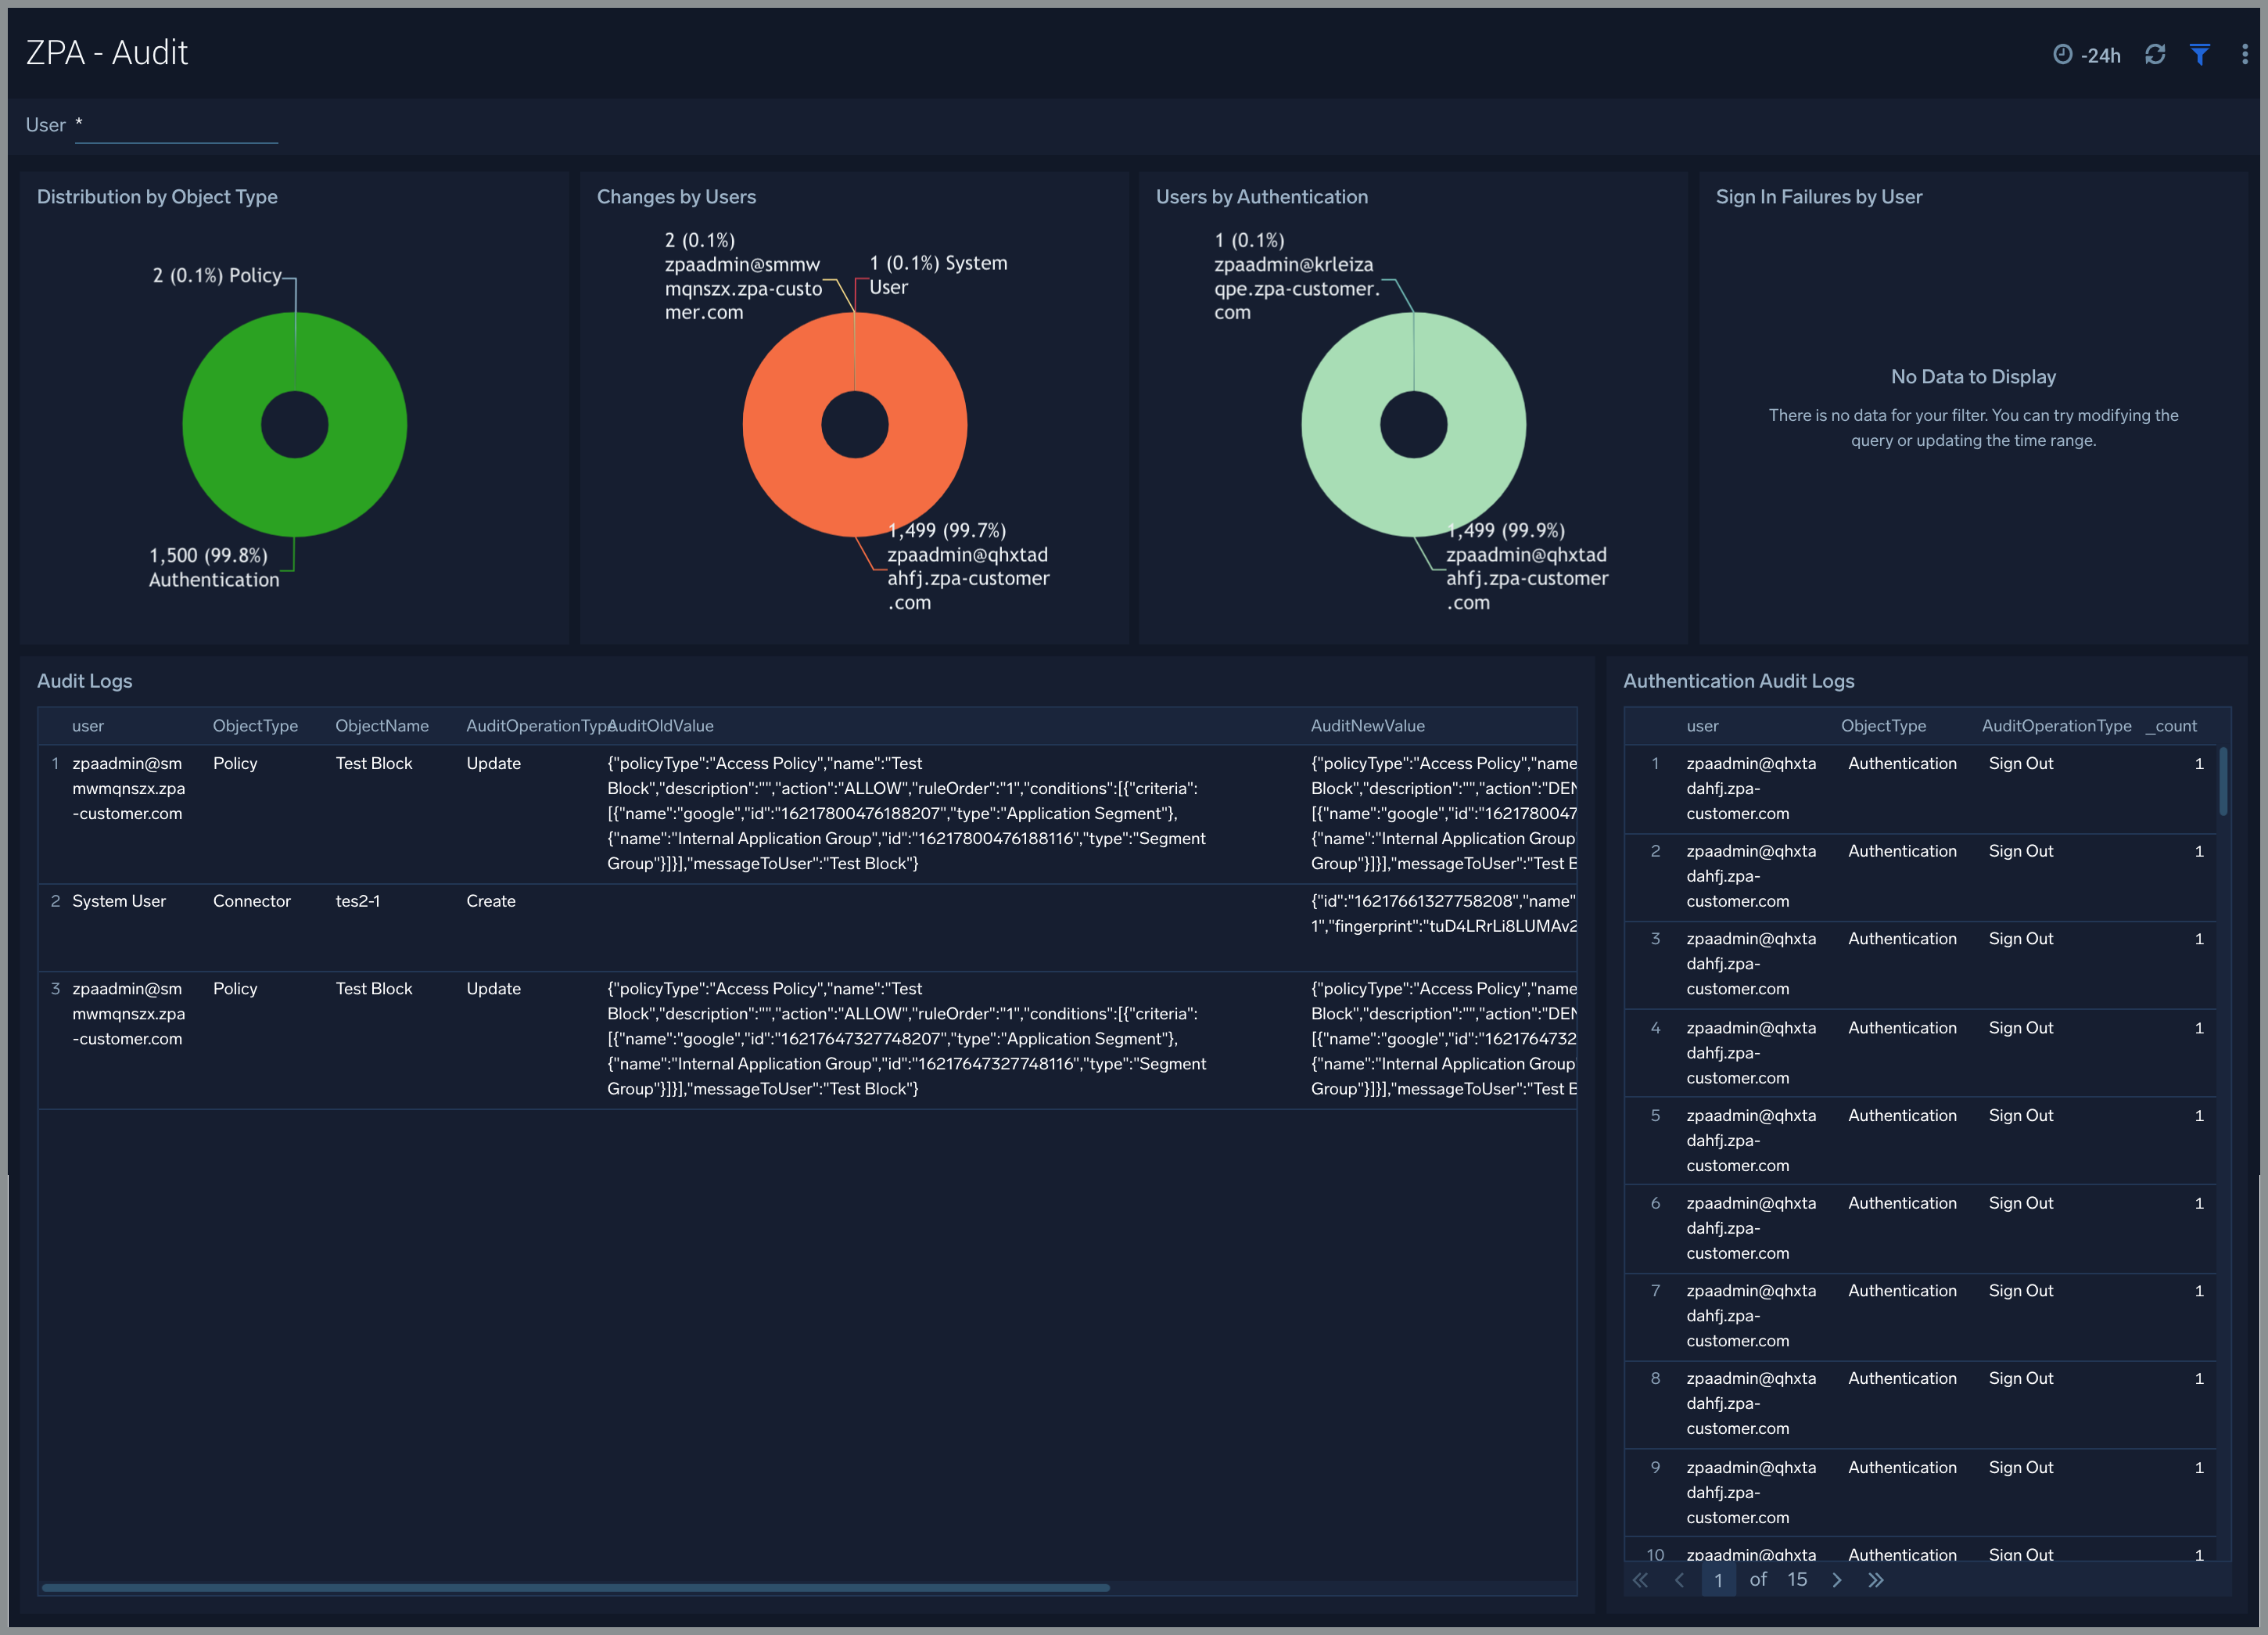
Audit
The ZPA - Audit Dashboard focuses the changes in the ZPA admin UI. It allows easy tracking and change management.
Use this dashboard to:
- Gain insights into ZPA configuration changes.
- Easily identify the mis-configurations for erratic behavior.
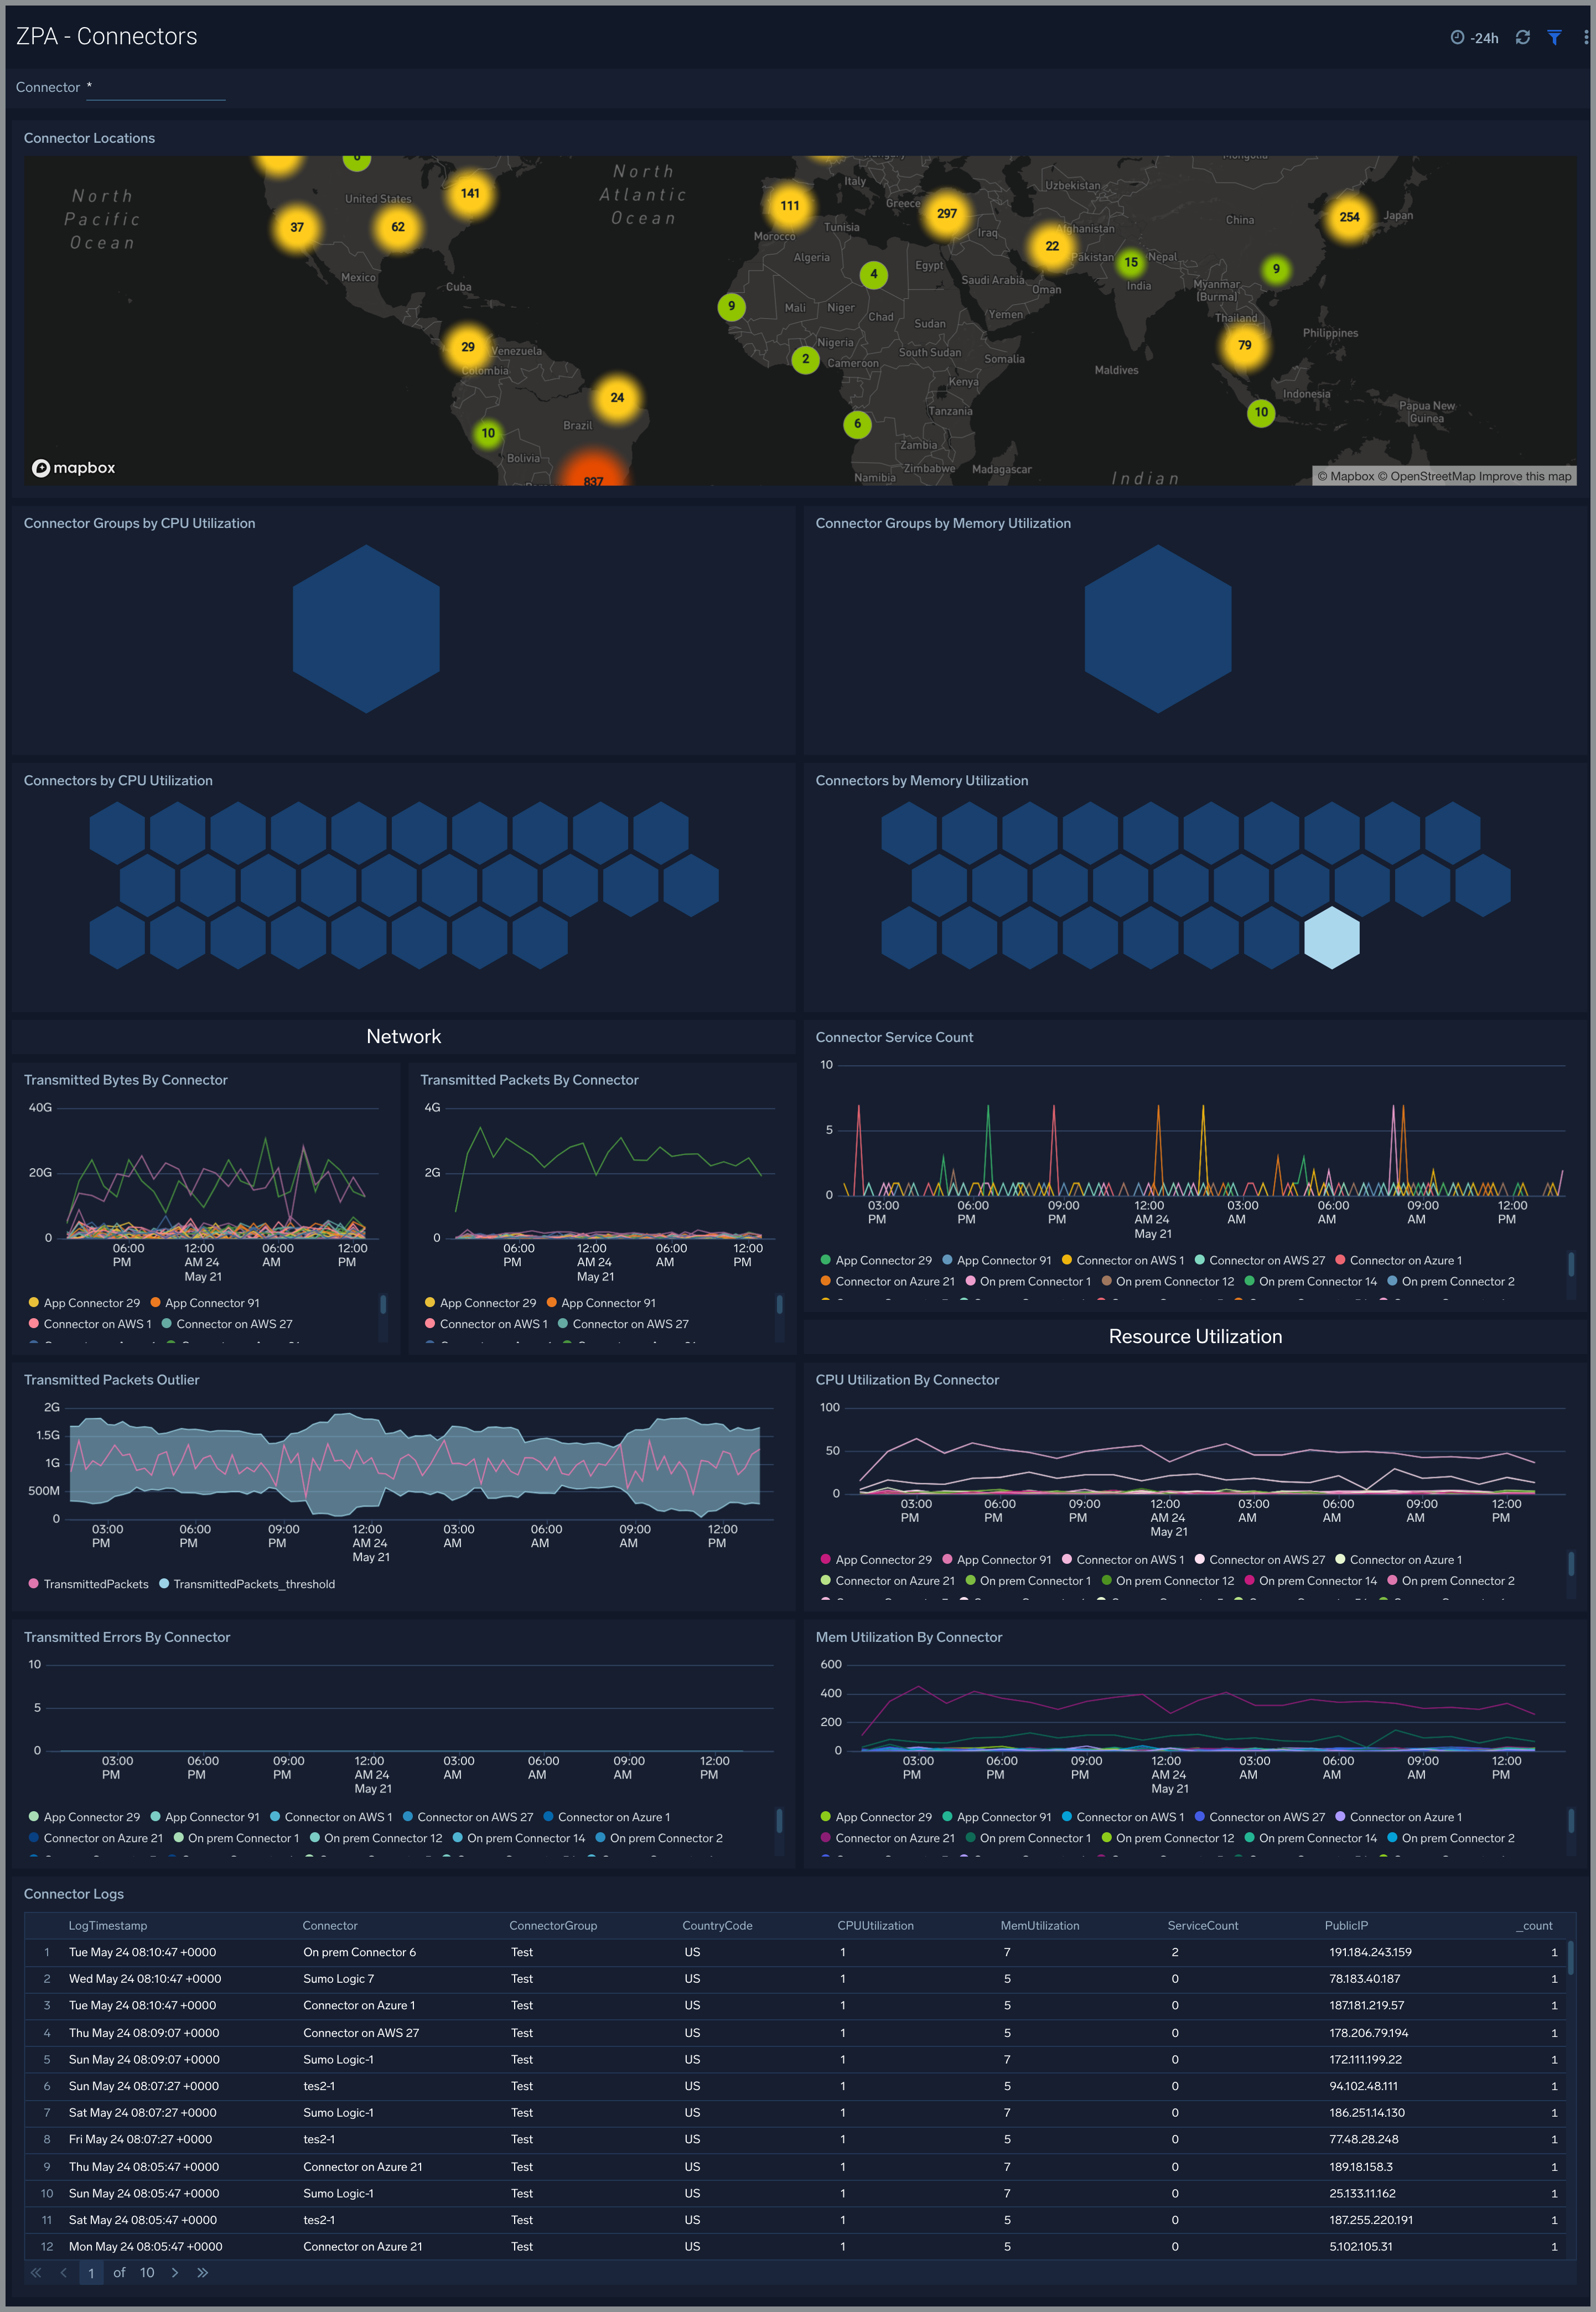
Connectors
The ZPA - Connectors Dashboard focuses on connector health and resource utilization.
Use this dashboard to:
- Gain insights into ZPA connector health.
- Identify and manage connectors erroring out or having resource constraints.
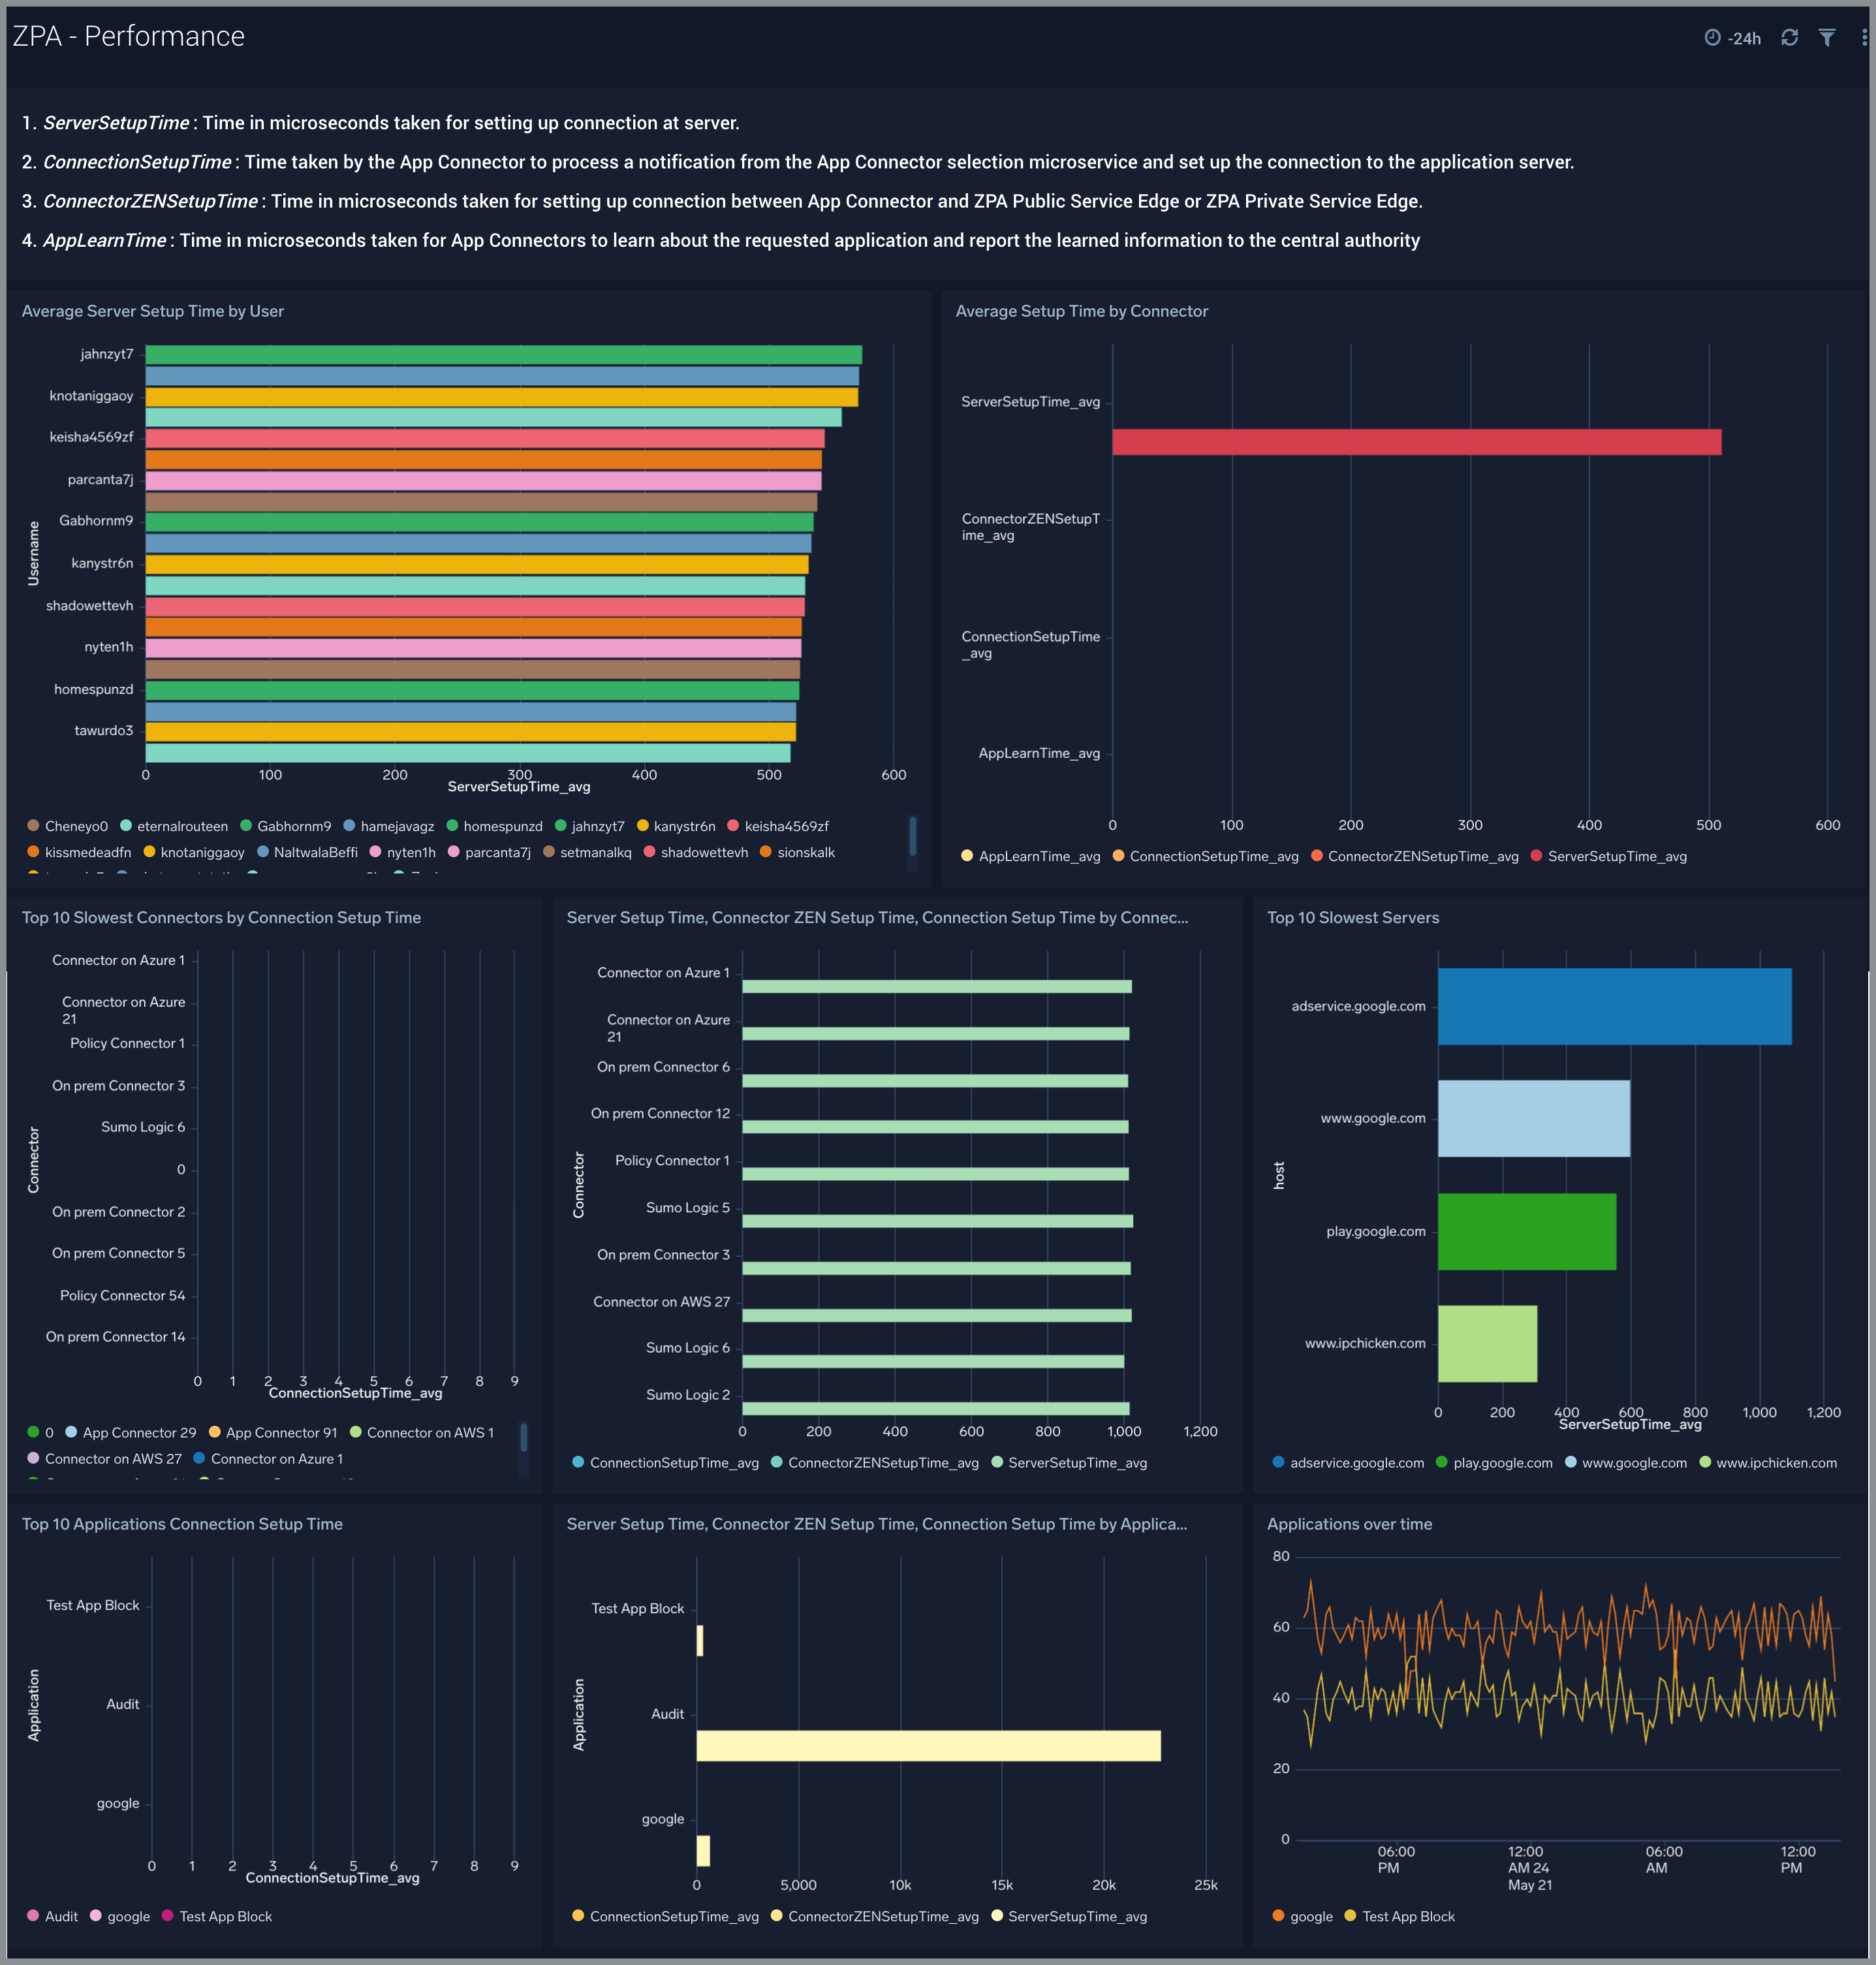
Performance
The ZPA - Performance Dashboard focuses on the performance of the connectors and the ZPA system.
Use this dashboard to:
- Gain insights into ZPA Performance.
- Manage ZPA connector setup times to determine potential issues.
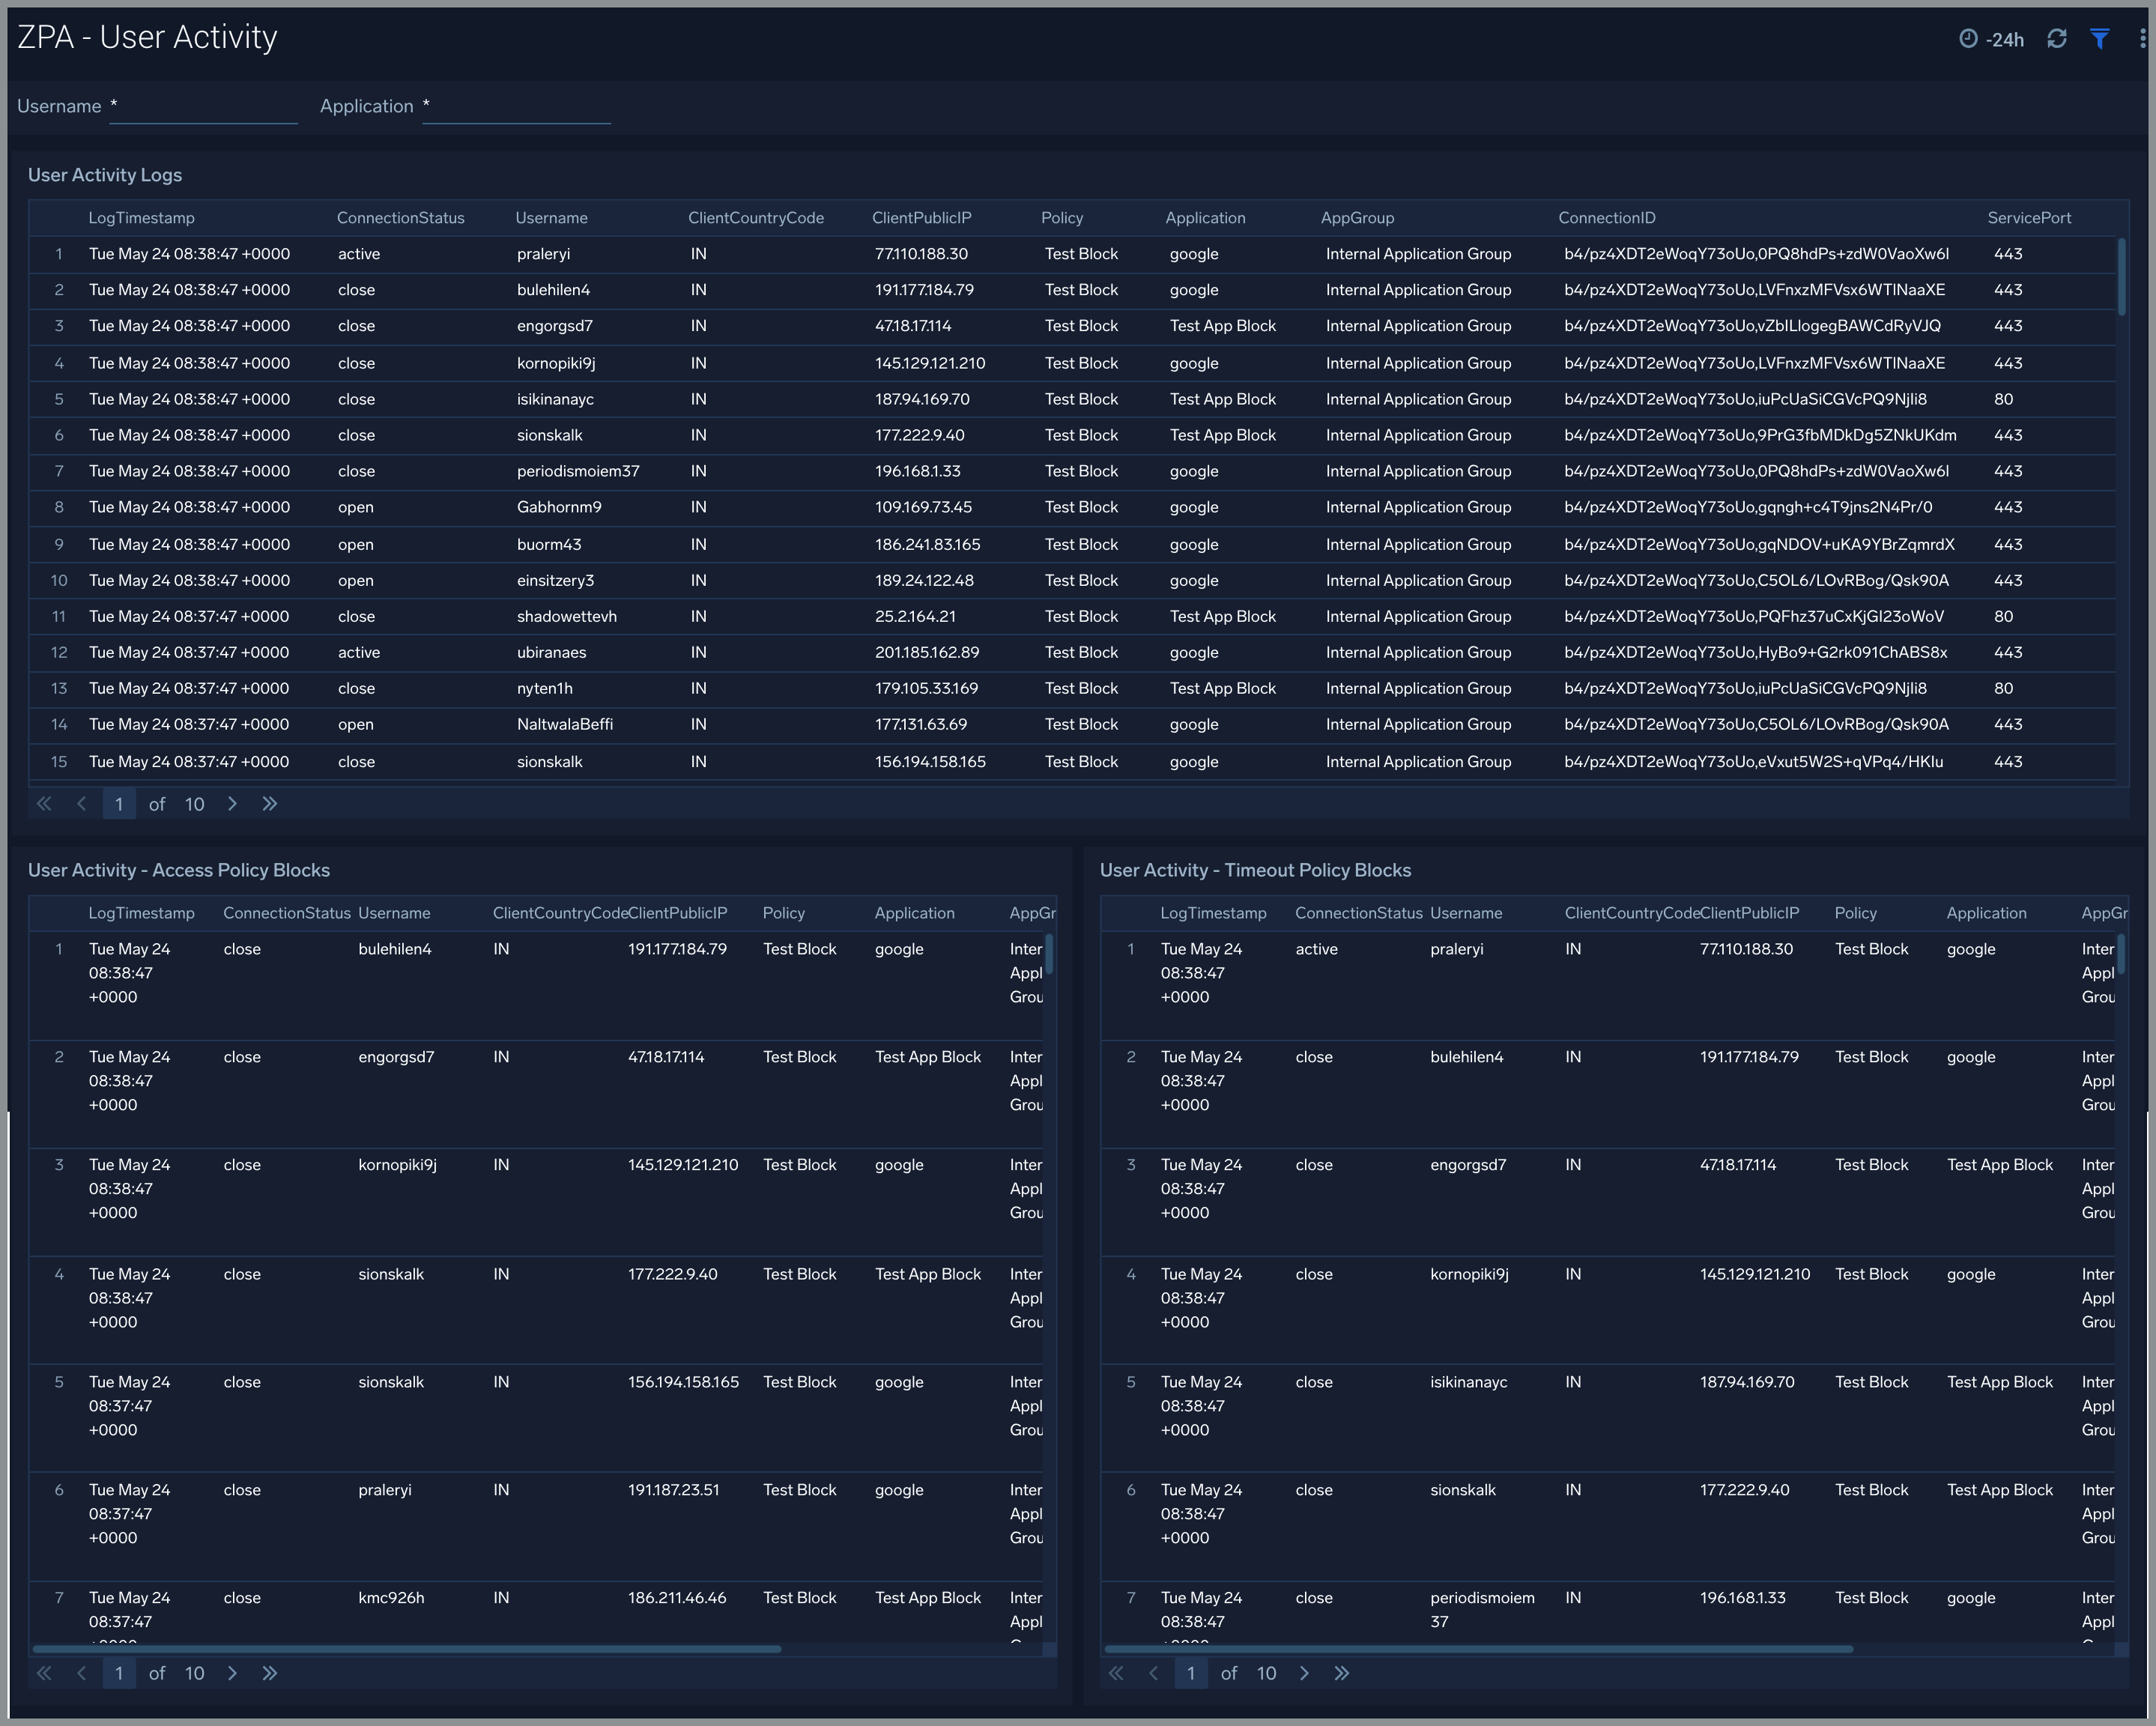
User Activity
The ZPA - User Activity Dashboard focuses on the users activity.
Use this dashboard to:
- Gain insights into User activity.
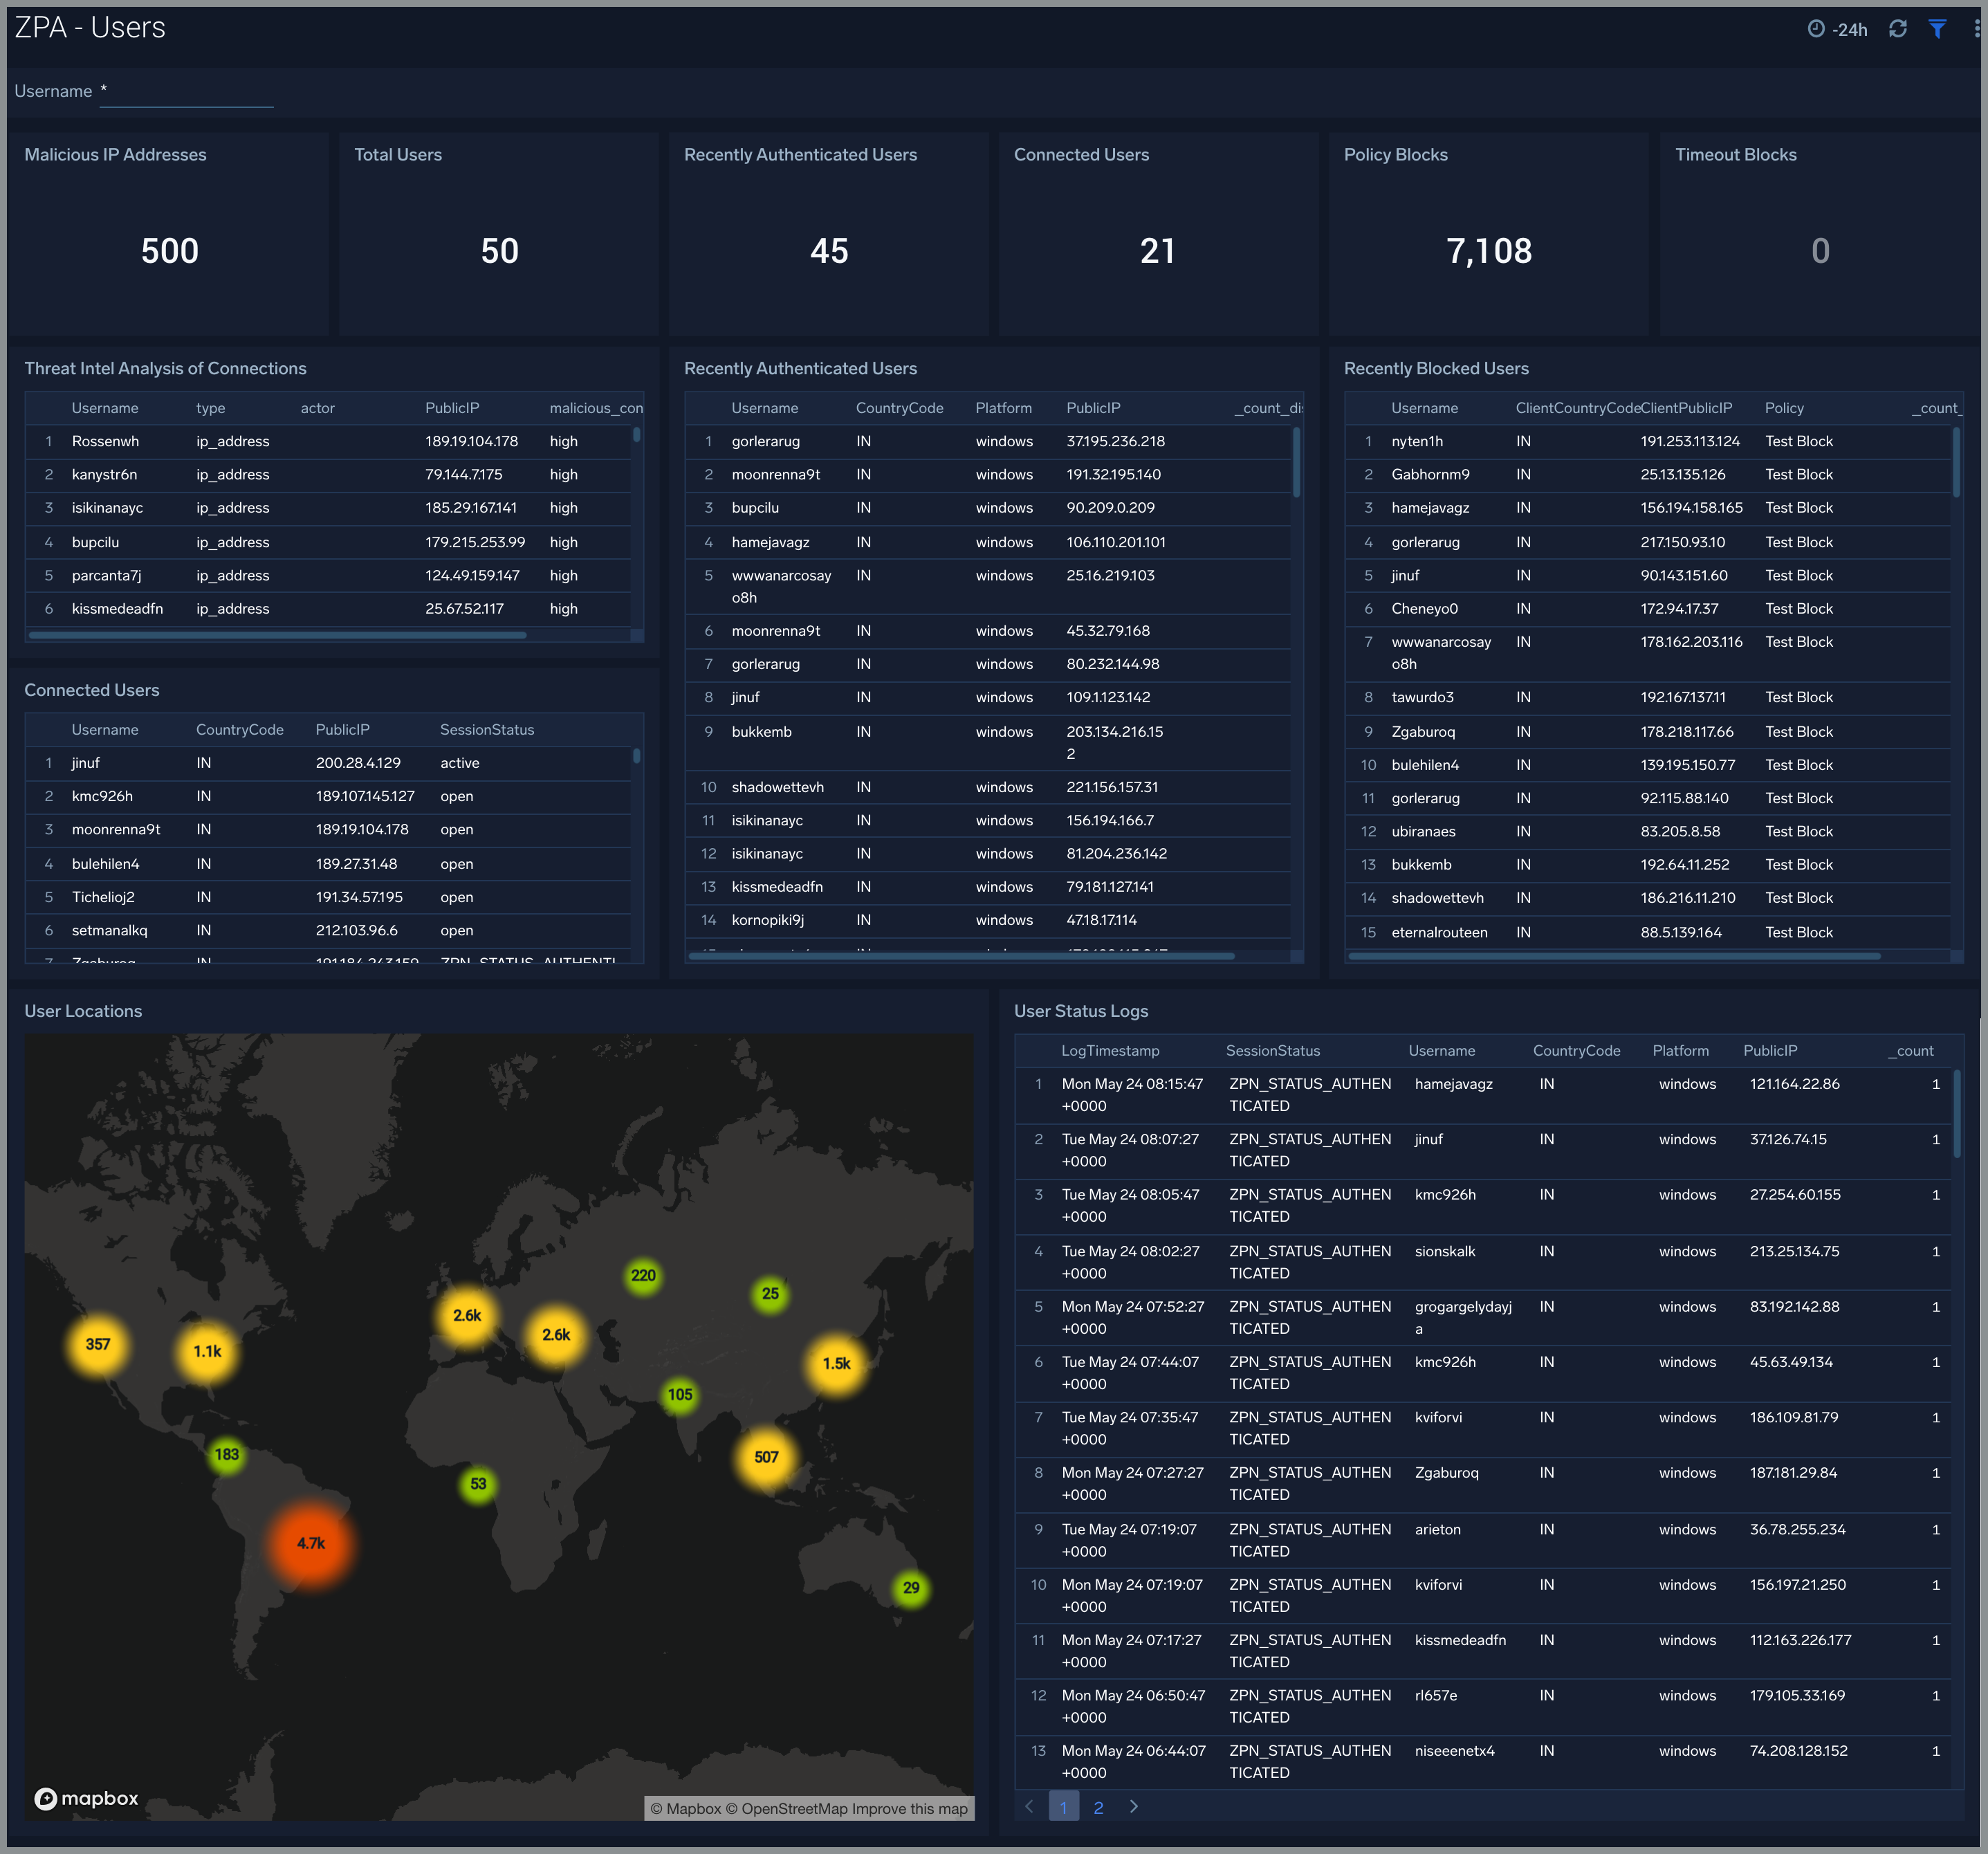
Users
The ZPA - Users Dashboard focuses on the user details.
Use this dashboard to:
- Gain insights into User connections and Access.
- Manage Policy and Timeout blocks.