Cylance
The Cylance App enables you to analyze Cylance security events by type, status, and detection method. You can use the App to investigate Cylance-specific events and provide operational visibility to team members without logging into Cylance.
Cylance applies artificial intelligence, algorithmic science, and machine learning to cyber security, and provides visibility to their service through integrations with a central security analytics platform like Sumo Logic. By combining the threat events data from Cylance and other data sources, you can reduce your security risk and improve your overall security posture.
Log Types
The Sumo Logic App for Cylance uses the supports the following event and log types:
- Device (Device Mgmt - Register, Remove, Updates, SystemSecurity)
- Threat (Threats identified and actioned)
- ScriptControl (Script Execution control and actions)
- ExploitAttempt (Memory Protection)
- Threat Classification (Threat classification by Cylance research team)
- AuditLog (User Actions performed from Cylance Web Console)
- DeviceControl (Control external device like USB, storage connected to system under monitoring)
- AppControl
For details on the format and definitions, refer to Cylance documentation.
Sample Log Message
850 <44>1 2019-02-27T04:57:20.4390000Z sysloghost CylancePROTECT - - - Event Type:
Threat, Event Name: threat_changed, Device Name: SumoStg05, IP Address: (242.95.35.166),
File Name: ChkRestart.exe, Path: C:\Windows\Dell_Scripts\Chk_Restart\, Drive Type:
`Internal Hard Drive, SHA256: EBAD535255B99420C2387B6DD195AFBF8EDC0F88A74037E998DBAEB5EE93A2AE,
MD5: C917371E290C185FFED3138F574ADEDD, Status: Abnormal, Cylance Score: 50, Found Date:
1/18/2019 2:28:32 PM, File Type: Executable, Is Running: False, Auto Run: False, Detected By:
ExecutionControl, Zone Names: (BLR), Is Malware: False, Is Unique To Cylance: True,
Threat Classification: Trusted - Local, Device Id: 81-89cec180584-1fede63f-460414-fe-4c,
Policy Name: Allowed Anywhere Internally
Sample Query
The following query is from the Event Name Trend panel of the Cylance - AuditLog Dashboard.
_sourceCategory=*cylance* "Event Type:" AuditLog
| parse "Event Type: *, Event Name: *," as event_type, event_name nodrop
| parse "Message: *," as msg nodrop | parse "Source IP: *," as src_ip nodrop | parse "User: *" as user nodrop
| parse field=msg "Device: * was auto assigned to Zone: *" as device_name, zone nodrop
| parse field=msg "Provider: *" as provider nodrop
| parse regex field=msg "Device:\s*(?<device_name>[^\s]*)\s*$" nodrop
| parse field=msg "Tier: *; Zones: *; Agent Version: *" as tier, zone, agent_version nodrop
| parse field=msg "Policy Assigned: *; Devices: *" as policy, device_name nodrop
| parse field=msg "Device: *; " as device_name nodrop
| parse field=msg "Devices: *" as device_name nodrop
| parse field=msg "SHA256: *" as sha nodrop
| parse field=msg "Zone: *; Policy Assigned: *; Policy Applied To All Devices In Zone: *" as zone, policy, PolicyAppliedToAllDevicesInZone
| where event_type = "AuditLog"
| timeslice 1d
| count by _timeslice, event_name
| transpose row _timeslice column event_name
Collecting Logs for the Cylance App
This procedure demonstrates how to collect logs from Cylance into Sumo Logic. Cylance applies artificial intelligence, algorithmic science, and machine learning to cyber security, and provides visibility to their service through integrations with a central security analytics platform like Sumo Logic. By combining the threat events data from Cylance and other data sources, you can reduce your security risk and improve your overall security posture.
The Sumo Logic App for Cylance allows you to analyze Cylance security events by type, status, and detection method. You can use the App to investigate Cylance-specific events and provide operational visibility to team members without needing to log into Cylance.
Step 1: Configure a Collector
To create a new Sumo Logic Hosted Collector, perform the steps in Configure a Hosted Collector.
Step 2: Configure a Source
- Perform the steps in Configure a Cloud Syslog Source. and configure the following Source fields:Example: prod/web/apache/access. For details see Best Practices.
1. **Name**. (Required) A name is required. Description is optional.
2. **Source Category**. (Required) [Provide a realistic Source Category example for this data type.] The Source Category metadata field is a fundamental building block to organize and label Sources. - In the Advanced section, specify the following configurations: 3. Enable Timestamp Parsing. True 4. Time Zone. Logs are in UTC by default 5. Timestamp Format. Auto Detect
- Click Save.
Copy and paste the token in a secure location. You will need this when you configure Cylance Syslog Settings.
Step 3: Configure Logging in Cylance
Before your can configure Sumo Logic to ingest logs, you must set up remote log streaming on Cylance. For instructions, refer to the following documentation:
In Cylance, go to Settings > Application.
In the Integrations section, activate the Syslog/SIEM check box.
Under Event Types, activate the checkboxes for all events.
For SIEM, select Sumo Logic as the destination.
For Protocol, select TCP.
Activate the check box TLS/SSL.
Enter your IP/Domain.
Enter your Port.
For Severity, select Alert (1).
For Facility, select Internal (5).
For Custom Token, enter the token from the Sumo Logic Cloud Syslog Source. The token should end with @41123. This number is the Sumo Logic Private Enterprise Number (PEN).
Click Save.
Field Extraction Rules
The following extraction rules use different approaches.
_sourceCategory=*cylance* "Event Type:" AuditLog
| parse "Event Type: *, Event Name: *," as event_type, event_name nodrop
| parse "Message: *," as msg nodrop | parse "Source IP: *," as src_ip nodrop | parse "User: *" as user nodrop
| parse field=msg "Device: * was auto assigned to Zone: *" as device_name, zone nodrop
| parse field=msg "Provider: *" as provider nodrop
| parse regex field=msg "Device:\s*(?<device_name>[^\s]*)\s*$" nodrop
| parse field=msg "Tier: *; Zones: *; Agent Version: *" as tier, zone, agent_version nodrop
| parse field=msg "Policy Assigned: *; Devices: *" as policy, device_name nodrop
| parse field=msg "Device: *; " as device_name nodrop
| parse field=msg "Devices: *" as device_name nodrop
| parse field=msg "SHA256: *" as sha nodrop
| parse field=msg "Zone: *; Policy Assigned: *; Policy Applied To All Devices In Zone: *" as zone, policy, PolicyAppliedToAllDevicesInZone
_sourceCategory=*cylance* "Event Type: Device"
| parse "Event Type: *, Event Name: *," as event_type, event_name nodrop
| parse "Device Name: *, Agent Version: *, IP Address: (*), MAC Address: (*), Logged On Users: (*), OS: *, Zone Names: (*)" as device_name, agent_version, ip_address, mac_address, LoggedOnUsers, os, zone nodrop
| parse "Device Name: *, Zone Names: (*), Device Id: *" as device_name, zone, device_id
| parse "Device Message: *, User: *, Zone Names: (*), Device Id: *" as  device_message, user, zone, device_id nodrop
| parse regex field=ip_address "\s*(?<ipaddress>[^,]*)" multi nodrop
| parse field=device_message "Device: *; " as device_name nodrop
| if (isempty(ipaddress), ip_address, ipaddress) as ip_address
| parse regex field=LoggedOnUsers "\s*(?<users>[^,]*)" multi nodrop
| if (isempty(users), user, users) as user
_sourceCategory=*cylance* "Event Type: DeviceControl"
| parse "Event Type: *, Event Name: *," as event_type, event_name nodrop
| parse "Device Name: *, External Device Type: *, External Device Vendor ID: *,
External Device Name: *, External Device Product ID: *, External Device Serial Number: *,
Zone Names: (*), Device Id: *, Policy Name: *" as device_name, external_device_type,
external_device_vendor_id, external_device_name, external_device_product_id,
external_device_serialno, zone, device_id, policy nodrop
_sourceCategory=*cylance* ExploitAttempt
| parse "Event Type: *, Event Name: *, Device Name: *, IP Address: (*), Action: *, Process ID: *, Process Name: *, User Name: *, Violation Type: *, Zone Names: (*), Device Id: *, Policy Name: *" as event_type, event_name, device_name, ip_address, action, pid, pname, user, violation, zone, device_id, policy
_sourceCategory=*cylance* ScriptControl
| parse "Event Type: *, Event Name: *, Device Name: *, File Path: *, Interpreter: *, Interpreter
Version: *, Zone Names: (*), User Name: *, Device Id: *, Policy Name: *" as event_type,
event_name, device_name, filepath, interpreter, interpreterVersion, zone, user, device_id,
policy nodrop
_sourceCategory=*cylance* Threat "Event Type: Threat"
| parse "Is Malware: *, " as malware_status nodrop
| parse "Event Type: *, Event Name: *," as event_type, event_name nodrop
| parse "Device Name: *, IP Address: (*), File Name: *, Path: *, Drive Type: *, SHA256: *,
MD5: *, Status: *, Cylance Score: *, Found Date: *, File Type: *, Is Running: *, Auto Run: *,
Detected By: *, Zone Names: (*)" as device_name, ip_address, file_name, path, drive_type, sha,
md5, status, score, found, file_type, isRunning, autoRun, detected_by, zone  nodrop
| parse "Is Unique To Cylance: *, Threat Classification: *, Device Id: *, Policy Name: *"
as isUniqueToCylance, threatClassification, device_id, policy nodrop
_sourceCategory=*cylance* ThreatClassification
| parse "Event Type: *, Event Name: *, Threat Class: *, Threat Subclass: *, SHA256: *, MD5: *"
as event_type, event_name, threat_class, threat_subclass, sha, md5
_sourceCategory=*cylance* "Event Type:" AppControl
| parse "Event Type: *," as event_type nodrop
| parse "Event Name: *, Device Name: *, IP Address: (*), Action: *, Action Type: *, File Path: *,
SHA256: *" as event_name, device_name, ip_address, action, action_type, filepath, sha nodrop
Installing the Cylance App
This section demonstrates how to install the Cylance App, as well as providing examples of each of the dashboards. The App preconfigured searches and Dashboards provide easy-to-access analytic visualizations of your data.
Now that you have set up log collection for Cylance, you can install the Cylance App.
To install the app:
Locate and install the app you need from the App Catalog. If you want to see a preview of the dashboards included with the app before installing, click Preview Dashboards.
- From the App Catalog, search for and select the app.
- Select the version of the service you're using and click Add to Library.
20 Version selection is applicable only to a few apps currently. For more information, see Installing the Apps from the Library.
- To install the app, complete the following fields.
- App Name. You can retain the existing name, or enter a name of your choice for the app.
- Data Source. Select either of these options for the data source.
- Choose Source Category, and select a source category from the list.
- Choose Enter a Custom Data Filter, and enter a custom source category beginning with an underscore. Example: (
_sourceCategory=MyCategory).
- Advanced. Select the Location in Library (the default is the Personal folder in the library), or click New Folder to add a new folder.
- Click Add to Library.
Once an app is installed, it will appear in your Personal folder, or other folder that you specified. From here, you can share it with your organization.
Panels will start to fill automatically. It's important to note that each panel slowly fills with data matching the time range query and received since the panel was created. Results won't immediately be available, but with a bit of time, you'll see full graphs and maps.
Viewing Cylance Dashboards
Each dashboard has a set of filters that you can apply to the entire dashboard, as shown in the following example. Click the funnel icon in the top dashboard menu bar to display a scrollable list of filters that are applied across the entire dashboard.
You can use filters to drill down and examine the data on a granular level.
Each panel has a set of filters that are applied to the results for that panel only, as shown in the following example. Click the funnel icon in the top panel menu bar to display a list of panel-specific filters.
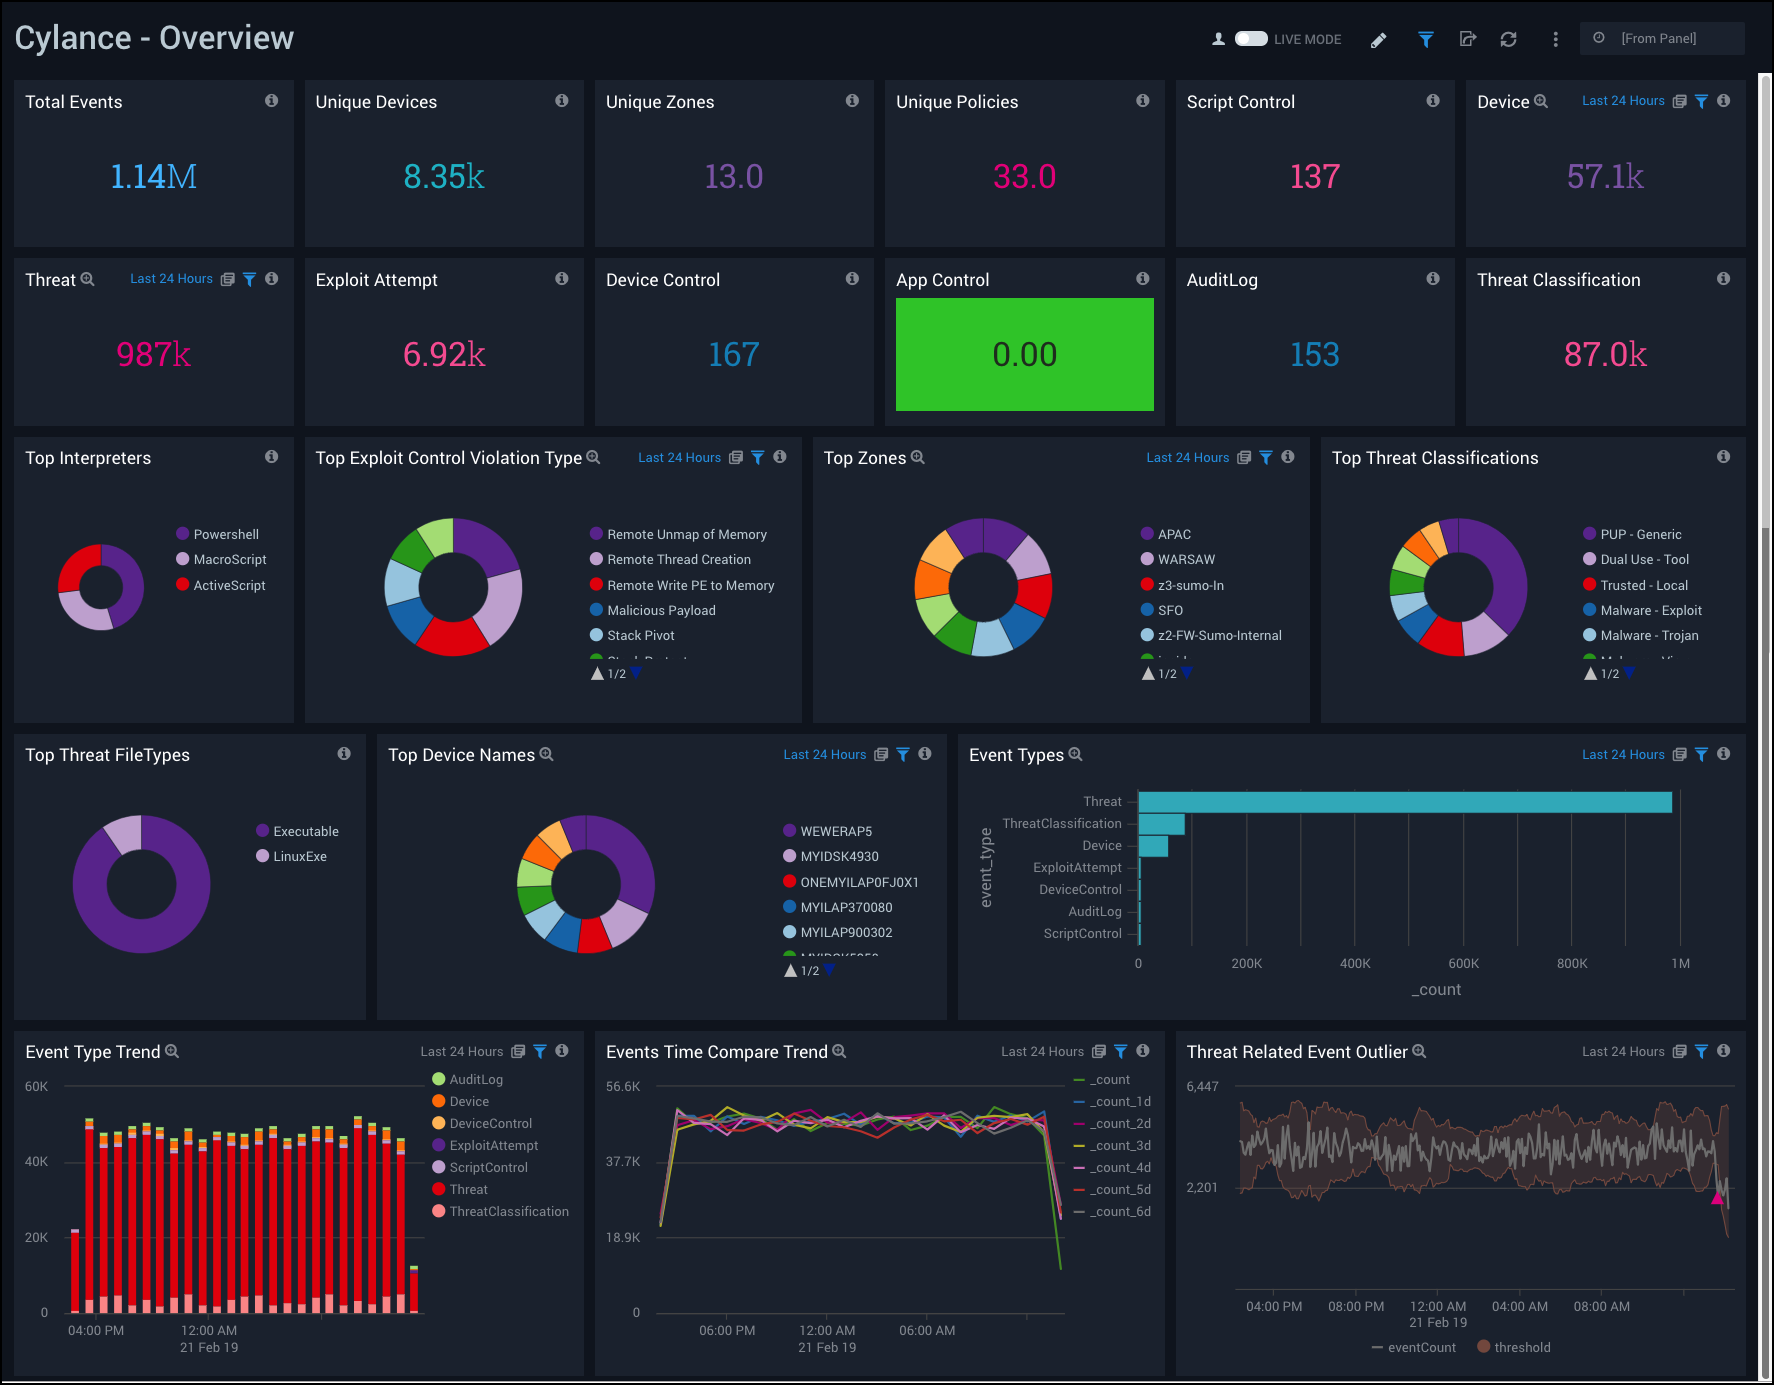
Overview
The Cylance - Overview Dashboard a high-level view of threat incidents experienced on your network. The dashboard panels provide at-a-glance graphs with details and analytics on exploit control violation types, zones, threat classifications, devices, threat file types, event types and trends, event outliers, and event time compare trends.
Use this dashboard to:
- Analyze summaries of each prevention component, such as script control, memory exploit protection, device control, application control, AI based threat classification, and user actions performed from Cylance Web Console.
- View of threats in the system, and drill down into specific prevention mechanisms and threat events by clicking in the panel.
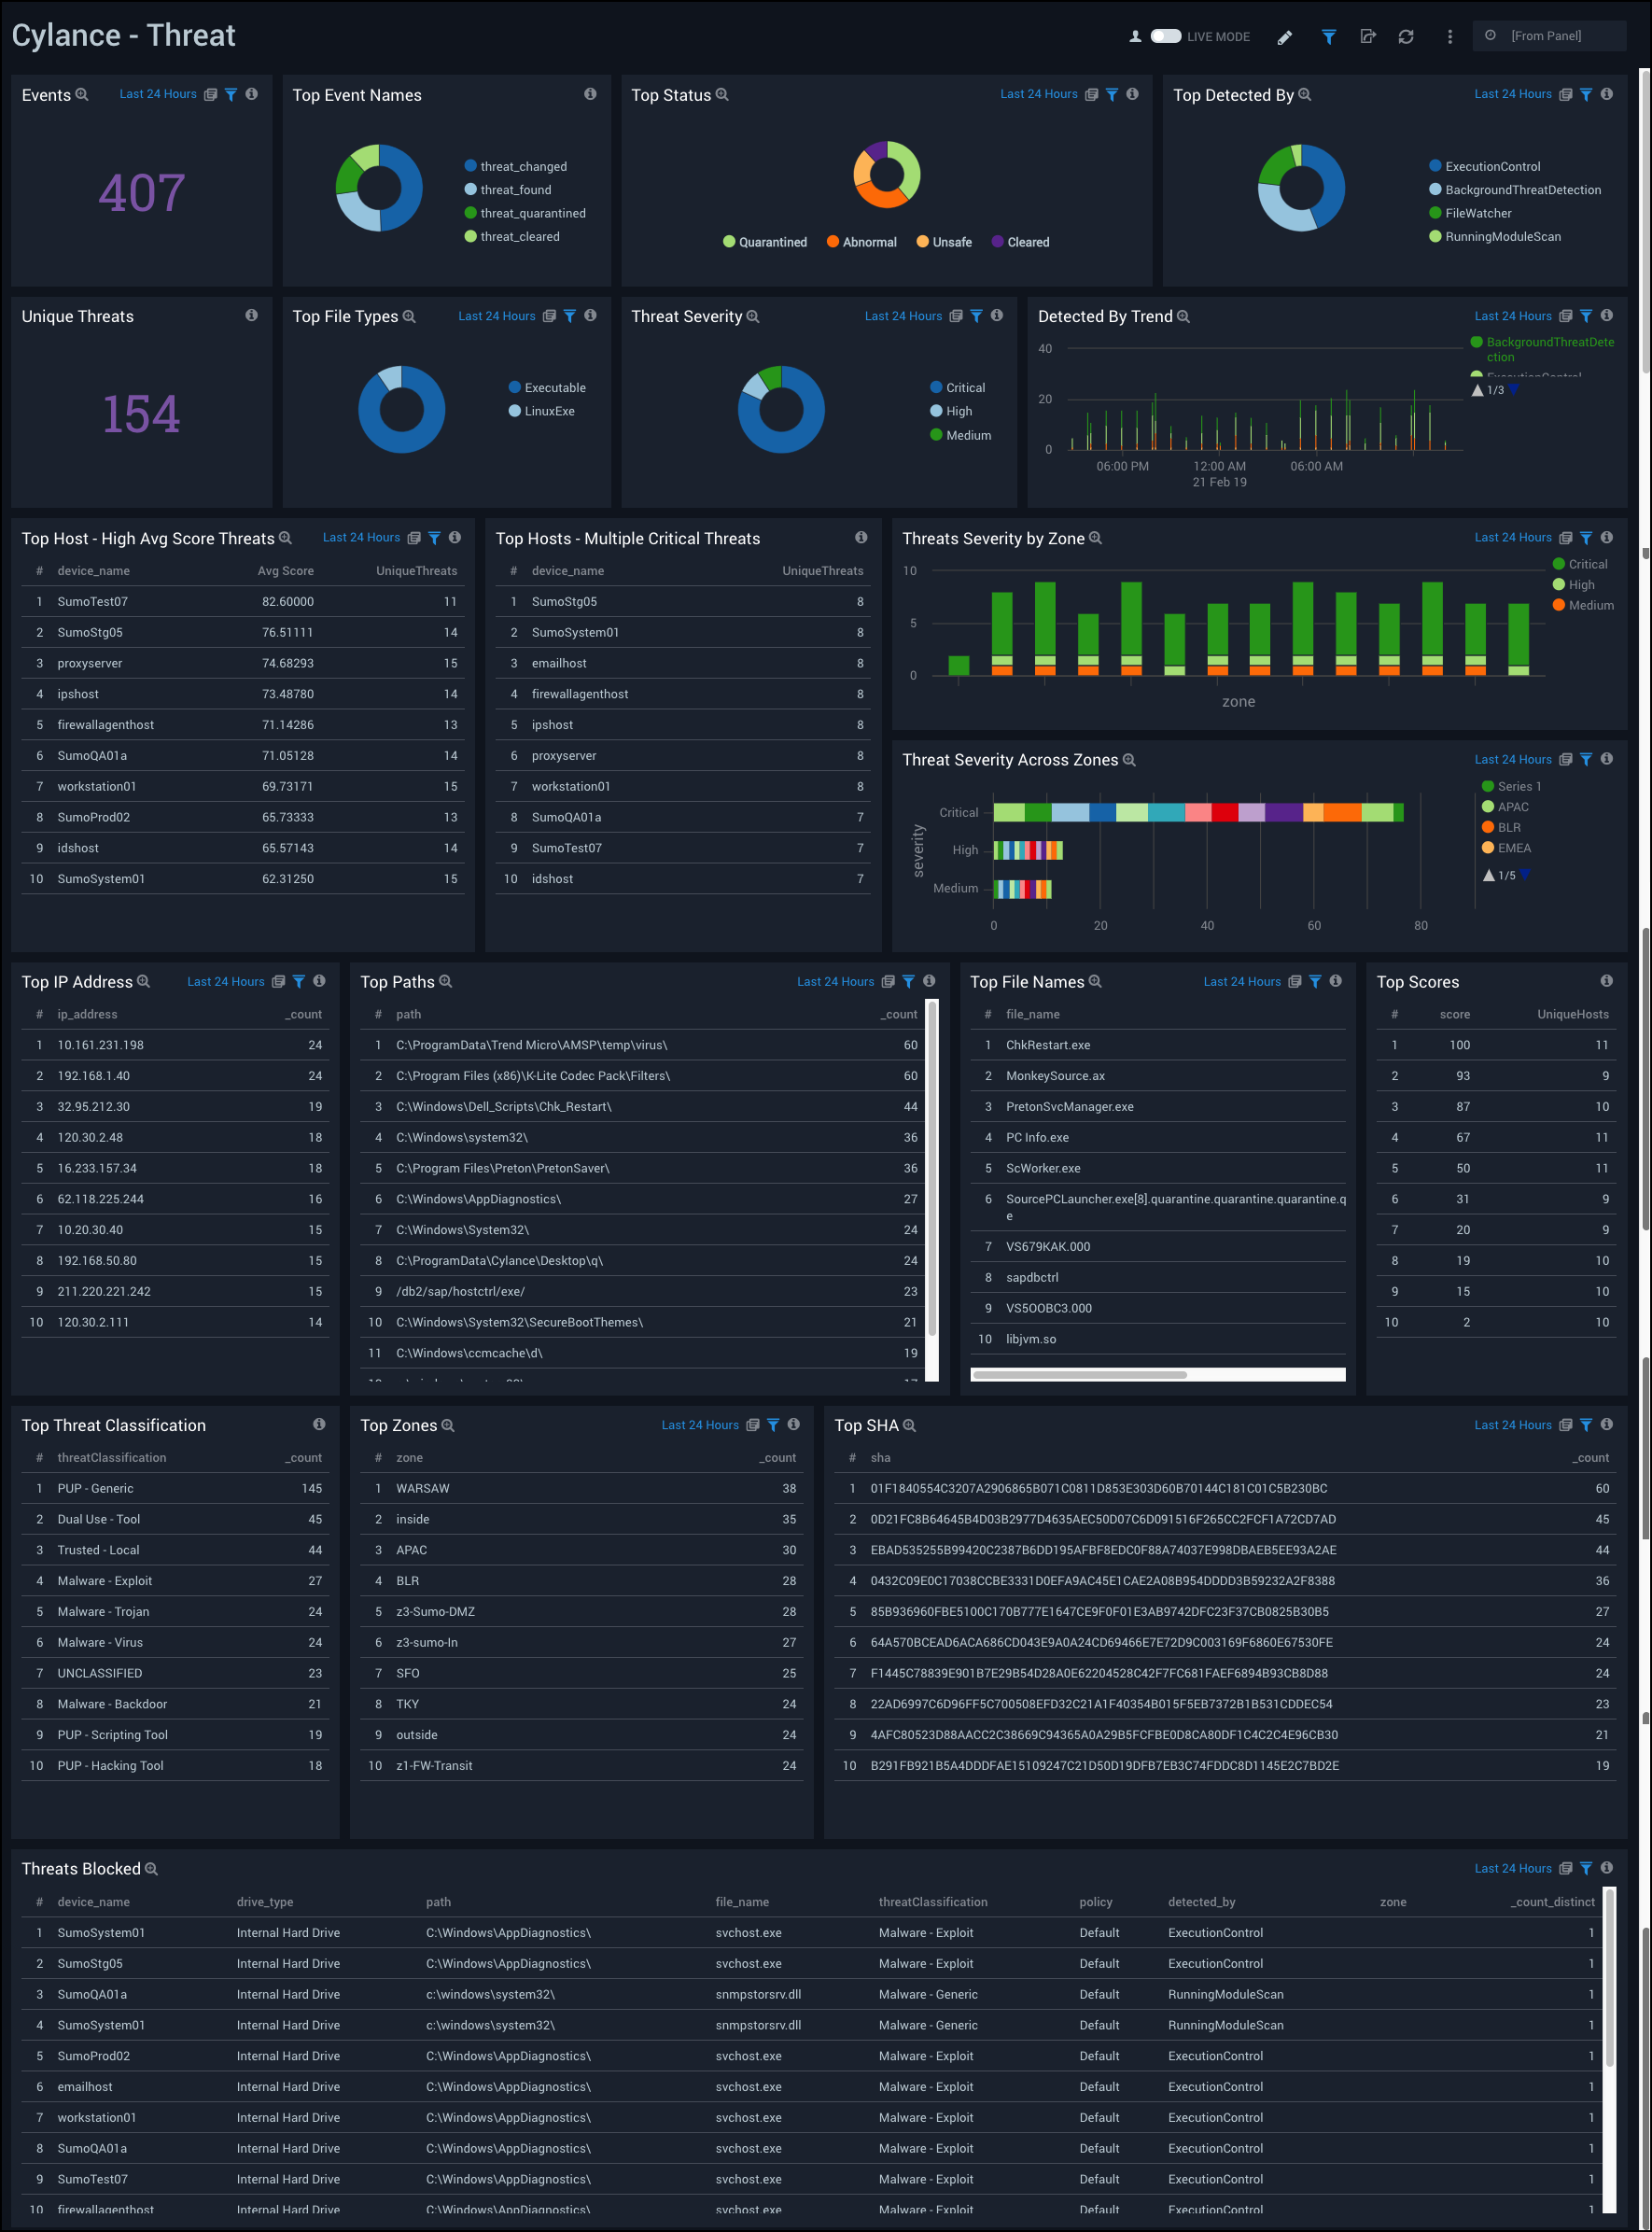
Threat
The Cylance - Threat Dashboard provides a high-level view of the threats experienced on your network. Dashboard panels display graphs and detailed information with the number of events, top event names, status, file types, unique threats, severity, hosts with the most threats, threat origination, classification, and blocked threats.
Use this dashboard to:
- Determine hosts (IP Address, device names) and zones affected by various threats identified and handled in the system.
- Monitor files affected with SHA occurring multiple times, and various paths of the files, to understand the threat footprint.
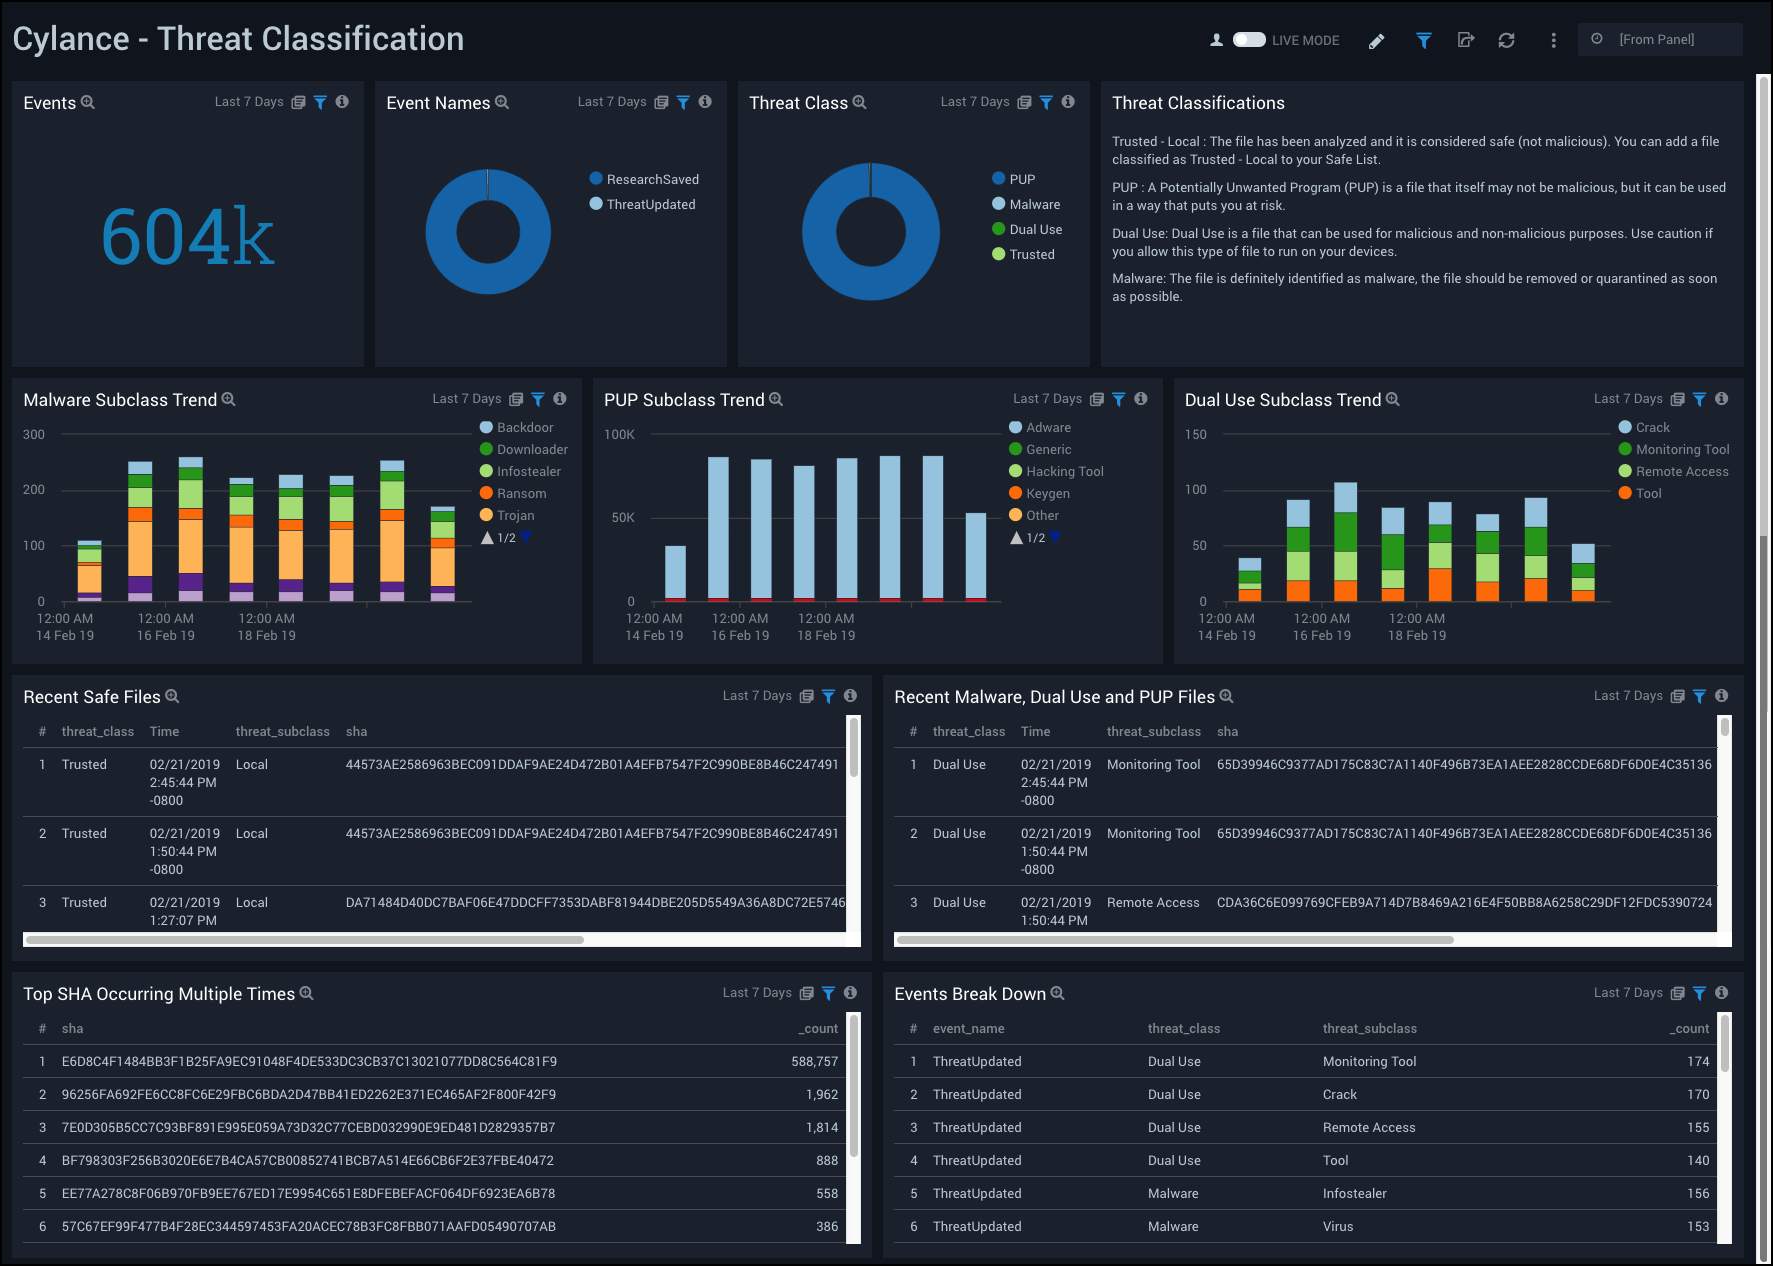
Threat Classification
The Cylance - Threat Classification Dashboard provides an insightful view of the types of threats experienced on your network. Dashboard panels are a mixture of graphs and detailed information on events, event names, threat class, subclass trends, safe files, malware files, and an event breakdown.
Use this dashboard to:
- Determine how threats in your organization are analyzed and classified by Cylance Research Team.
- Assess threats by classification: Malware, PUP - Potentially Unwanted Programs, Dual Use, Trusted Local, and Unknown.
- Identify Trusted - Local files and add them to your Safe List in Cylance. For more details on classification and subs-classification see the Cylance documentation.
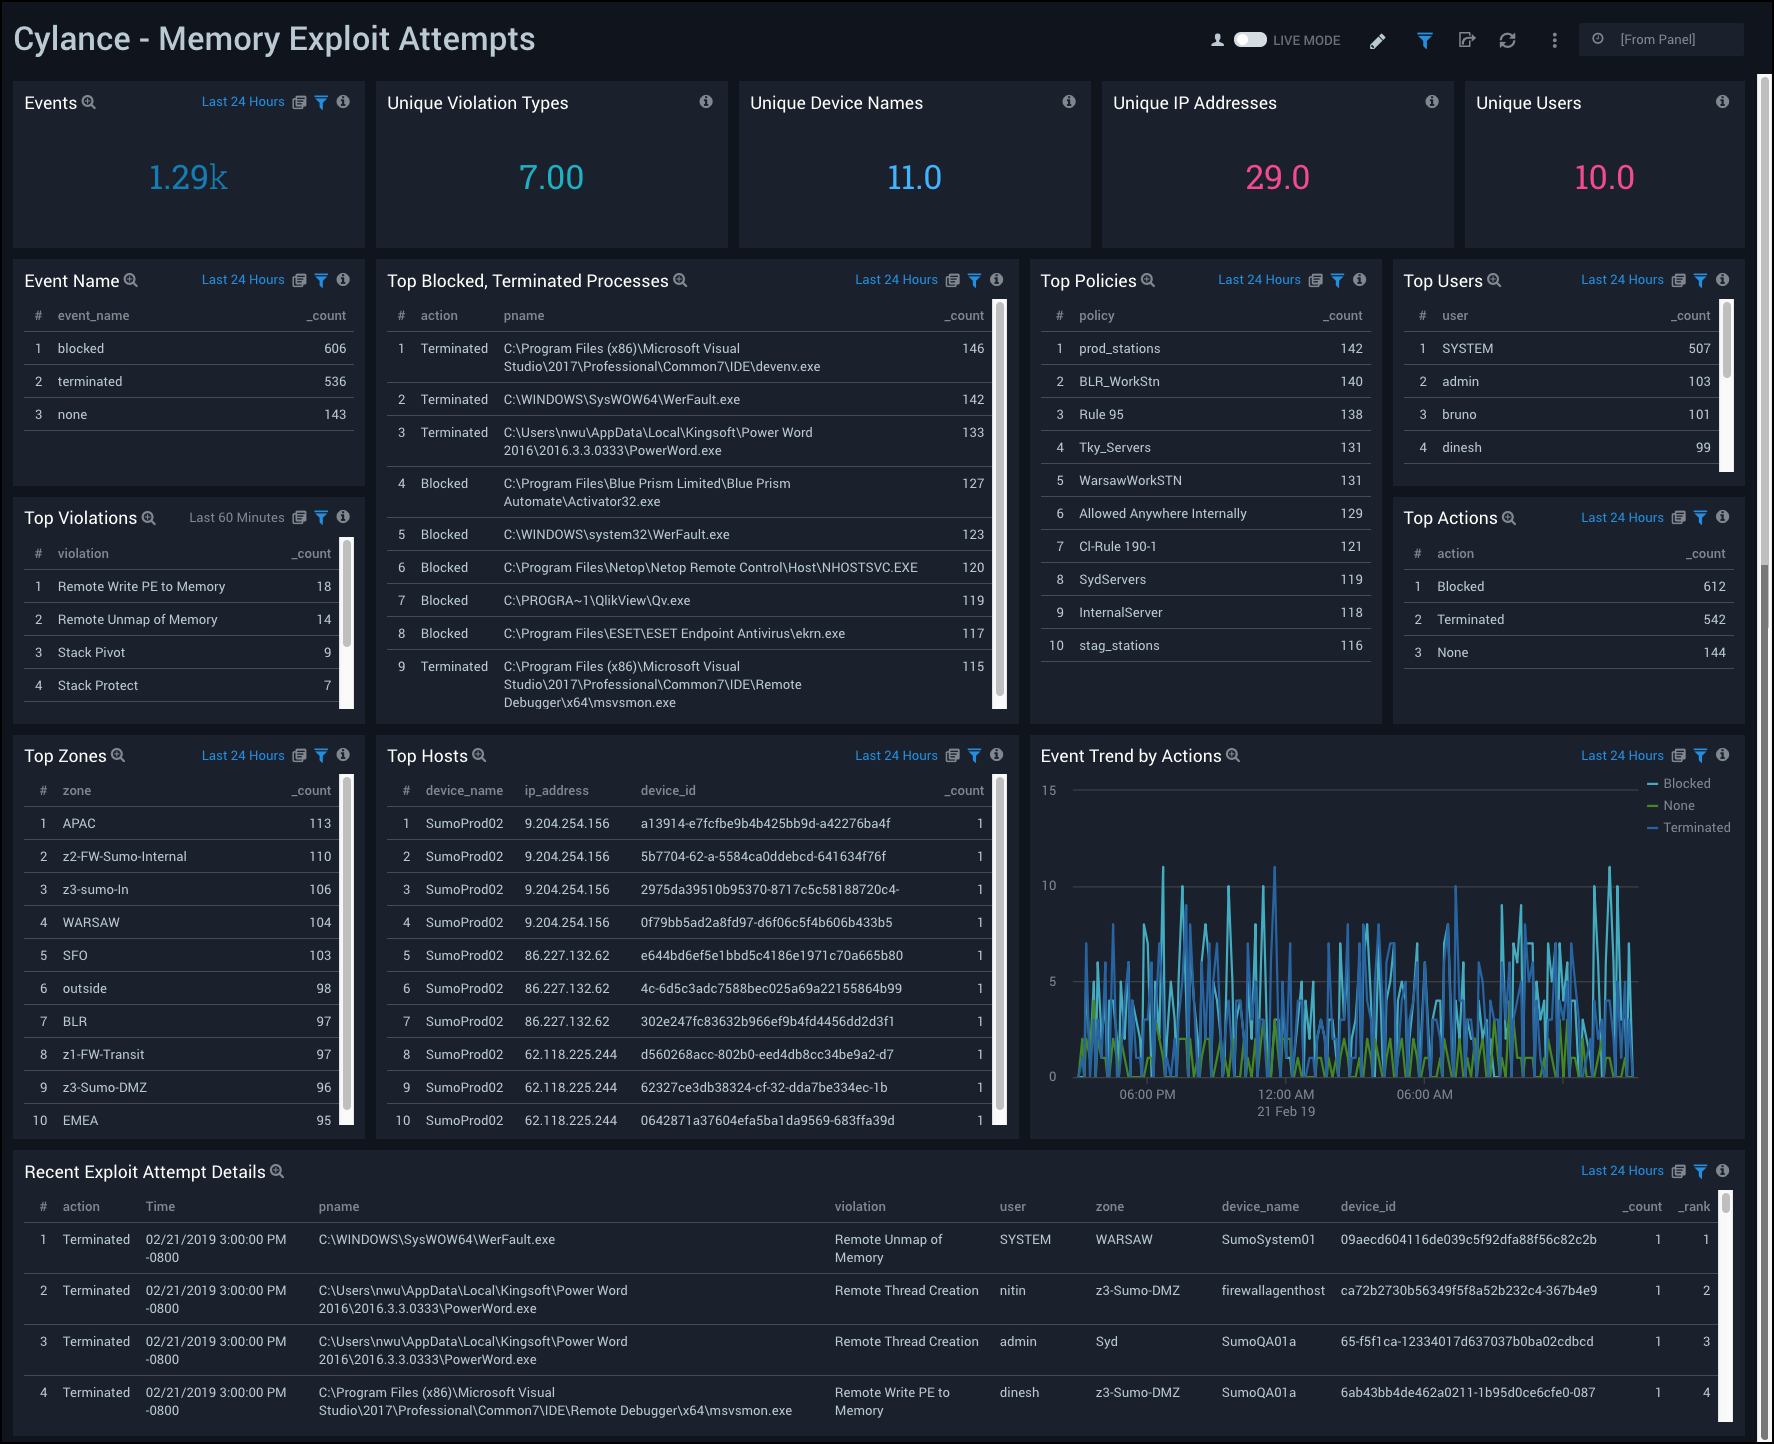
Memory Exploit Attempts
The Cylance - Memory Exploit Attempts Dashboard provides a high-level view of threats on your network that attempt to exploit memory. Dashboard panels show detailed information on events, violations, blocked and terminated processes, policies, users, hosts, actions, and event trends by action.
Whenever the agent detects certain hard-coded behaviors considered to be indicative of a compromise, an event is communicated to the service before the hooked API function is allowed to complete. The service then responds with an action for the agent to take, such as:
- Ignore the violation and let it execute
- Alert on the violation, but let it execute
- Block the violation and send an alert
- Terminate the process completely
Use this dashboard to:
- Identify the most common policy violations, processes and highly impacted systems in your environment.
- Monitor when, where, and what actions are taken with the configured policies in your environment.
- Devise any necessary policies changes based on findings.
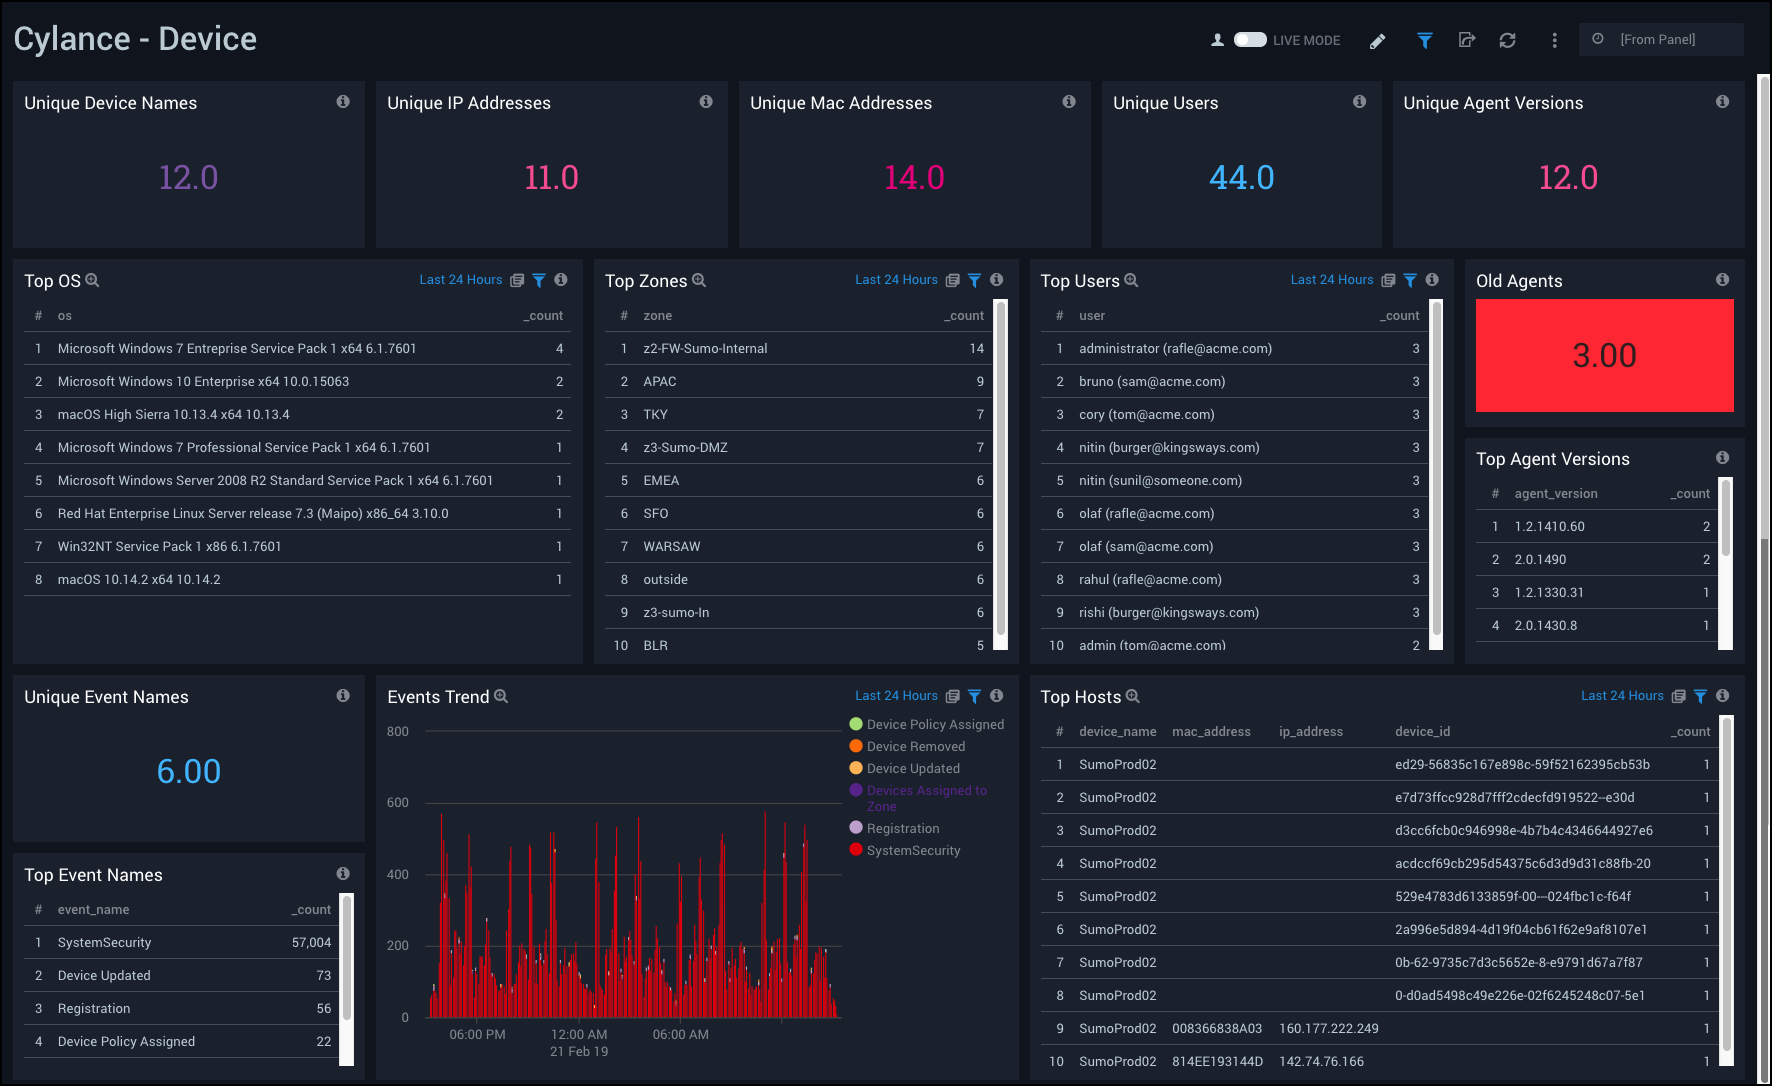
Device
The Cylance - Device Dashboard provides insights into the devices on your network that receive in threats. Dashboard panels provide information on unique device names, IP addresses, MAC addresses, users, hosts, operating systems, event names, and event trends.
Use this dashboard to:
- Analyze devices under protection by Cylance agent.
- Monitor new devices being registered, updated, and the policies assigned to them.
- Investigate devices that have been removed from protection.
- Assess whether to push the latest agent version, if any device is found running on old or outdated version.
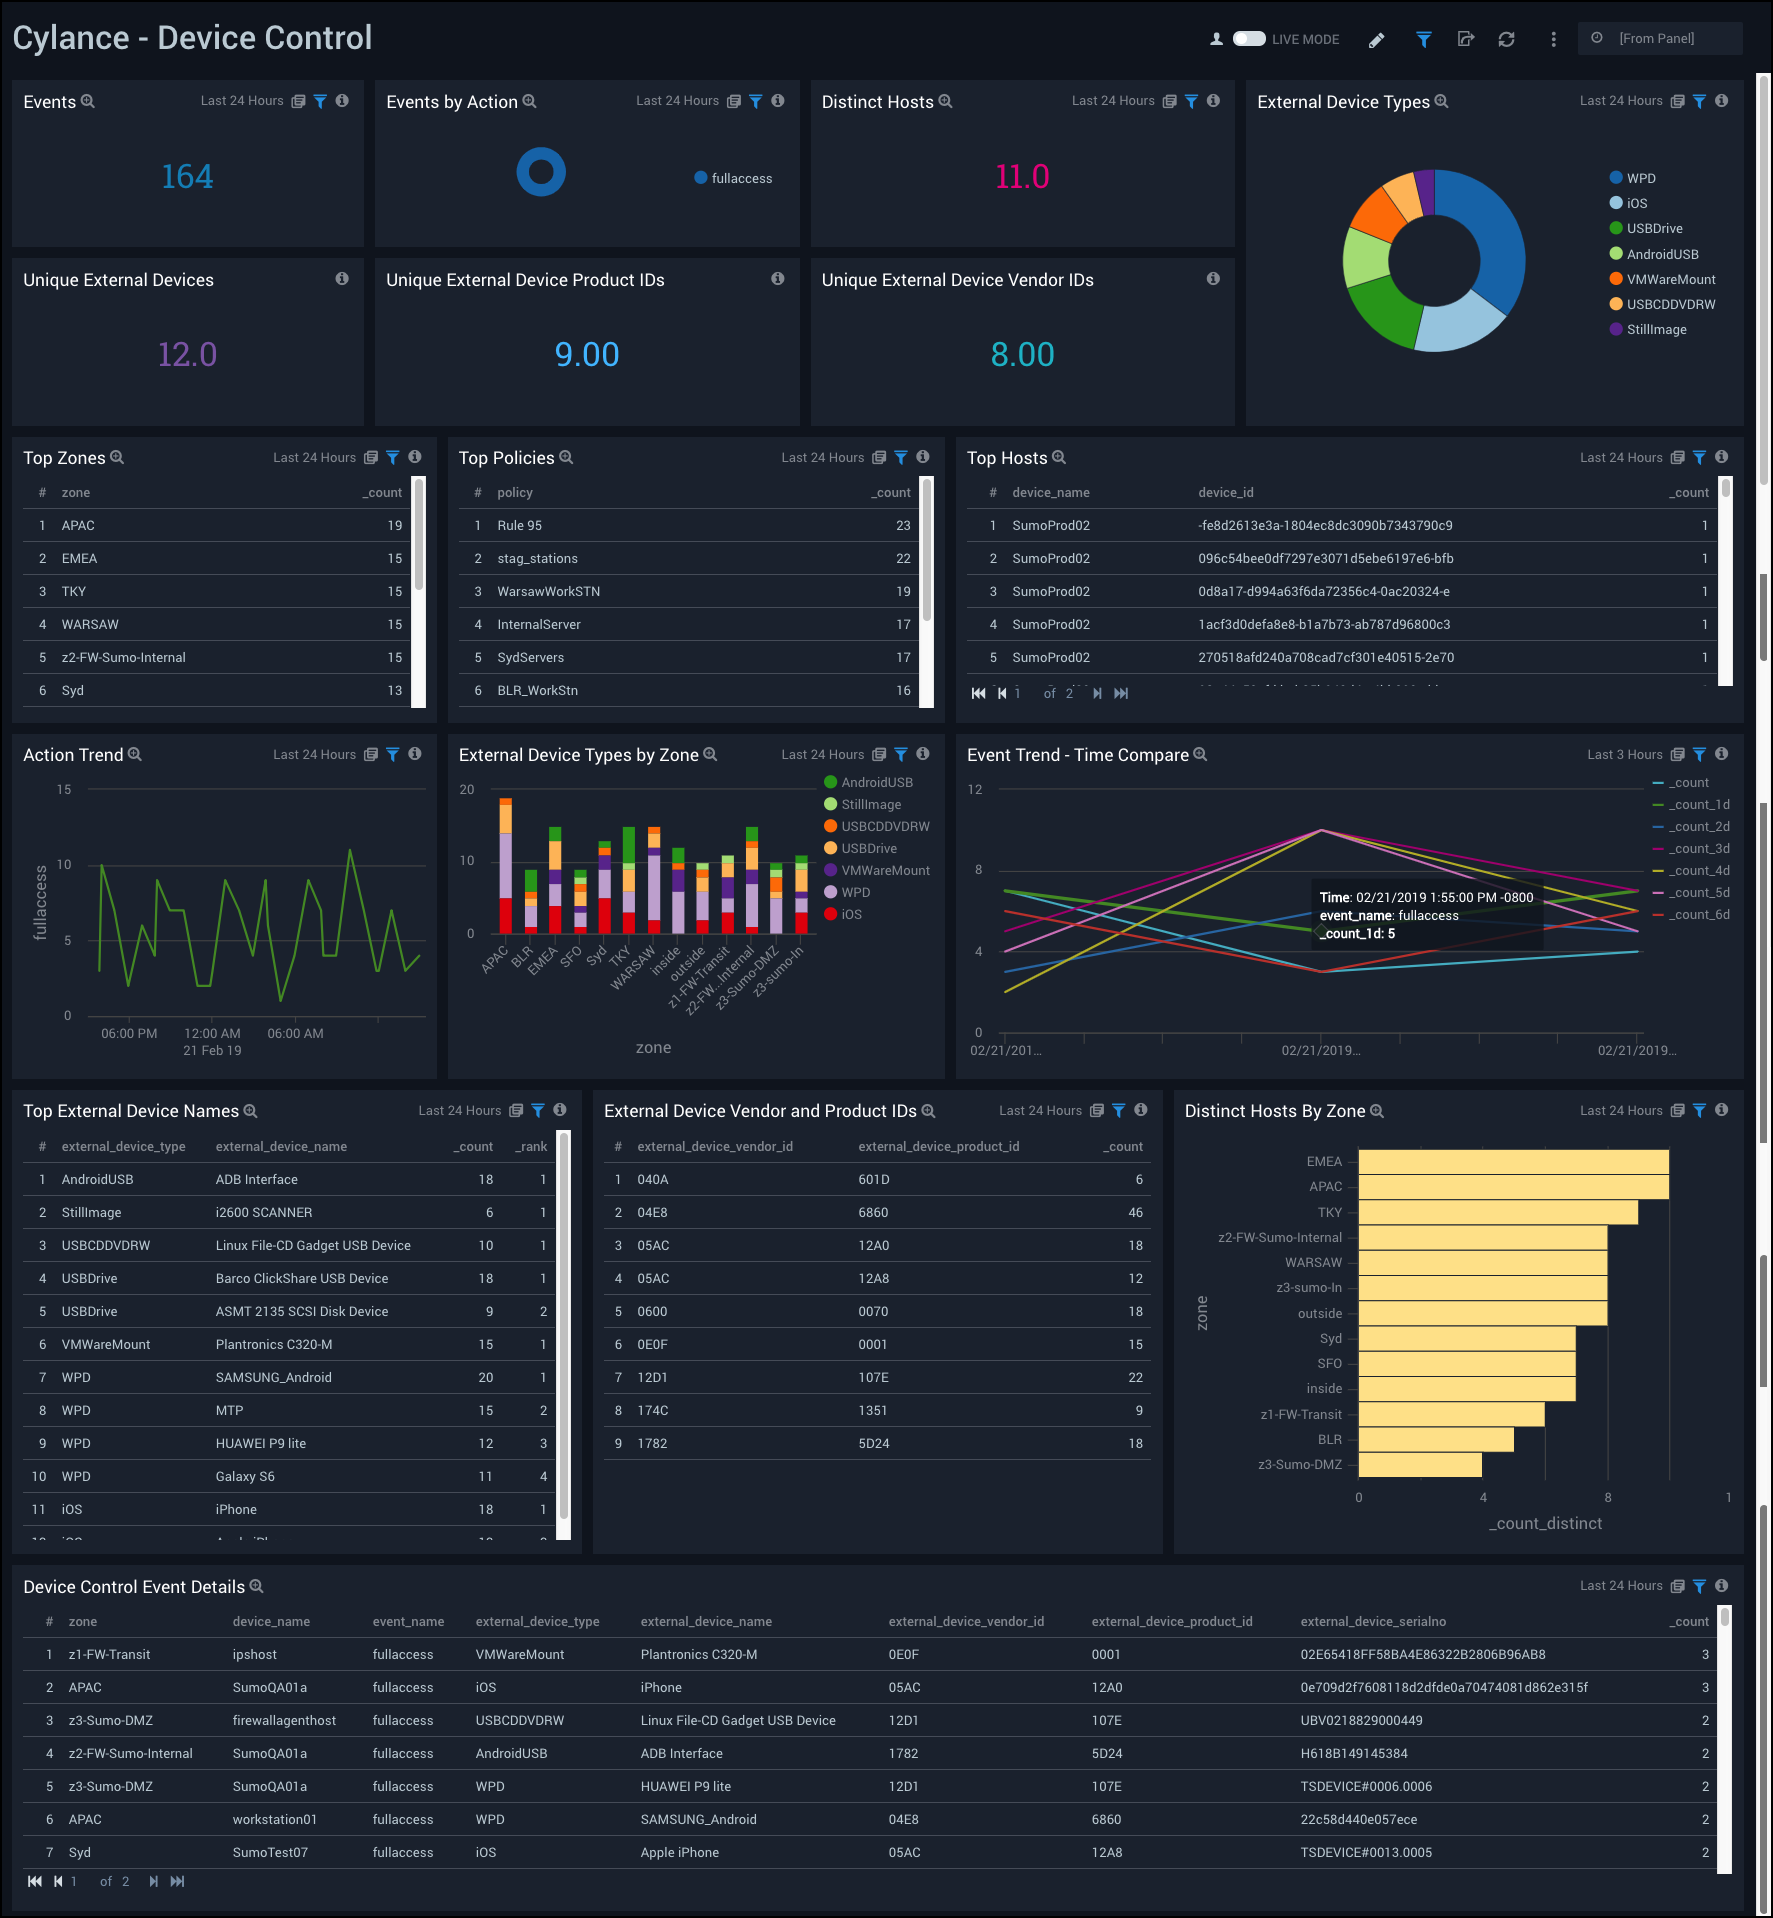
Device Control
The Cylance - Device Control Dashboard provides insights into external devices involved in threats on your network. Dashboard panels provide graphs and detailed information on events, hosts, unique external devices, event and action trends, and device control event details.
Use this dashboard to:
- Monitor external devices (like USB mass storage device) connected to your environment.
- Assess which devices to connect to your systems.
- Grant and revoke access rights to specific devices, or a group of device categories.
- Monitor external devices by their Vendor ID, Product ID, and Serial Number.
- Define exceptions to the policy by vendor ID, as necessary.
You can set an exception for a Vendor ID. Use a Product ID and Serial Number for more specific exceptions.
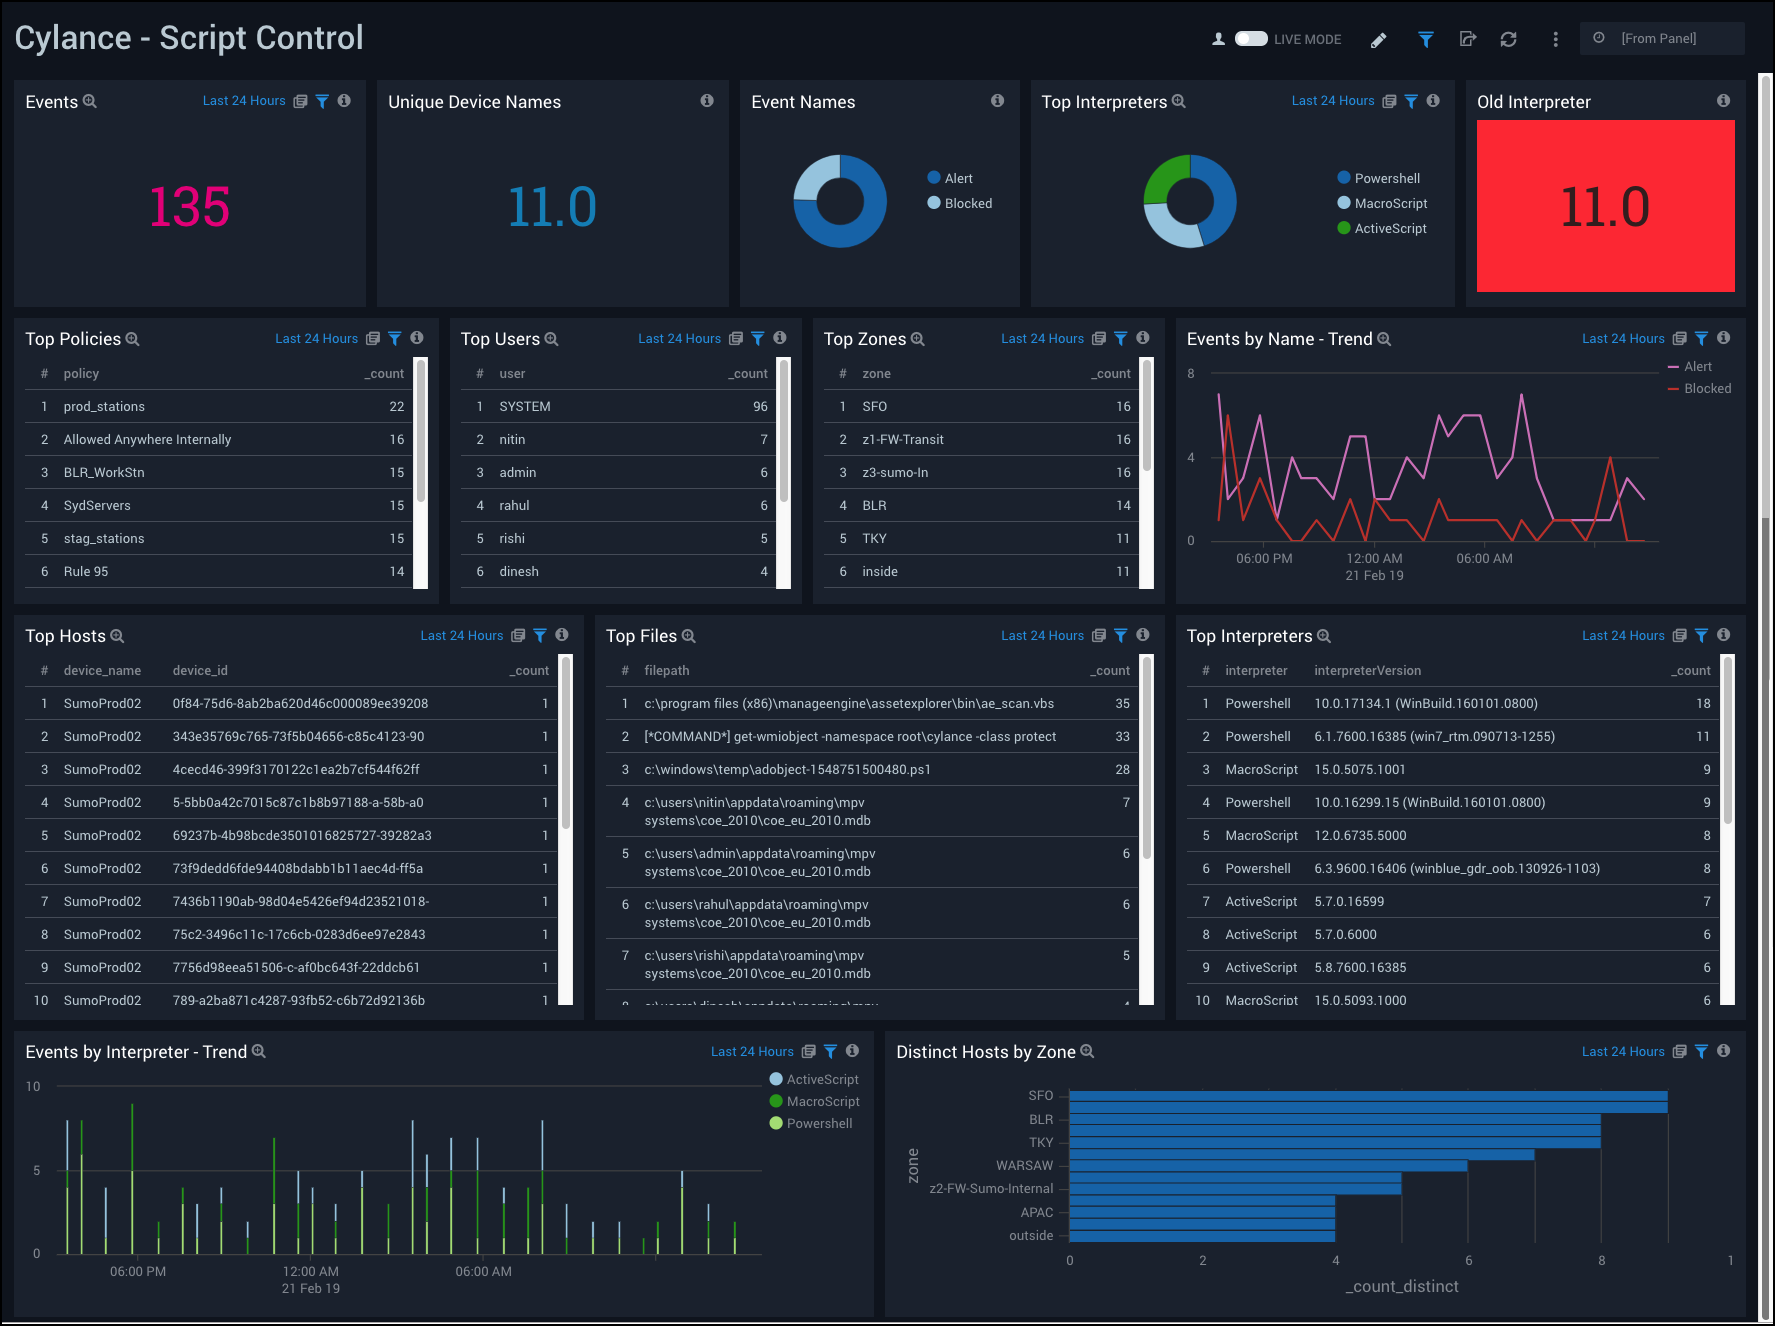
Script Control
The Cylance - Script Control Dashboard provides insights regarding scripts on your network. Dashboard panels provide graphs and detailed information on events, devices, interpreters, users, zones, hosts, files, and event trends.
Script control injects into a script interpreter (responsible for the execution of scripts). By injecting into the interpreter, the agent is able to detect the script and script path before the script is executed.
Use this dashboard to:
- Monitor when, where, and how scripts are used in the environment. This ultimately reduces the attack surface on which an evildoer may distribute malware.
- Monitor and protect against scripts running in the environment.
- Monitor the interpreter version on your systems and decide to push latest version, when the system is running an out-dated version.
- Detect the script and script path before the script is executed.
- Monitor which scripts are getting blocked or executed with notification alerts.
- Change alert settings to block mode and only allow scripts to run out of specified folders, as necessary.
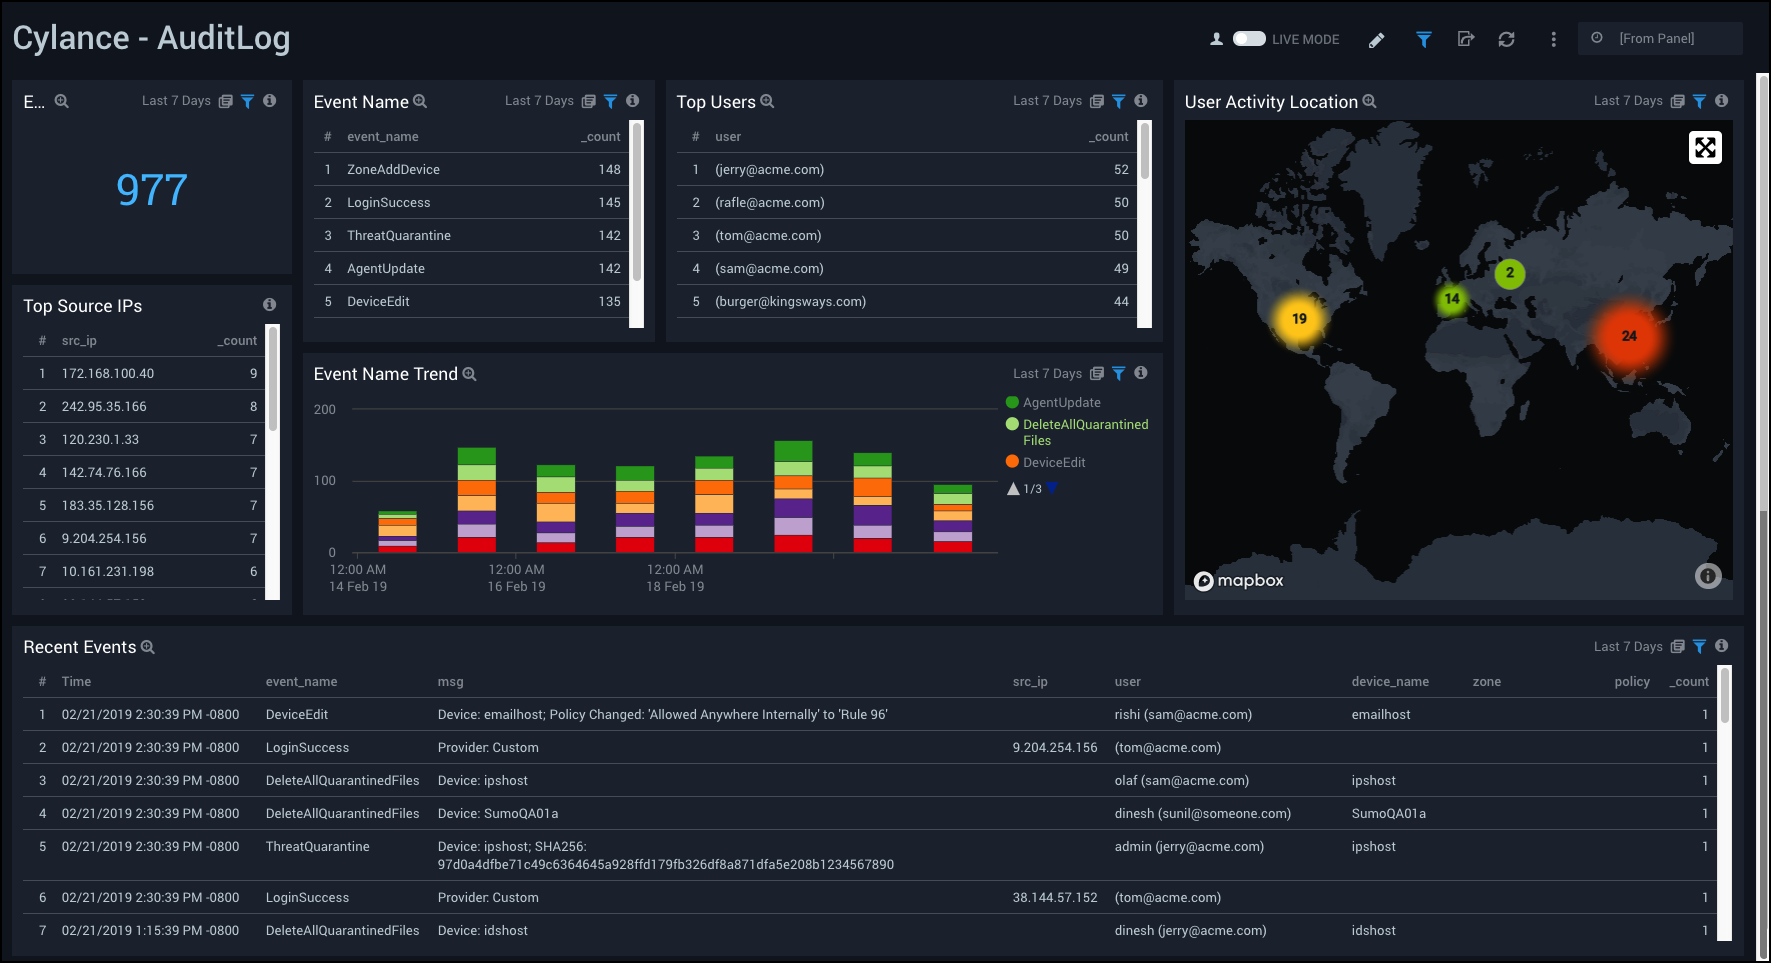
AuditLog
The Cylance - AuditLog Dashboard has easy to access information about audit logs for your network. Dashboard panels provide high-level graphs and detailed information showing the number of events, event names and trends, users and user geographic locations, source IPs, and a list of recent events.
Use this dashboard to:
- Monitor user activity performed from Cylance Web Console.
- Monitor users overriding, updating policies manually using Cylance Web Console.