Akamai Security Events
Akamai Security Events App allows you to visualize security events generated on the Akamai platform. The preconfigured dashboards provide insights into attack data, sources of attack, attack queries, geolocation of attack source, context on attack’s HTTP request, and rules triggered by the attack.
Log Types
The Akamai Security Events App uses security events generated on the Akamai platform by leveraging the V1 SIEM API and Sumo Logic’s Akamai SIEM API Source.
Sample Log Message
{
  "type": "akamai_siem",
  "format": "json",
  "version": "1.0",
  "attackData": {
    "rule": "",
    "ruleVersion": "",
    "ruleMessage": "",
    "ruleTag": "",
    "ruleData": "",
    "ruleSelector": "",
    "ruleAction": "",
    "configId": "76756",
    "policyId": "prag_136180",
    "clientIP": "13.29.10.10"
  },
  "httpMessage": {
    "requestId": "2d442db6",
    "start": "1627663284",
    "protocol": "HTTP/1.1",
    "method": "GET",
    "host": "fierce.force.com",
    "port": "80",
    "path": "/",
    "query": "v=999999.9 union all select 0x31303235343830303536,0x31303235343830303536",
    "requestHeaders": {
      "Host": "fierce.force.com",
      "User-Agent": "Mozilla/5.0 (Windows; U; Windows NT 5.1; en-US; rv:1.8.0.7) Gecko/20060909 Firefox/1.5.0.7",
      "Accept": "text/xml,application/xml,application/xhtml xml,text/html;q=0.9,text/plain;q=0.8,image/png,*/*;q=0.",
      "Keep-Alive": "300",
      "Proxy-Connection": "keep-alive",
      "Content-Length": "2"
    },
    "status": "200",
    "bytes": "22726",
    "responseHeaders": "Server%3a%20Apache%2f2.4.29%20(Ubuntu)...tive-Regex-Time%3a%20681%0d%0aAkamai-X-Request-ID%3a%202d442db6%0d%0a"
  },
  "geo": {
    "continent": "NA",
    "country": "US",
    "city": "WESTFORD",
    "regionCode": "MA",
    "asn": "7922"
  }
}
Sample Query
_sourceCategory=<akamai-foo>
| json field=_raw "attackData.clientIP", "attackData.configId", "attackData.policyId", "attackData.ruleAction", "attackData.rule", "attackData.ruleMessage", "attackData.ruleSelector", "attackData.ruleTag", "attackData.ruleVersion", "httpMessage.start", "httpMessage.status" as client_ip, config_id, policy_id, rule_action, rule, rule_message, rule_selector, rule_tag, rule_version, time_epoch, http_response nodrop
| time_epoch * 1000 as time_epoch_ms
|formatDate(toLong(time_epoch_ms), "MM-dd-yyyyHH:mm:ss") as attack_date
| json field=_raw "geo.city", "geo.continent", "geo.country", "geo.regionCode", "geo.asn" as city, continent, country, region_code, asn nodrop
|count by attack_date, client_ip, city, country, rule_action, rule, rule_message, rule_selector, rule_version, config_id, policy_id,http_response
Collecting Logs for Akamai Security Events App
To begin collecting logs for the Sumo App for Akamai Security Events:
- Create an Akamai SIEM API Source as described here
- Enable both Parsing options while creating the Akamai SIEM API Source. Parsing options:
- Decode httpMessage fields
- Duplicate Events once for each rule associated with the event
Installing the Akamai Security Events App
This section has instructions for installing the Sumo App for Akamai Security Events and descriptions of each of the app dashboards.
Locate and install the app you need from the App Catalog. If you want to see a preview of the dashboards included with the app before installing, click Preview Dashboards.
- From the App Catalog, search for and select the app.
- Select the version of the service you're using and click Add to Library. Version selection applies only to a few apps currently. For more information, see Installing the Apps from the Library.
- To install the app, complete the following fields.
- App Name. You can retain the existing name, or enter a name of your choice for the app.
- Data Source. Select either of these options for the data source.
- Choose Source Category, and select a source category from the list.
- Choose Enter a Custom Data Filter, and enter a custom source category beginning with an underscore. Example: (
_sourceCategory=MyCategory).
- Advanced. Select the Location in the Library (the default is the Personal folder in the library), or click New Folder to add a new folder.
- Click Add to Library.
Once an app is installed, it will appear in your Personal folder, or another folder that you specified. From here, you can share it with your organization.
Panels will start to fill automatically. It's important to note that each panel slowly fills with data matching the time range query and received since the panel was created. Results won't immediately be available, but with a bit of time, you'll see full graphs and maps.
Viewing Akamai Security Events Dashboards
Template variables provide dynamic dashboards that rescope data on the fly. As you apply variables to troubleshoot through your dashboard, you can view dynamic changes to the data for a fast resolution to the root cause. For more information, see the Filter with template variables help page.
Note: You can use template variables to drill down and examine the data on a granular level.
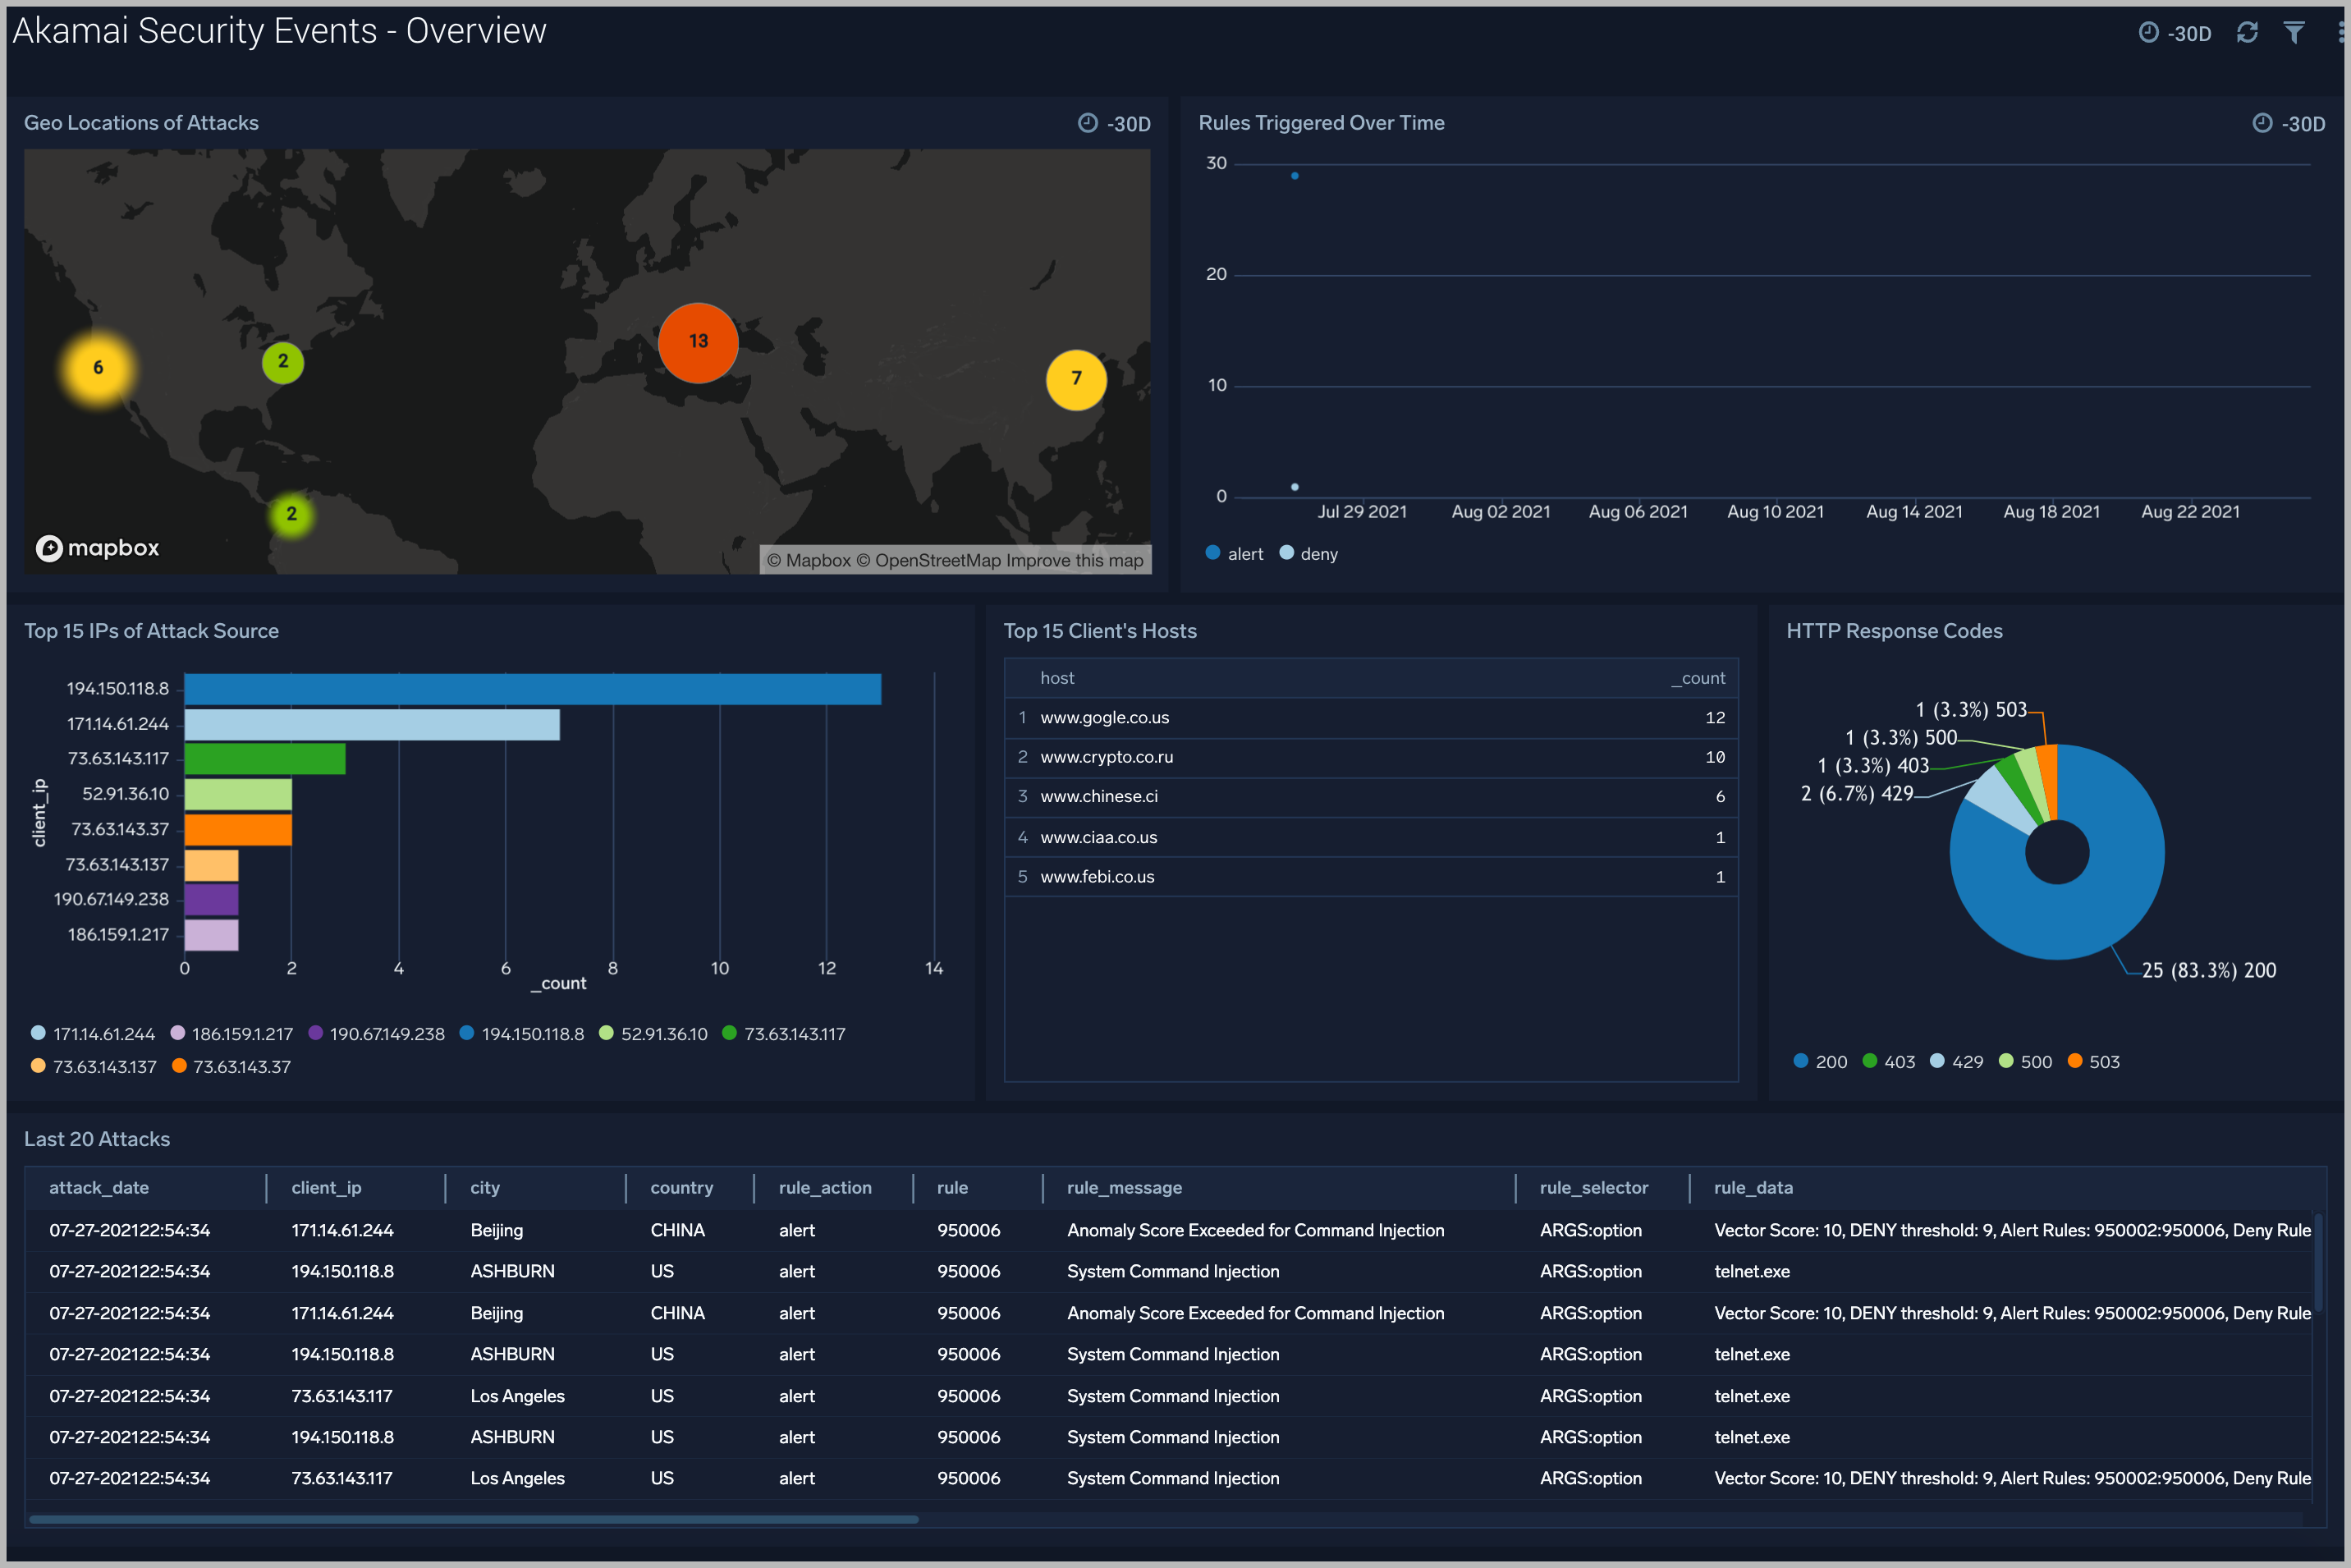
Overview
The Akamai Security Events - Overview dashboard gives you an at-a-glance view of security events generated on the Akamai Platform.
Use this dashboard to:
- Identify IPs of attack.
- Find Geolocation of the attack.
- Analyze summary of last 20 attacks.
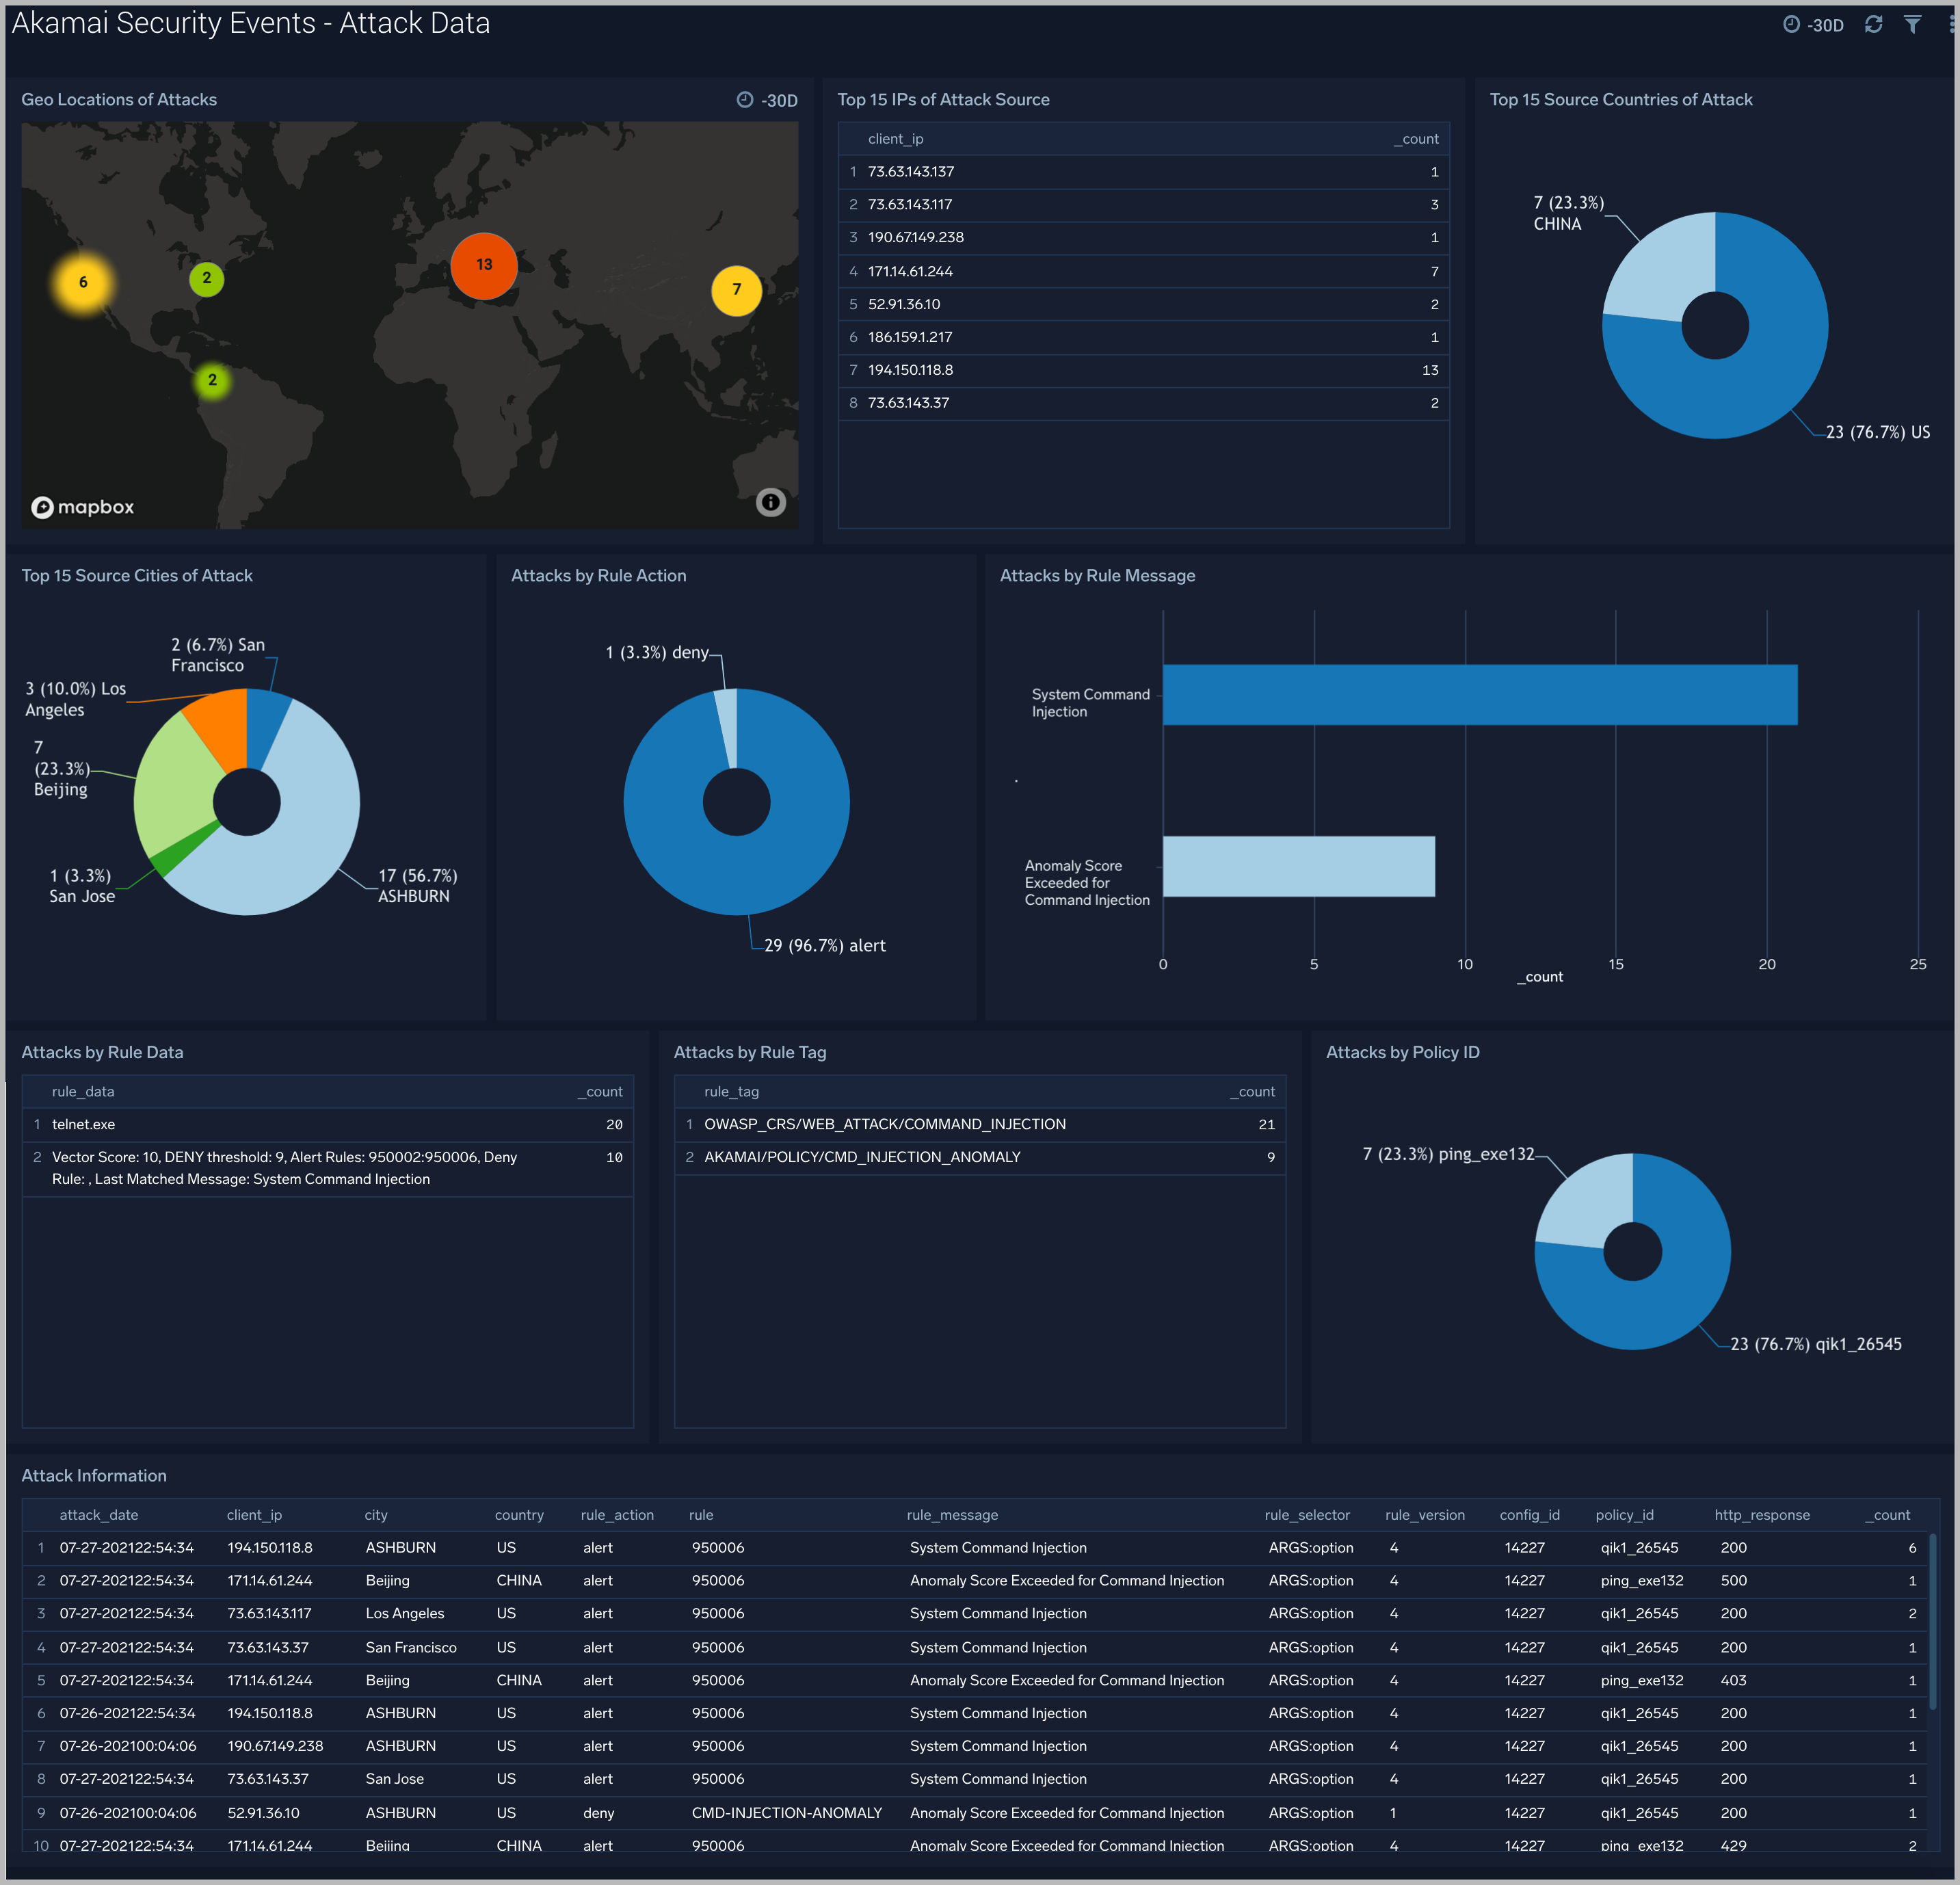
Attack Data
The Akamai Security Events - Attack Data dashboard helps you understand the nature of each attack and its corresponding Rule information.
Use this dashboard to:
- Identify IPs of attack.
- Find top sources of attack.
- Analyze messages reported by each triggered rule.
- Understand the nature of attacks, and contextual information around attacks.
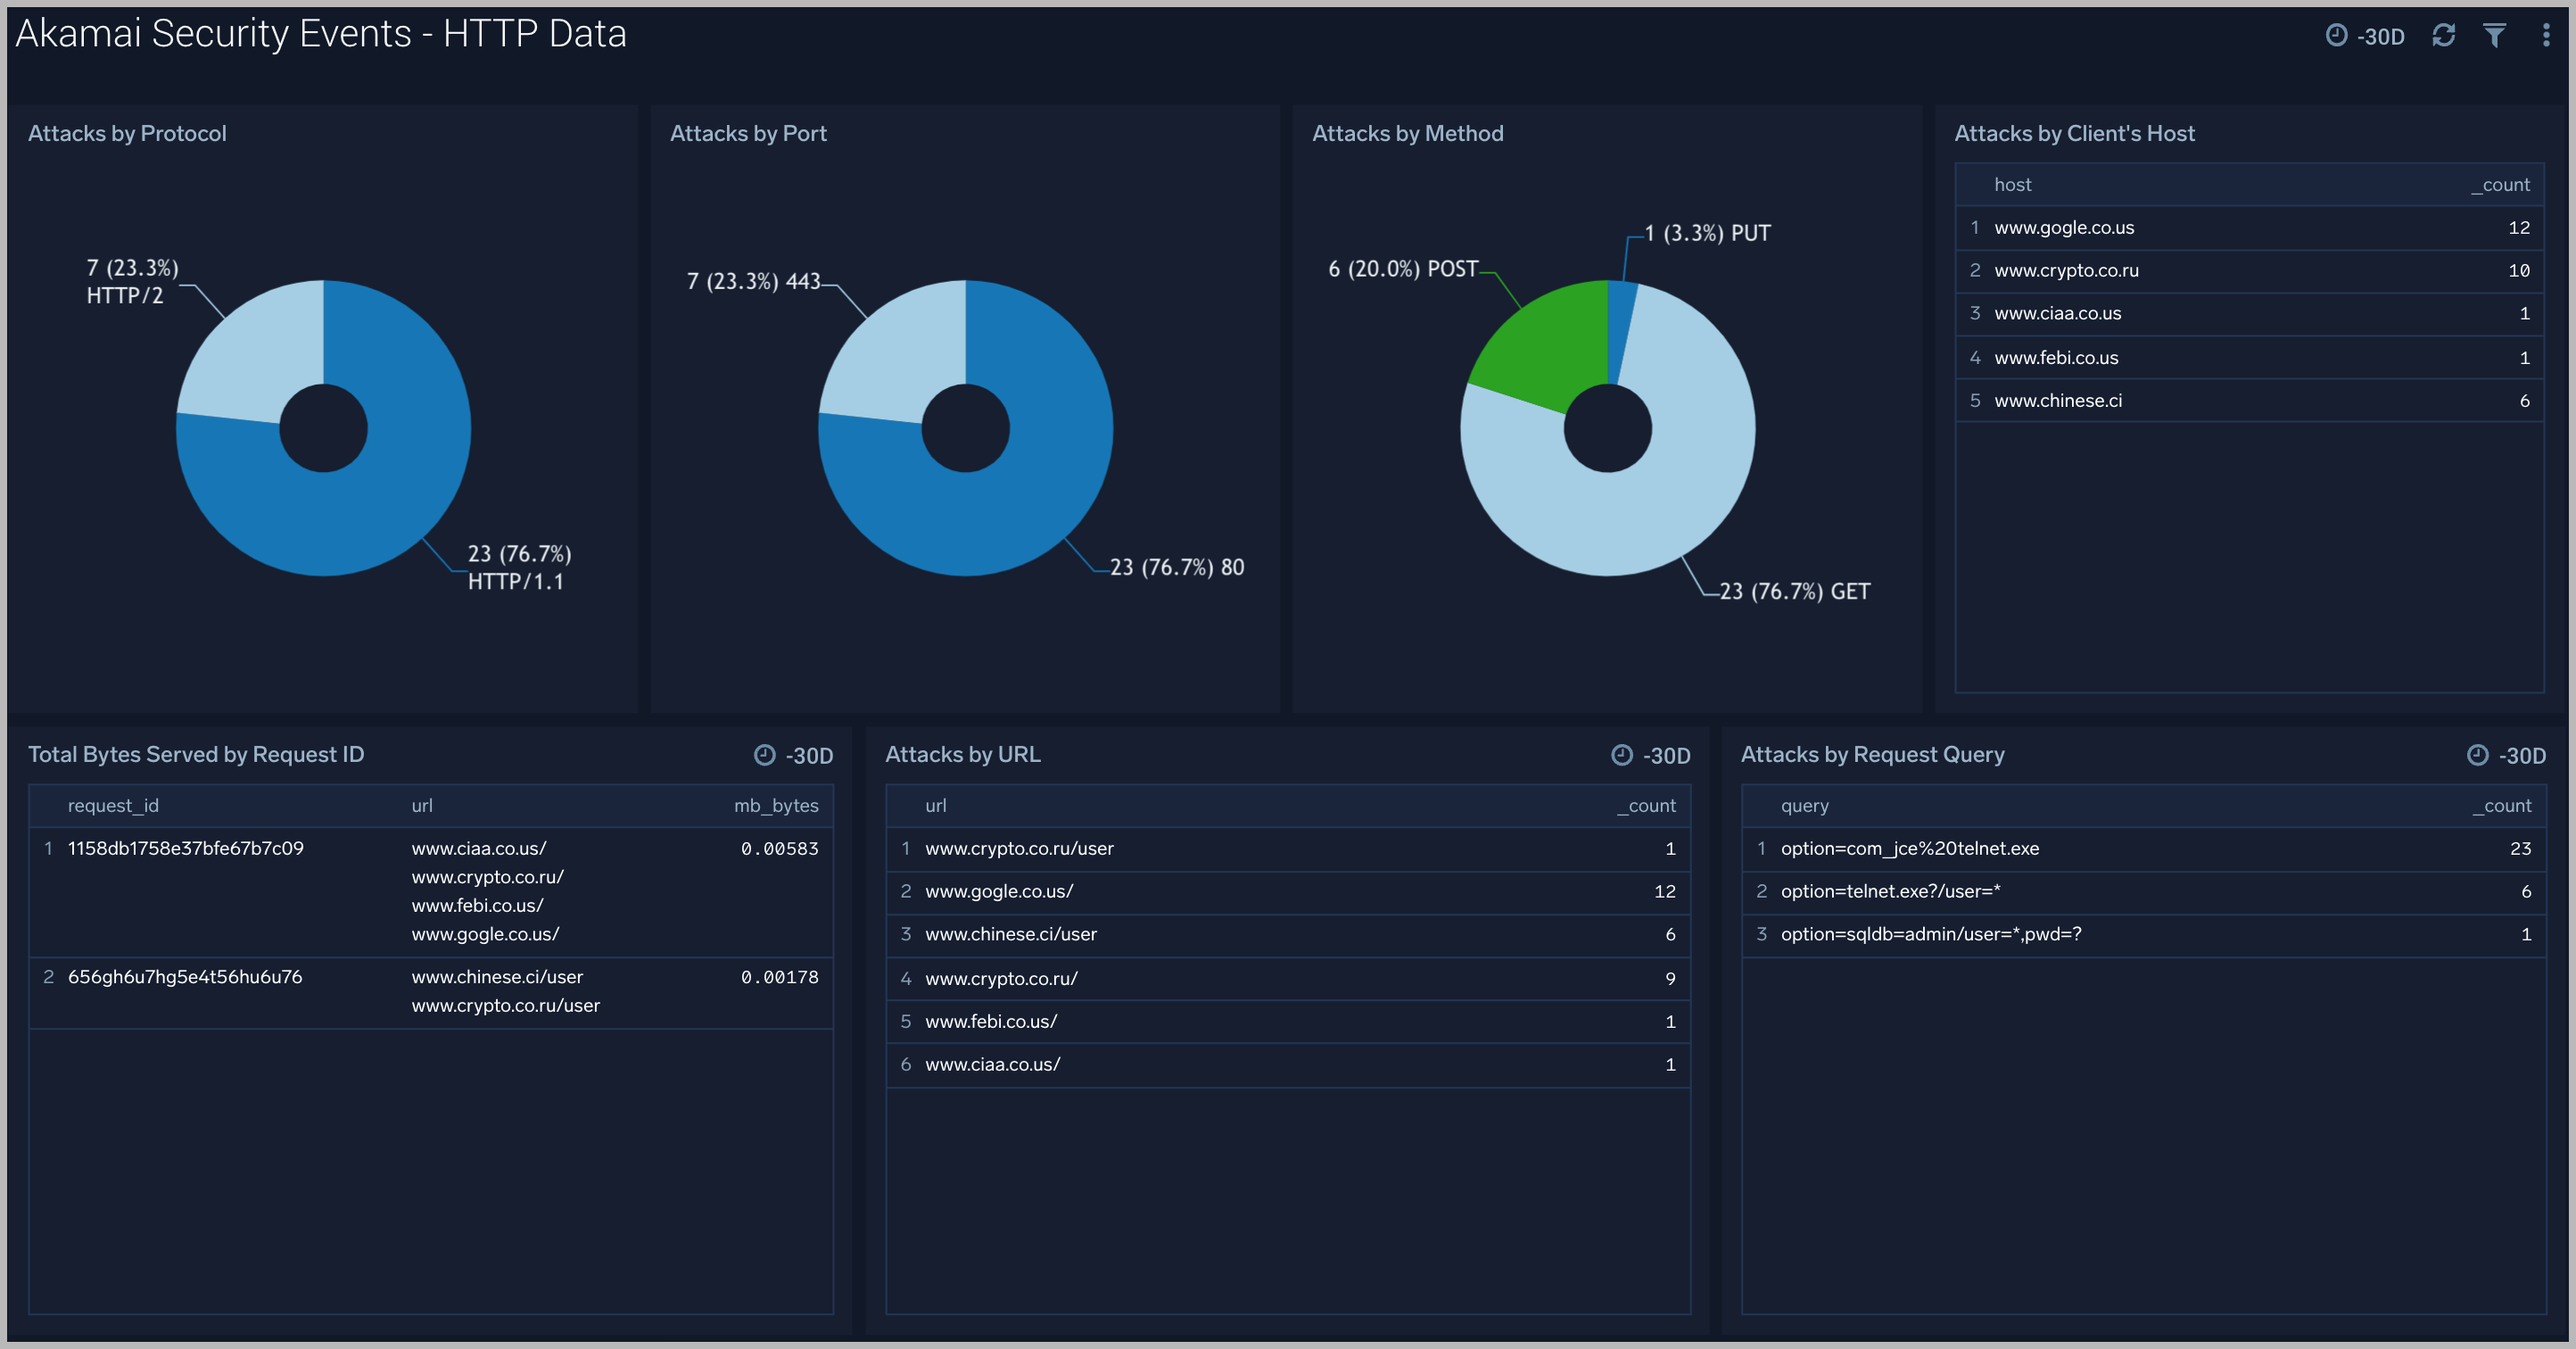
HTTP Data
The Akamai Security Events - HTTP Data dashboard provides context and visualization of attack’s HTTP request.
Use this dashboard to:
- Identify attacks by protocol, port and http method.
- Analyze bytes served during each attack request.
- Find request query which led to the attack.
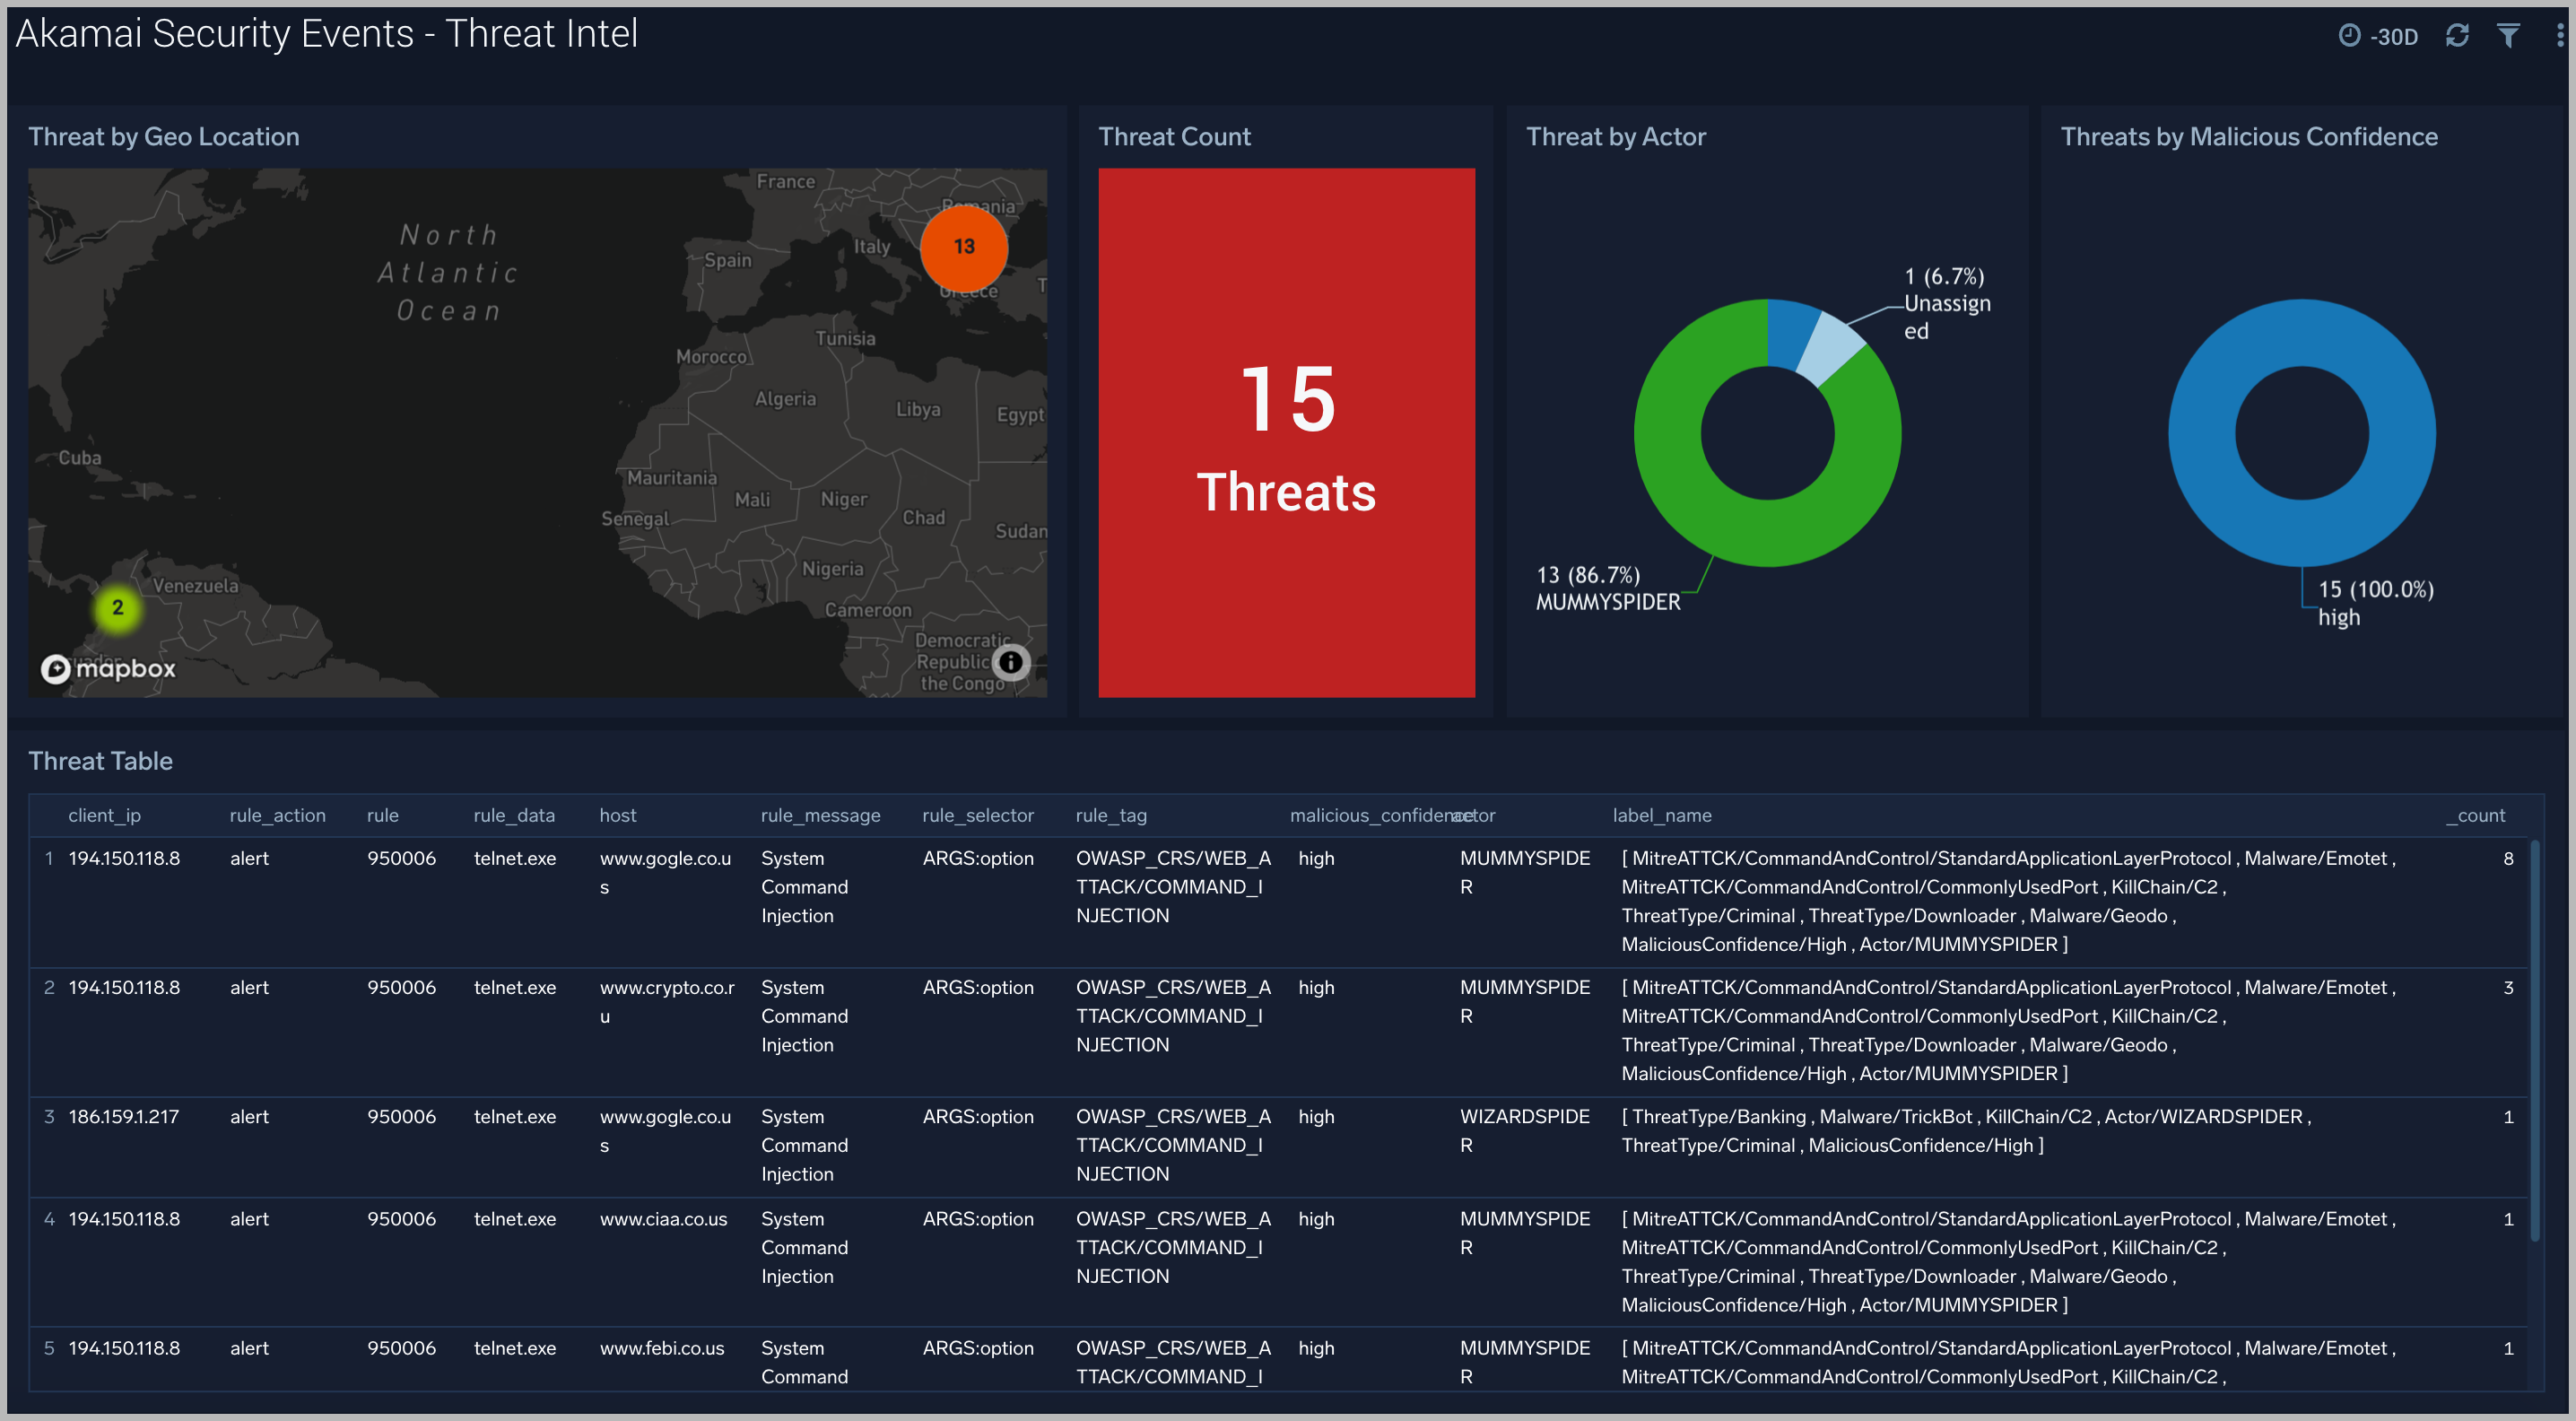
Threat Intel
The Akamai Security Events - Threat Intel dashboard provides an at-a-glance view of threats analyzed using Crowdstrike Threat Feed. Dashboard panels display threat count over a selected time period, geographic locations where threats occurred, source breakdown, actors responsible for threats, severity, and a correlation of IP addresses, method, and status code of threats.