Observable Networks

The Observable Networks App allows you to monitor your Observable Networks deployment from Sumo Logic. The App Overview Dashboard provides insight to high-level data about your network.
From Sumo Logic, you may also set up forwarding for log monitoring and authentication logs to Observable Networks. With log monitoring, Observable Networks can notify you when it detects that a Collector is missing, exposing gaps in your log coverage. Authentication log forwarding allows for more accurate and detailed alerts, using Sumo Logic log data to provide extra richness to Observable's Dynamic Endpoint Modeling algorithms.
Observable Networks is a provider of network security technology and advanced threat detection services that identify compromised and misused networked devices. Observable's Dynamic Endpoint Modeling technology includes a cloud-based service platform incorporating automated security analytics and real-time traffic sensors to continuously model all devices on a network. Endpoint modeling is based on network traffic flow metadata and is indifferent to encryption. Observable makes it easy to readily understand normal and abnormal device behaviors, helping to identify compromised devices and facilitate faster remediation.
For more information, please visit http://www.observable.net/.
Before you begin, your Observable Networks portal must be properly configured. Contact support@obsrvbl.com if you have any questions.
Log Types
The Sumo Logic App for Observable Networks assumes Observable Networks formatted logs, which provide one JSON message per request.
Collect Logs for the Observable Network App
This section provides instructions for configuring log collection for the Observable Network App, as well as relevant log and query samples.
The Observable Networks App allows you to monitor your Observable Networks deployment from Sumo Logic. From Sumo Logic, you can set up forwarding for log monitoring and authentication logs to Observable Networks. With log monitoring, Observable Networks can notify you when a collector is missing, exposing gaps in your log coverage. Authentication log forwarding allows for more accurate and detailed alerts, using Sumo Logic log data to provide extra richness to Observable's Dynamic Endpoint Modeling algorithms.
Observable Networks is a provider of network security technology and advanced threat detection services that identify compromised and misused networked devices. Observable's Dynamic Endpoint Modeling technology includes a cloud-based service platform incorporating automated security analytics and real-time traffic sensors to continuously model all devices on a network. Endpoint modeling is based on network traffic flow metadata and is indifferent to encryption. Observable makes it easy to readily understand normal and abnormal device behaviors, helping to identify compromised devices and facilitate faster remediation.
For more information, see http://www.observable.net/.
Prerequisites
From your Observable Networks portal, click Settings (gear icon) > Integrations > Sumo Logic > Settings and enter the Access ID, Access Key, and Source URL on the Sumo Logic Settings page. Before you begin, your Observable Networks portal must be properly configured. If you have any questions, contact support@obsrvbl.com.
Configure a Collector
Configure a Hosted Collector. Name the collector "observable" (case-sensitive).
Create an access key
- In Sumo Logic, go to Manage Data > Collection > Collection.
- Click Access Keys.
- Add a new access key called Observable Networks, then save the new Access ID and Access Key values.
Configure a Source
Configure an HTTP Source. Name the new source "observable" (case-sensitive). Deselect the check box Enable Timestamp Parsing.
When the URL associated with the Source is displayed, copy the URL so you can use it to send files.
Configure the Observable Portal
- From your Observable Networks portal, click Settings (gear icon) > Integrations > Sumo Logic > Settings.
- On the Sumo Logic Settings page, enter the Access ID, Access Key, and Source URL from the previous sections.
- Check Enabled, then click Save.
Your Observable Networks deployment will now publish alert and endpoint information to Sumo Logic.
Configure Log Monitoring (optional)
If you have Sumo Logic API access, you can integrate Observable Networks and Sumo Logic even further. You can configure Observable Networks to identify devices on your network that do not have Collectors installed. Additionally, Observable Networks can parse authentication log ("auth.log") data from certain Linux distributions (e.g., Ubuntu) to monitor user access.
Identify Missing Collectors
You can configure the Observable Networks portal to expect certain roles in the network to have corresponding log files. For example, you might expect a Terminal Server to capture an auth.log. When you configure this expectation, Observable will alert when a role is missing an expected log file, notifying you that there is a gap in your log coverage.
To configure an expectation in Observable Networks**
- From your Observable Networks portal, click Settings (gear icon) > Integrations > Sumo Logic > Logs.
- Enter the name for the expected log, such as Auth Log.
- Enter the Log Query Prefix, which is the search prefix given to Sumo Logic to filter for this log. For example,
_source=auth.log. - Select the roles that are expected to have this log. For example, Terminal Server.
Only roles present on your network are available. 5. Click Save.
You can also add a log without associating any roles. In this case, simply leave all roles deselected in Step 4.
Parse Authentication Logs
If you are collecting auth.log data in Sumo Logic from a compatible Linux distribution, you can configure Observable Networks to parse this data and monitor session activity.
Before you begin, make sure that you are collecting from an auth.log source, and make sure that it is configured on the Sumo Logic Logs page.
To parse authentication logs
- From your Observable Networks portal, click Settings (gear icon) > Integrations > Sumo Logic > Settings.
- From the Auth.log dropdown, select the log configuration that represents the auth.log source.
- Click Save.
Sample Log Messages
{
   "id": 350698,
   "source_info": {
      "ips": [
         "10.147.115.88",
         "10.41.174.78"
      ],
      "hostnames": [
         "i-0da95a1534cafcae8"
      ],
      "namespace": "awsv2:078653657564:us-east-1:vpc-c837e7ac",
      "name": "i-0da95a1534cafcae8",
      "created": "2017-01-21T14:43:53.267268+00:00"
   },
   "timestamp": "2017-02-05T08:00:00Z",
   "role": "AWS EC2 Instance",
   "source": 97385,
   "obsrvbl_type": "role"
}

{
   "id": 349848,
   "source_info": {
      "ips": [
         "10.138.70.165",
         "184.73.187.100"
      ],
      "hostnames": [
         "i-2979aa4d"
      ],
      "namespace": "awsv2:078653657564:us-east-1",
      "name": "yodlee-staging",
      "created": "2016-09-06T22:23:22.937360+00:00"
   },
   "timestamp": "2017-02-05T08:00:00Z",
   "role": "AWS EC2 Instance",
   "source": 236,
   "obsrvbl_type": "role"
}
Query Samples
_sourceCategory=observable | json field=_raw "obsrvbl_type", "effective_session_count" as type, session_count
| where type="session_count"
| timeslice 10m
| sum(session_count) group by _timeslice
| order by _timeslice
_sourceCategory=observable
| json field=_raw "obsrvbl_type", "source_info.name" as type, name
| where type = "observation"
| count by name
| order by _count desc
Install the Observable Networks App
This section provides instructions for installing the Observable Networks App, as well as showing examples of each of the dashboards. The App preconfigured searches and dashboards allow you to visually analyze your Observable Networks data at a glance.
To install the app:
Locate and install the app you need from the App Catalog. If you want to see a preview of the dashboards included with the app before installing, click Preview Dashboards.
- From the App Catalog, search for and select the app.
- Select the version of the service you're using and click Add to Library.
Version selection is applicable only to a few apps currently. For more information, see Installing the Apps from the Library.
- To install the app, complete the following fields.
- App Name. You can retain the existing name, or enter a name of your choice for the app.
- Data Source. Select either of these options for the data source.
- Choose Source Category, and select a source category from the list.
- Choose Enter a Custom Data Filter, and enter a custom source category beginning with an underscore. Example: (
_sourceCategory=MyCategory).
- Advanced. Select the Location in Library (the default is the Personal folder in the library), or click New Folder to add a new folder.
- Click Add to Library.
Once an app is installed, it will appear in your Personal folder, or other folder that you specified. From here, you can share it with your organization.
Panels will start to fill automatically. It's important to note that each panel slowly fills with data matching the time range query and received since the panel was created. Results won't immediately be available, but with a bit of time, you'll see full graphs and maps.
Viewing Observable Networks Dashboards
Overview
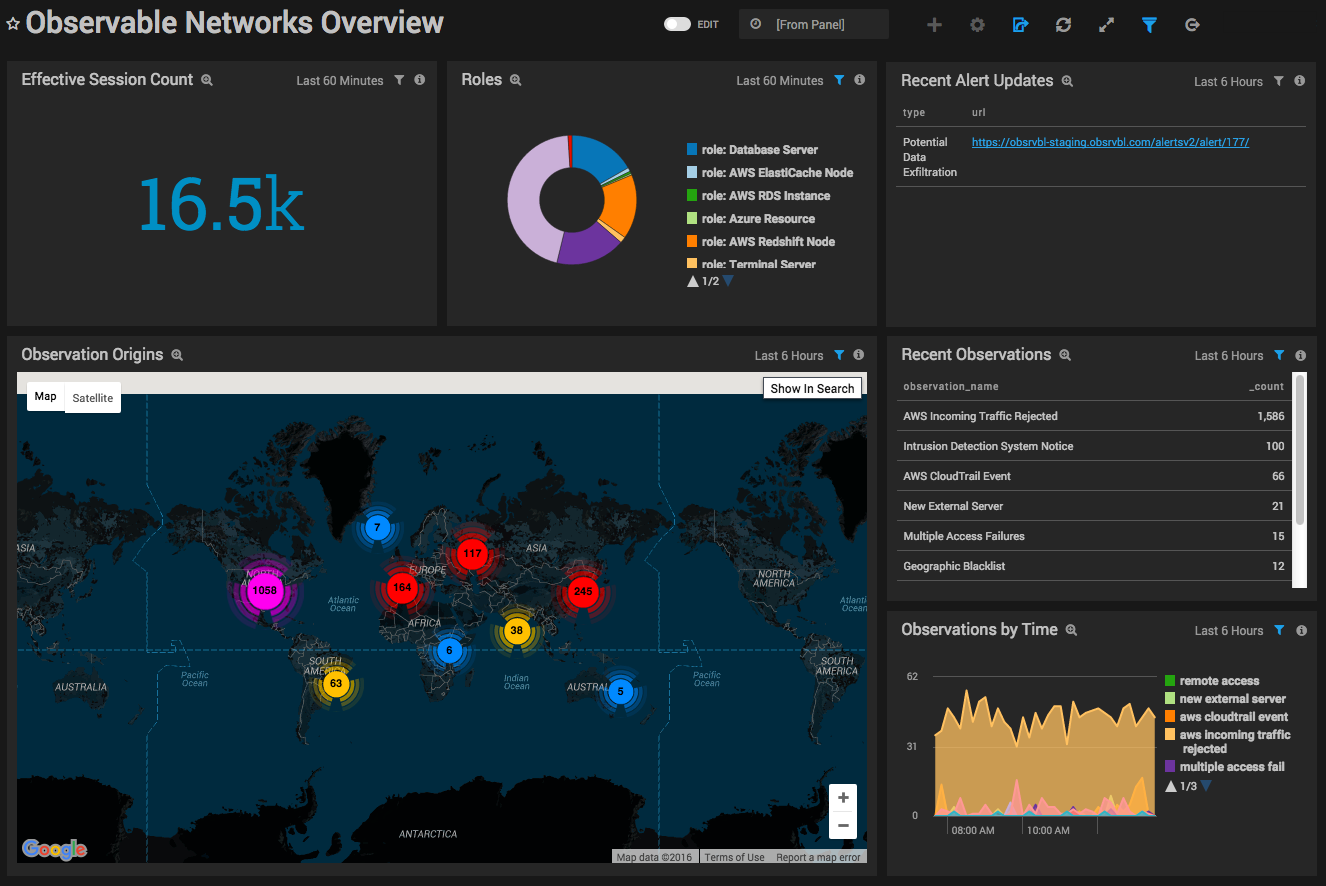
The Observable Networks Overview Dashboard is intended to provide a high level at-a-glance view into your network.
Effective Session Count. Displays the number of effective "flows" ("sessions") as a single value chart for the last hour.
Roles. Provides a breakdown of the types of endpoints currently on the network in a pie chart for the last hour. Endpoint types could be WebServer, iOS, Printer, etc. Roles are published every hour, so this Panels displays the latest role distribution on your network.
Recent Alert Updates. Shows a list of recently updated alerts in a table with a URL link to their alert detail page on the Observable Networks portal for the last six hours. Click the links for more details about an alert. If this Panel is empty, that means there have been no alerts for the last six hours.
Observation Origins. Displays observations that relate to activity with external endpoints (e.g., "New External Server") on a map of the world for the last six hours.
Recent Observations. Lists the latest observations on the system and their counts in a table for the last six hours. Observations are notable events about your network, which are the building blocks for alerts.
Observations by Time. Displays the frequency of each observation type as an area chart on a timeline for the last six hours.
Searches
Recent Flow Count. This query shows the history of flow counts for your network. A network flow describes a single piece of communication on your network, including source and destination IPs, ports, and protocol (TCP, UDP, etc.). Flows are the main input to the Observable Networks platform.
Role History. This multi-line graph shows the population of each role type on the network. Here you can track how the population of your network has changed over time. For example, the number of iOS devices and printers.
Top Observation Hosts. This is simple query shows the hosts (sources) with the most observation counts.