Twistlock

Twistlock is a cloud native cybersecurity platform for hosts, containers, and serverless setups that ensures the protection of all your workloads across any environment.
The Sumo Logic App for Twistlock provides a comprehensive monitoring and analysis solution for detecting vulnerabilities and potential threats within your Kubernetes and containerized environments.
Log Types
The Twistlock Apps work on logs from:
- Twistlock Console: Console logs typically include image scan, host scan, container scan, registry scan, scan summary, management audits, compliance violations, and vulnerability issues events.
- Twistlock Defender: Defender logs typically include container/host runtime audits, process activity audits, and incident events
For more information on Twistlock events, refer to the Twistlock Documentation.
For Kubernetes customers, we recommend installing the Twistlock App.
For non-Kubernetes customers, we recommend installing the Twistlock Classic App.
Collecting Logs for the Twistlock App
This section provides instructions for configuring log collection for the Sumo Logic App for Twistlock. After completing the following tasks, you will have successfully configured log collection for Twistlock:
- Configure a Sumo Logic syslog source
- Send Twistlock logs to Sumo Logic
Step 1. Configure a Sumo Logic syslog source
In this step you configure an installed collector with a Syslog source that will act as Syslog server to receive logs and events from Twistlock.
- Configure an Installed Collector for each Twistlock Console instance.
- Add a Syslog Source to the Installed Collector, and specify the following:
- Name. (Required) A name is required.
- Description. Optional.
- Protocol. UDP or TCP. Choose the protocol you configured in Twistlock Console for Syslog forwarding.
- Port. Port number. Choose the port you configured in Twistlock Console for Syslog forwarding.
- Source Category. (Required) Provide a Source Category for this data type. For example: prod/twistlock. For more information, see Best Practices.
- For Kubernetes customers, we recommend adding a custom field to the Syslog Source so you can reference it in the Sumo Explorer view. Each field contains a key-value pair, where the field name is the key. To add a field click the +Add Field link in the Fields section. You could add a field named cluster where you set the name of the cluster to tag to the logs. For example, cluster = k8s.dev.sumo.sumologic.net.
- Click Save.
Step 2: Send Twistlock logs to Sumo Logic
This step shows you how to configure Twistlock to send logs to the Sumo Logic syslog source.
- Login to the Twistlock console.
- Go to Manage > System > Logging.
- Enable Syslog.
- Enable both options under verbose syslog output.
- Edit Send syslog messages over the network to with the syslog endpoint that you configured on Sumo Syslog Source in Step 1 above.
- Format to specify the endpoint:** **
<protocol>://<server>:<port> - Example:
tcp://192.168.125.200:514
Sample Log Messages
<142>2019-07-24T14:37:50Z twistlock-console-v5t10 Twistlock-Console[1]: time="2019-07-24T14:37:50.767565936Z"
type="host_scan" log_type="vulnerability" vulnerability_id="46" description="Image contains vulnerable OS
packages" cve="ALAS-2019-1222" severity="critical" package="kernel" package_version="4.14.104-95.84.amz
-111.109.amzn2" rule="Default - alert all components" host="ip-192-168-20-21.us-west-1.compute.internal"

<142>2019-07-24T14:37:50Z twistlock-console-v5t10 Twistlock-Console[1]: time="2019-07-24T14:37:50.767806646Z"
type="scan_summary" log_type="host" hostname="ip-192-168-20-21.us-west-1.compute.internal" vulnerabilities="29"
compliance="19"
<142>2019-07-25T08:24:42Z ip-192-168-85-85.us-west-1.compute.internal Twistlock-Defender[18070]:
time="2019-07-25T08:24:42.947472447Z" type="process" pid="32593" path="/usr/bin/pgrep" interactive="false"
container_id="12345bd5416a975674fd507666b085e8724176453645b8b337529738dd012345"

<142>2019-07-24T14:38:13Z twistlock-console-v5t10 Twistlock-Console[1]: time="2019-07-24T14:38:13.772137479Z"
type="container_scan" log_type="container" container_id="123450cc8254018dde3fe860c017802b691495ae430797bd3c24d4b4e7b12345"
container_name="k8s_twistlock-defender-19-03-345_twistlock-defender-ds-9z824_twistlock_18fd4d74-77e8-11e9-b56a-06003de922ca_0"
image_name="registry-auth.twistlock.com/tw_blm0yiaqqwvgimnirx1x0iczg9xoslag/twistlock/defender:defender_19_03_345"
compliance="0"
Sample Query
The following query sample is from the Vulnerability Scan Events by Severity panel in the Twistlock - Overview dashboard.
_sourceCategory=*Twistlock* type log_type *scan* vulnerability severity
| parse regex "\s+(?<component>Twistlock-Console|Twistlock-Defender?)\s*.*\s*time=\"" nodrop
| parse "type=\"*\"" as type nodrop | parse "log_type=\"*\"" as log_type nodrop | parse "severity=\"*\""
as severity nodrop | parse "description=\"*\"" as description nodrop | parse "rule=\"*\"" as rule nodrop
| parse "host=\"*\"" as host nodrop | parse "image_id=\"*\"" as image_id nodrop | parse "image_name=\"*\""
as image_name nodrop | parse "container_id=\"*\"" as container_id nodrop | parse "container_name=\"*\""
as container_name nodrop | parse "cve=\"*\"" as cve nodrop | parse "vendor_status=\"*\"" as vendor_status nodrop | parse "vulnerability_id=\"*\"" as vulnerability_id nodrop
| where type matches "*scan*" and log_type="vulnerability"
| timeslice 1d
| count by _timeslice, severity
| transpose row _timeslice column severity
Installing the Twistlock App
This section provides instructions on how to install the Twistlock App, as well as examples of each of the dashboards. The App pre-configured searches and dashboards provide easy-to-access visual insights into your data.
To install the app, do the following:
Locate and install the app you need from the App Catalog. If you want to see a preview of the dashboards included with the app before installing, click Preview Dashboards.
- From the App Catalog, search for and select the app.
- Select the version of the service you're using and click Add to Library.
Version selection is applicable only to a few apps currently. For more information, see Installing the Apps from the Library.
- To install the app, complete the following fields.
- App Name. You can retain the existing name, or enter a name of your choice for the app.
- Data Source. Select either of these options for the data source.
- Choose Source Category, and select a source category from the list.
- Choose Enter a Custom Data Filter, and enter a custom source category beginning with an underscore. Example: (
_sourceCategory=MyCategory).
- Advanced. Select the Location in Library (the default is the Personal folder in the library), or click New Folder to add a new folder.
- Click Add to Library.
Once an app is installed, it will appear in your Personal folder, or other folder that you specified. From here, you can share it with your organization.
Panels will start to fill automatically. It's important to note that each panel slowly fills with data matching the time range query and received since the panel was created. Results won't immediately be available, but with a bit of time, you'll see full graphs and maps.
Viewing Twistlock Dashboards
Template variables provide dynamic dashboards that can rescope data on the fly. As you apply variables to troubleshoot through your dashboard, you view dynamic changes to the data for a quicker resolution to the root cause. You can use template variables to drill down and examine the data on a granular level. For more information, see Filter with template variables.
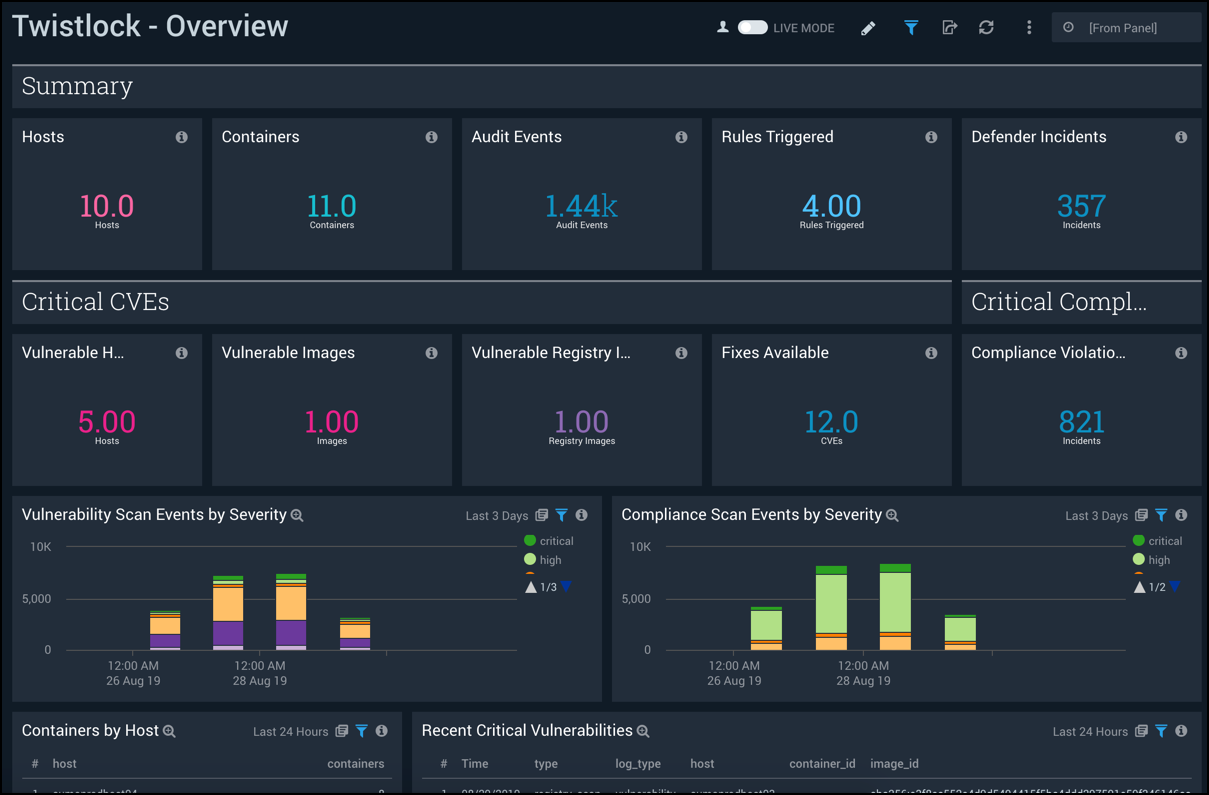
Overview
The Twistlock - Overview dashboard provides an at-a-glance overview of the state of your Kubernetes and container environments, including the number of hosts, containers, audit events, rules triggered, and defender incidents. The panels also display information on a variety of critical vulnerabilities by type, severity, and affected containers.

Use this dashboard to:
- Verify the number of host containers being monitored by Twistlock.
- Quickly understand and remediate vulnerabilities on hosts and images.
- Understand which CVEs have fixes available and use that information to triage and remediate vulnerabilities.
- Monitor trends for vulnerabilities and compliance issues detected.
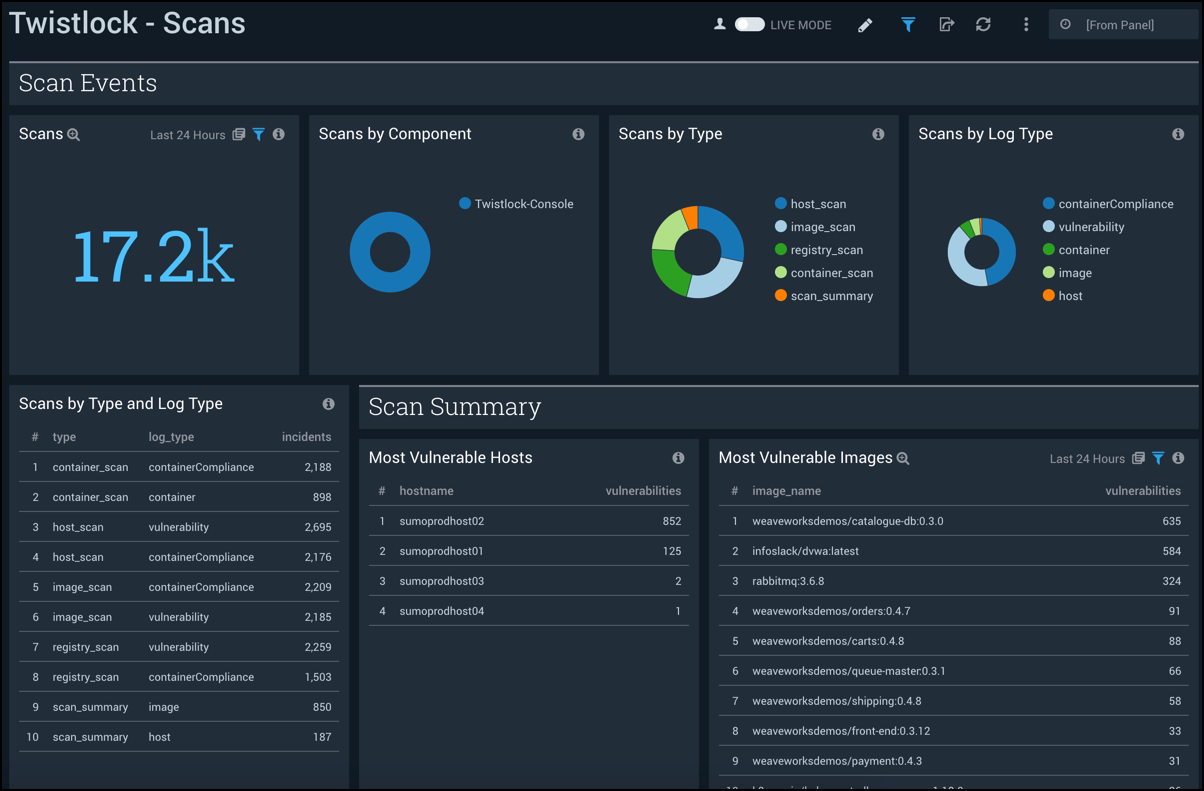
Scans
The Twistlock - Scans dashboard provides insights into scan events. Panels show scan summaries, vulnerability information and container compliance violations.
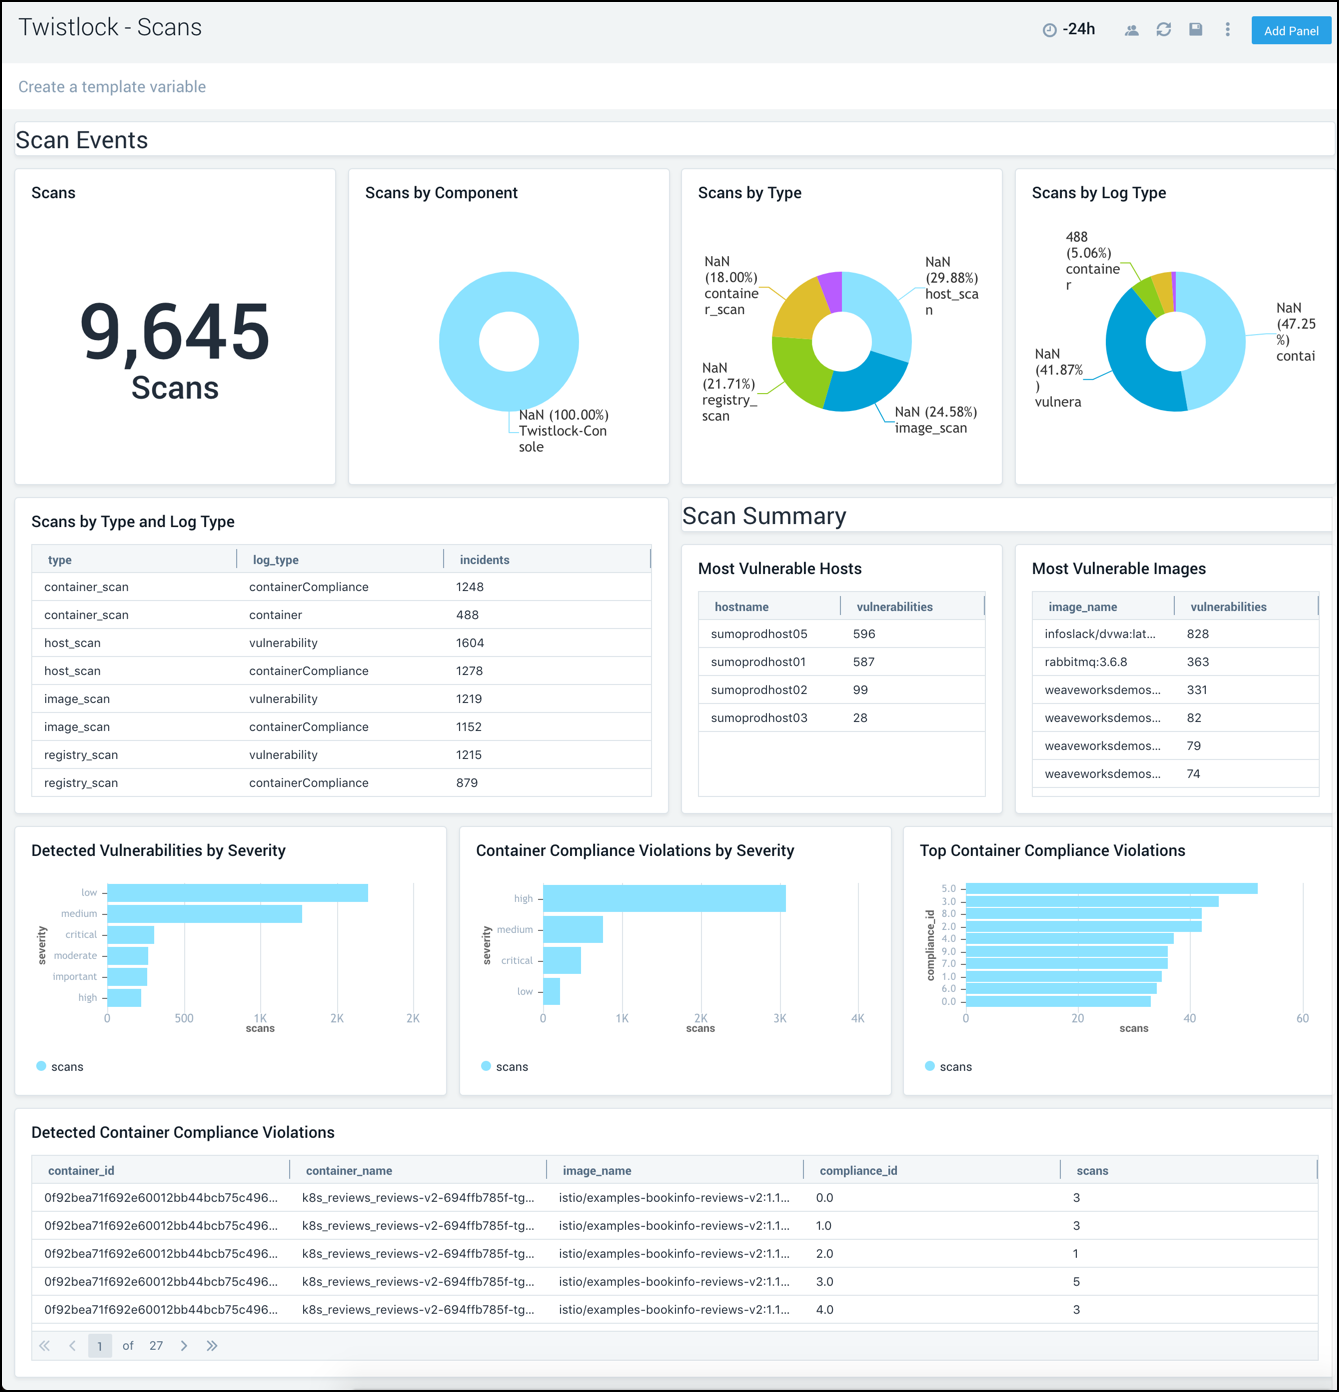
Use this dashboard to:
- Monitor scan events and their results.
- Identify and remediate the most vulnerable hosts, images, and compliance violations.
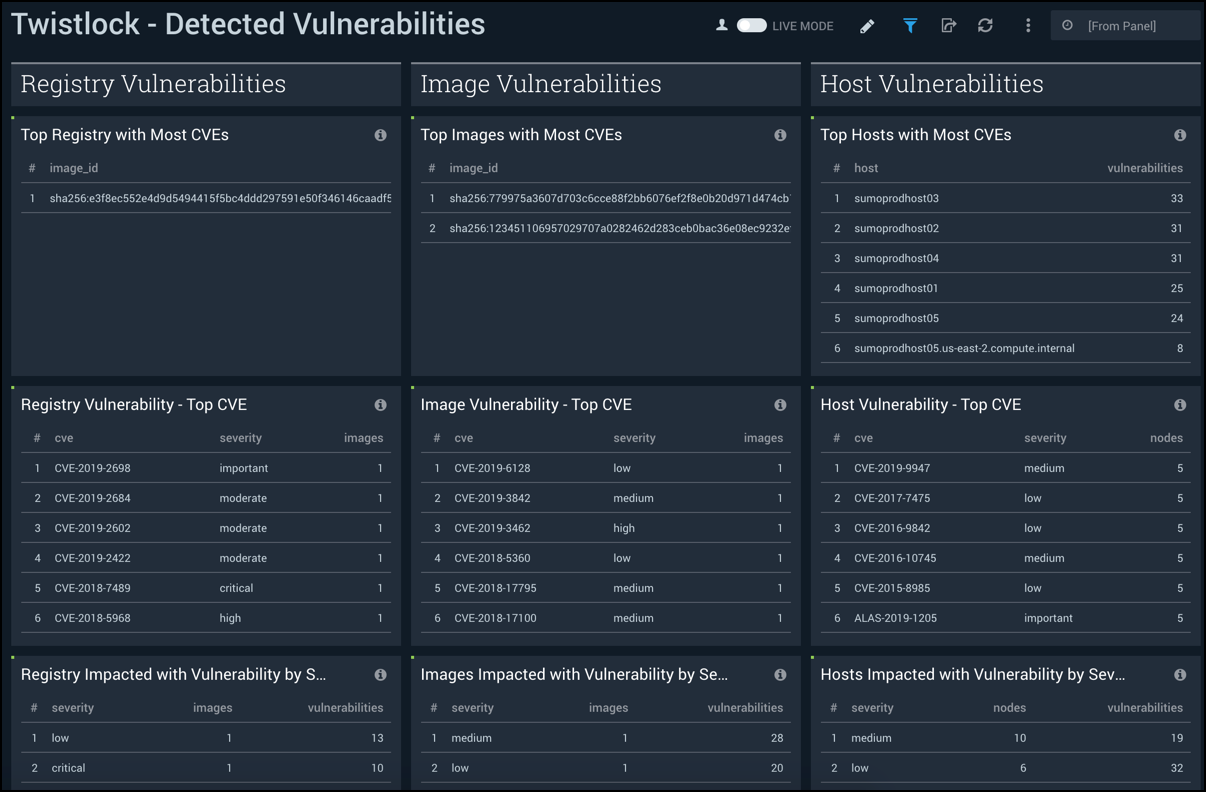
Detected Vulnerabilities
The Twistlock - Detected Vulnerabilities dashboard provides detailed information on detected vulnerabilities in the registry, image, and host.
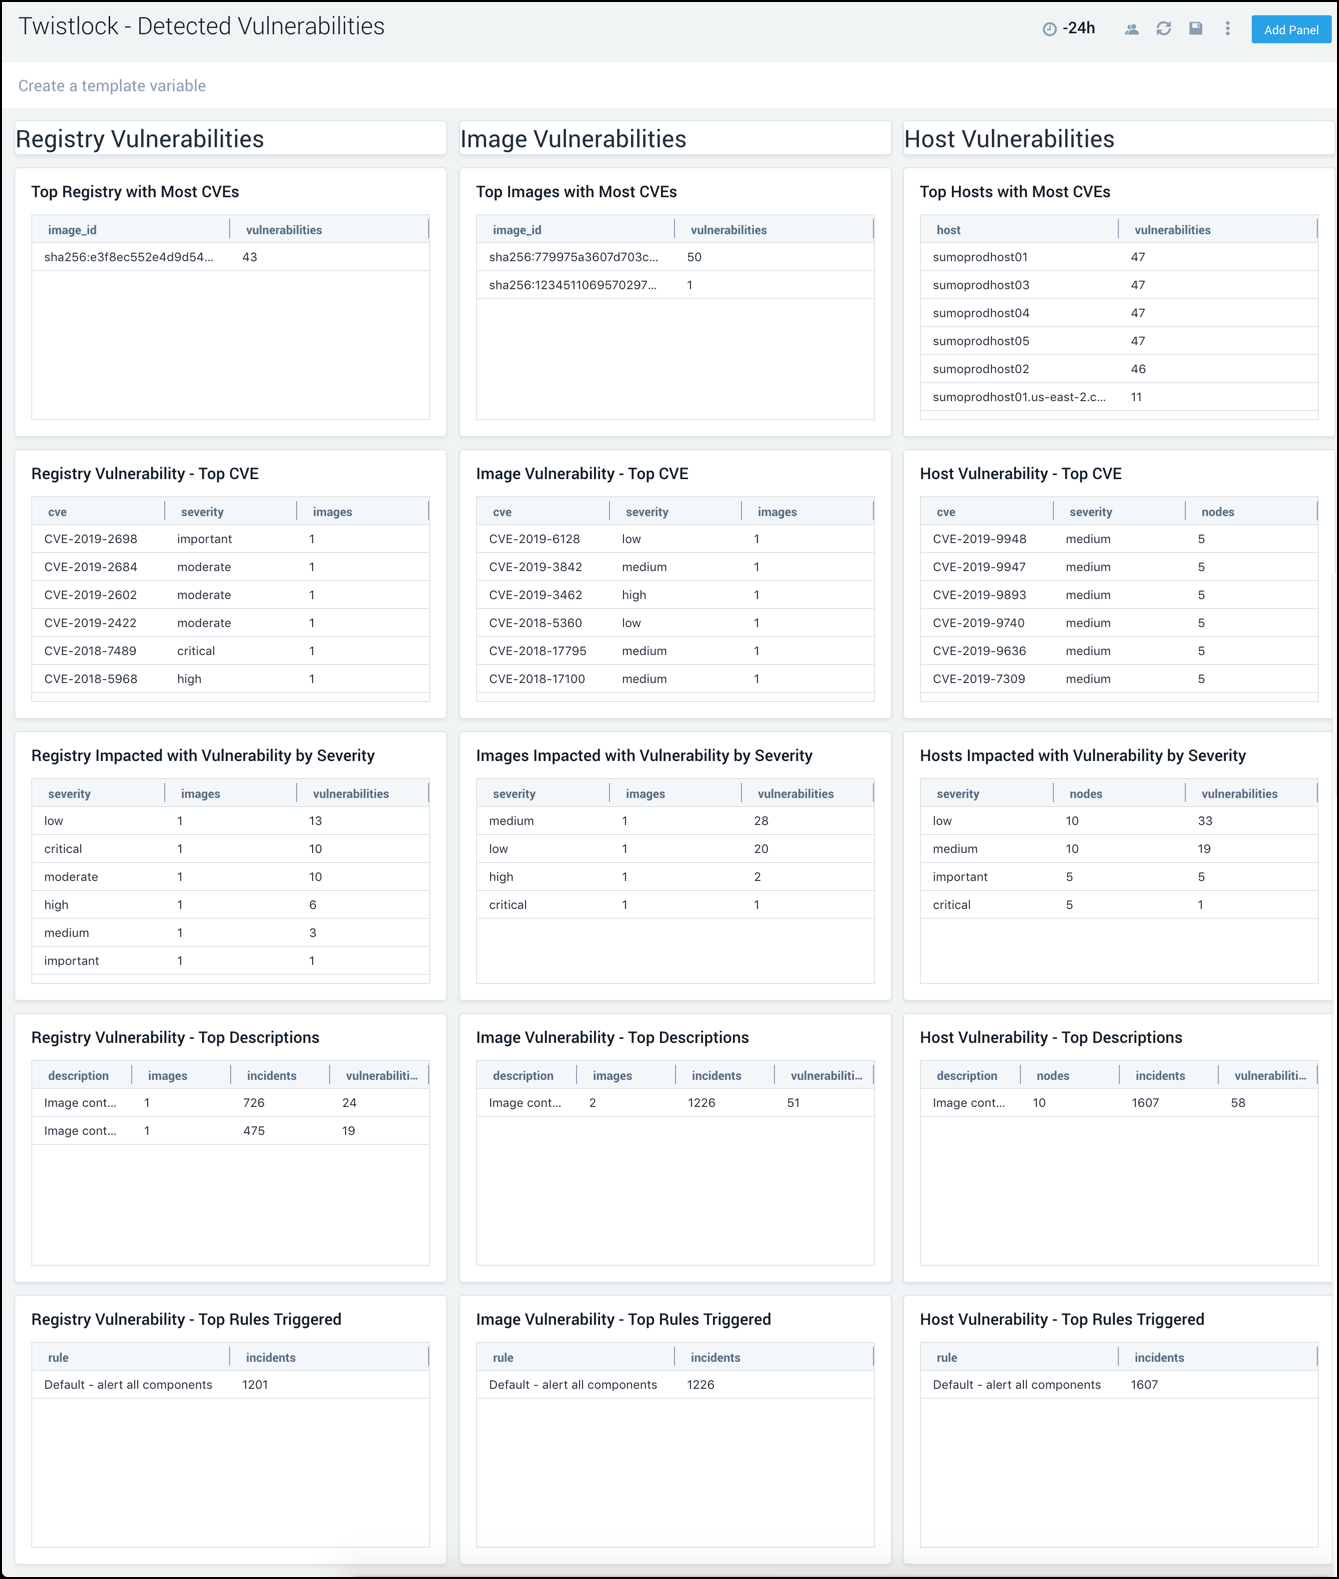
Use this dashboard to:
- Prioritize, identify and remediate vulnerabilities on the registry, images, and hosts.
- Identify top rules triggered by Twistlock to understand how to optimize or add new rules going forward.
- Use "Twistlock - CVE Status" dashboard to work on a specific host, image, and registry, based on Twistlock's recommendation.
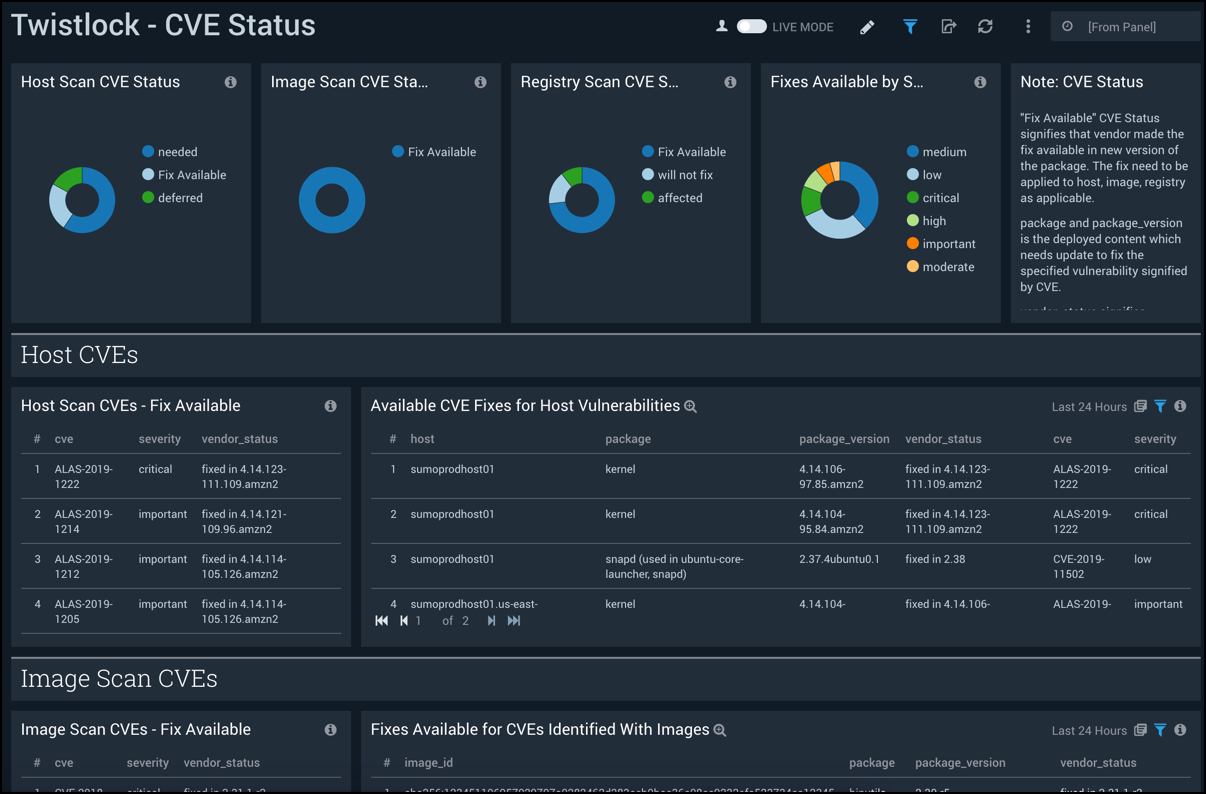
CVE Status
The Twistlock - CVE Status dashboard combines high-level views of common vulnerabilities and exposures (CVE) along with detailed information. Panels display at-a-glance views for host, image, and registry scans, and available fixes.
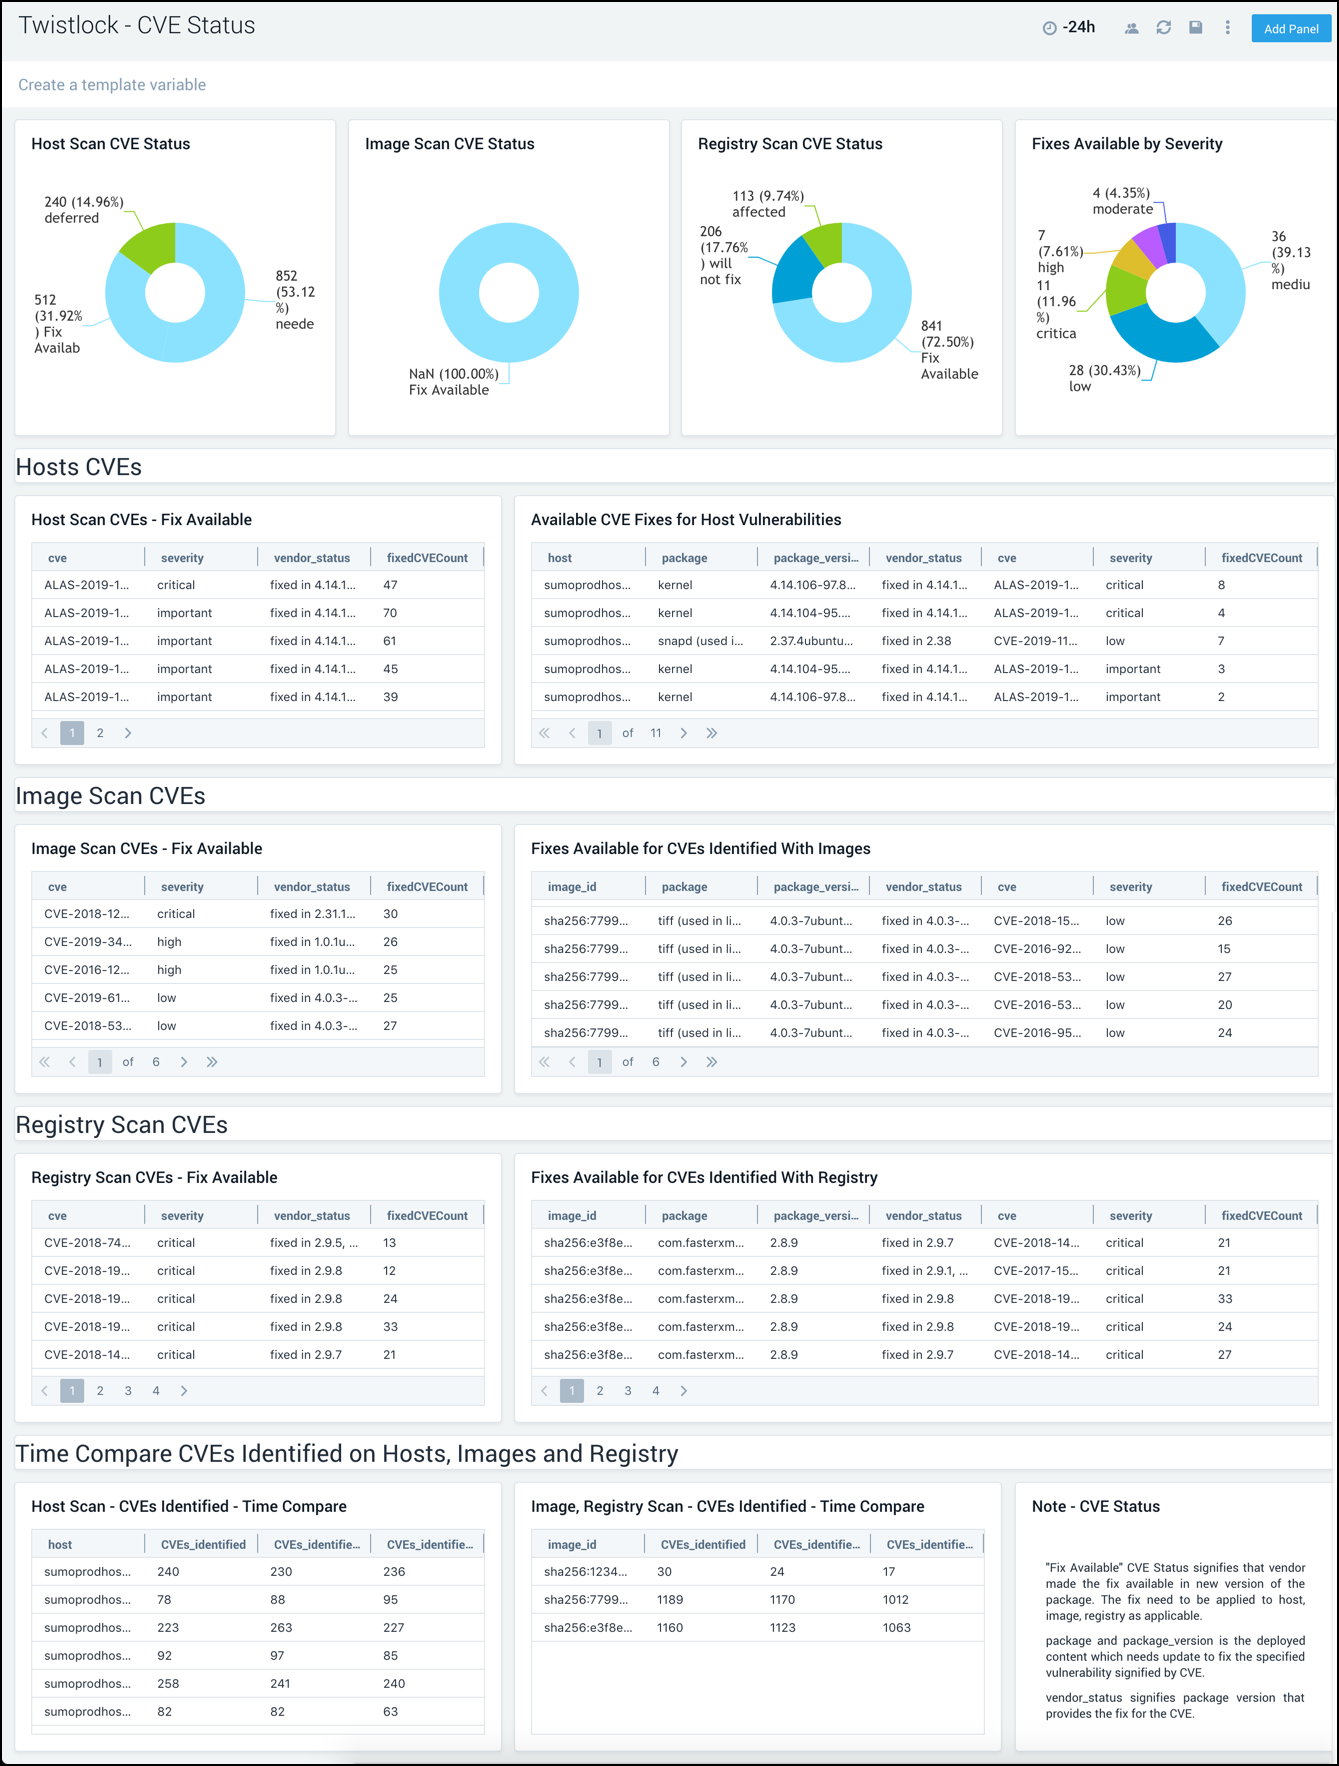
Use this dashboard to:
- Quickly identify, prioritize, and remediate CVE’s in your environment, for which documented fixes are available.
- Monitor trends of vulnerabilities detected within the last 2 days.
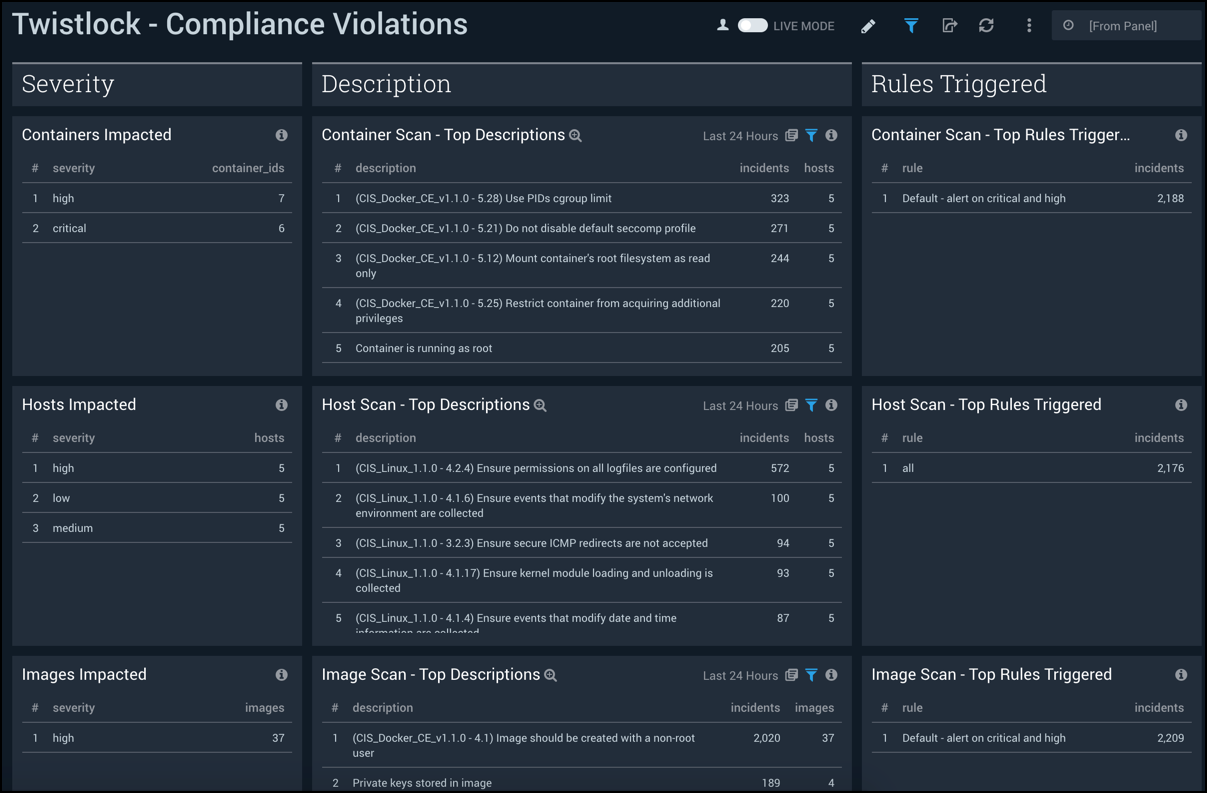
Compliance Violations
The Twistlock - Compliance Violations dashboard provides detailed information on system-wide compliance violations, organized according to the severity of violation, description of violation, and rules triggered by the violation.
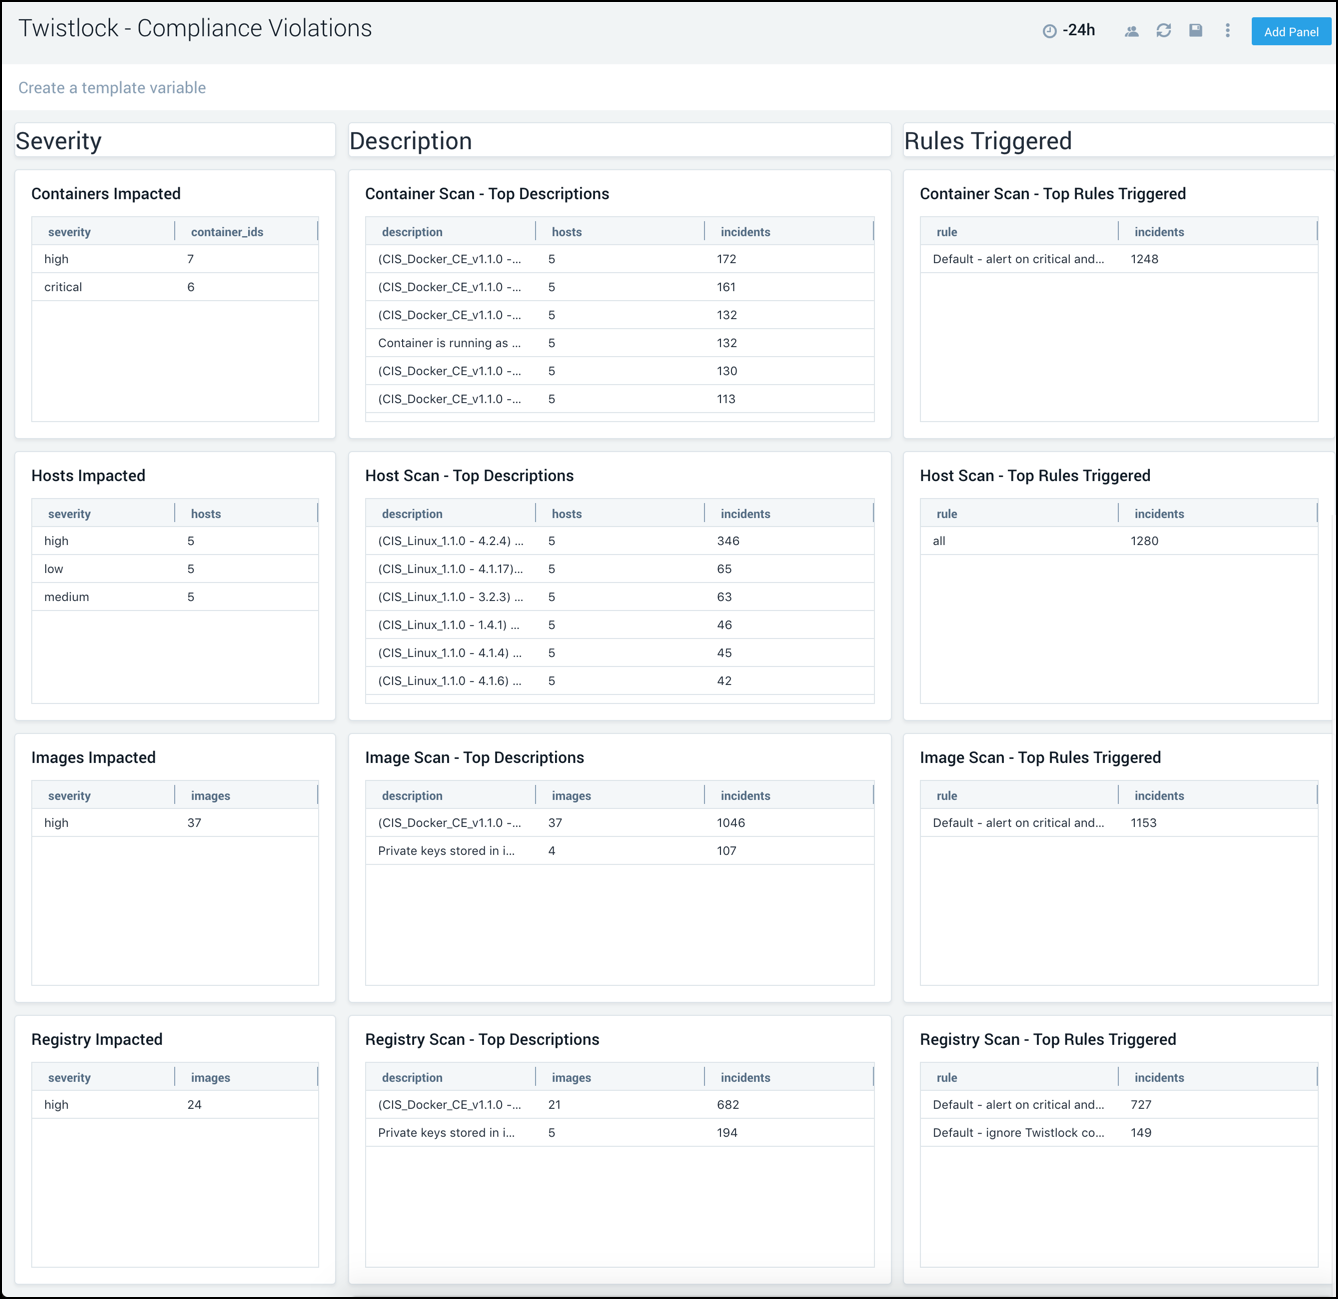
Use this dashboard to:
- Prioritize, identify, and remediate compliance violations.
- Identify Twistlock rules that trigger violations and optimize them as needed.
- Monitor compliance finding. These finding messages are generated as a byproduct of container scans, image scans, host scans, and registry scans.
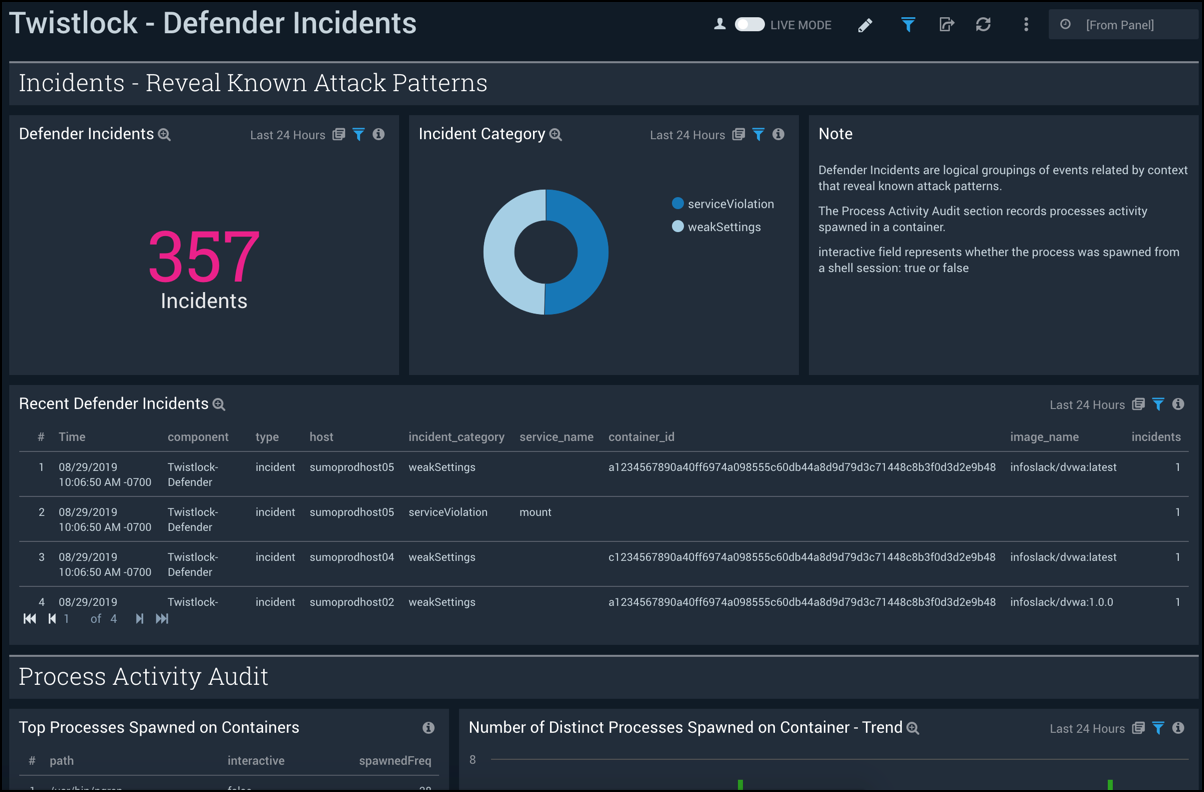
Defender Incidents
The Twistlock - Defender Incidents dashboard combines high-level and detailed information for defender incidents, which are logical groupings of events related by context that reveal known attack patterns, defender incidents, and process activity.
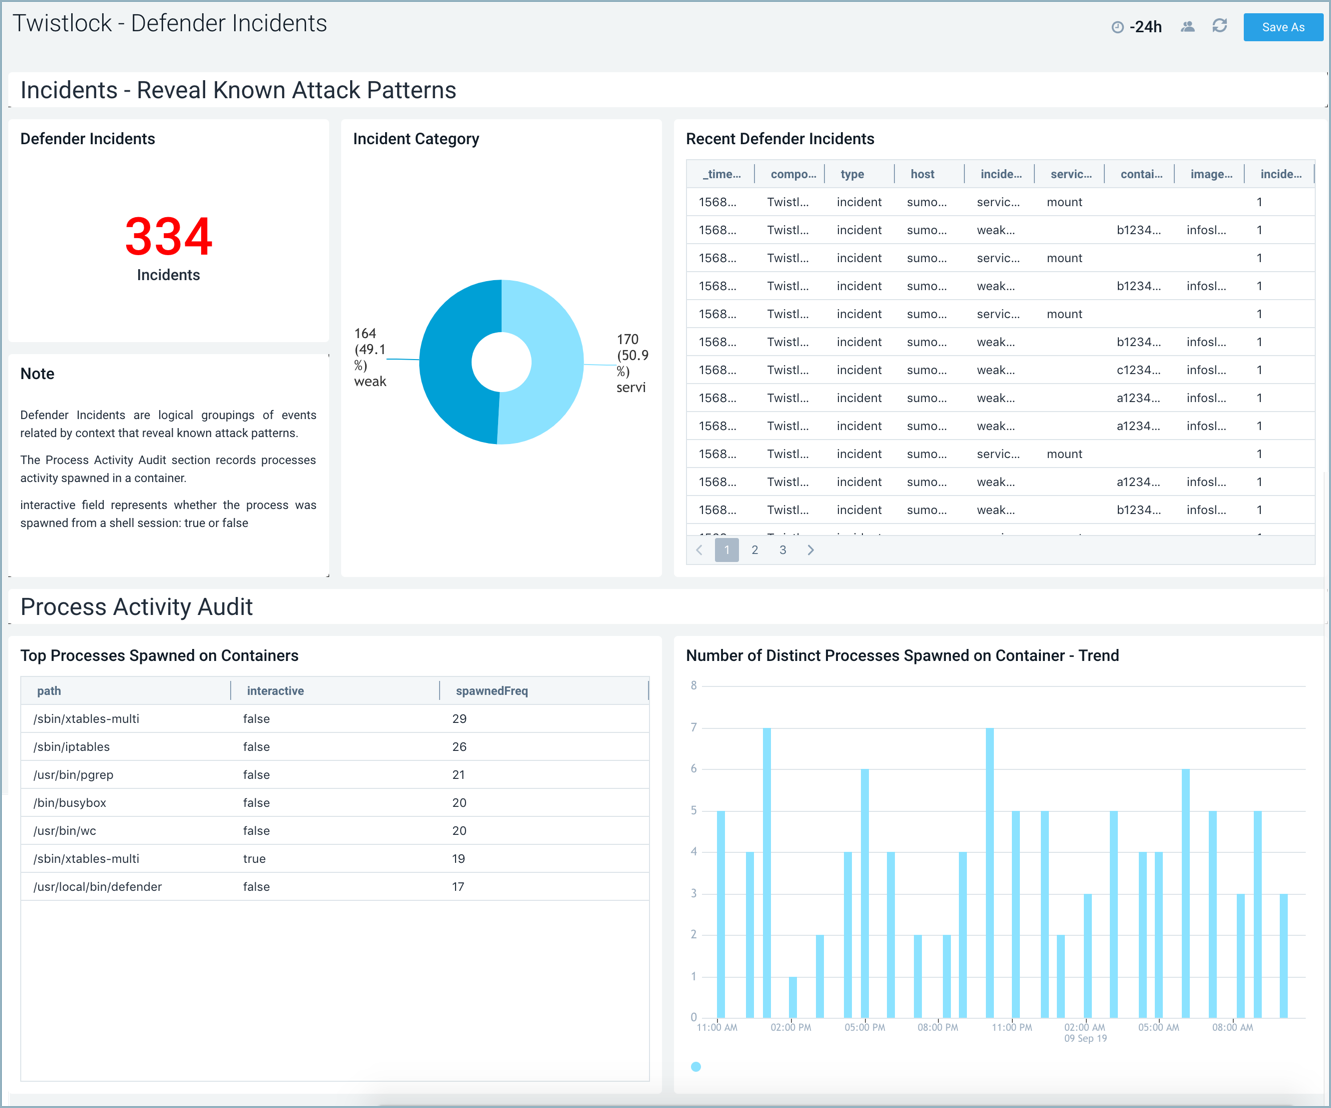
**Use this dashboard to monitor:
- Known attack patterns. Incidents are logical groupings of events, related by context, that reveal known attack patterns.
- Processes activity in a container. Look into whether the process was spawned from a shell session.
Runtime
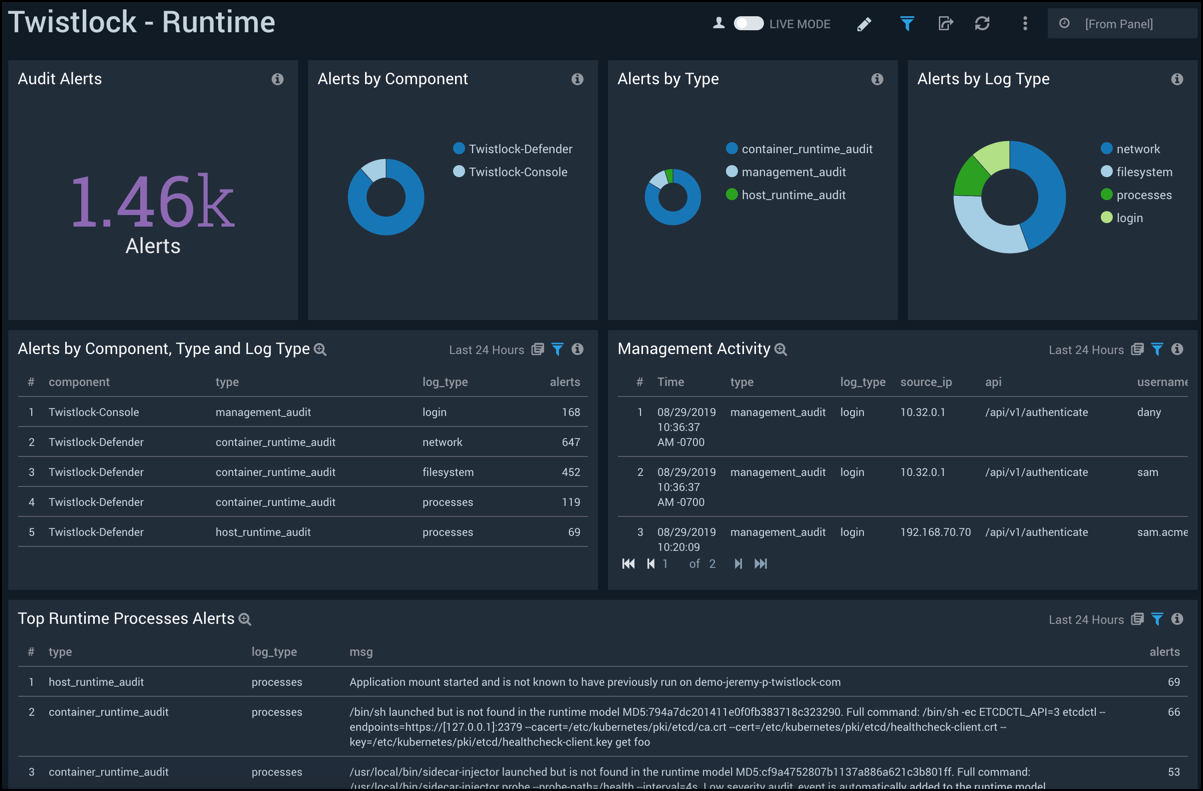
The Twistlock - Runtime dashboard provides detailed information on system and runtime threats, alerts and management activity.
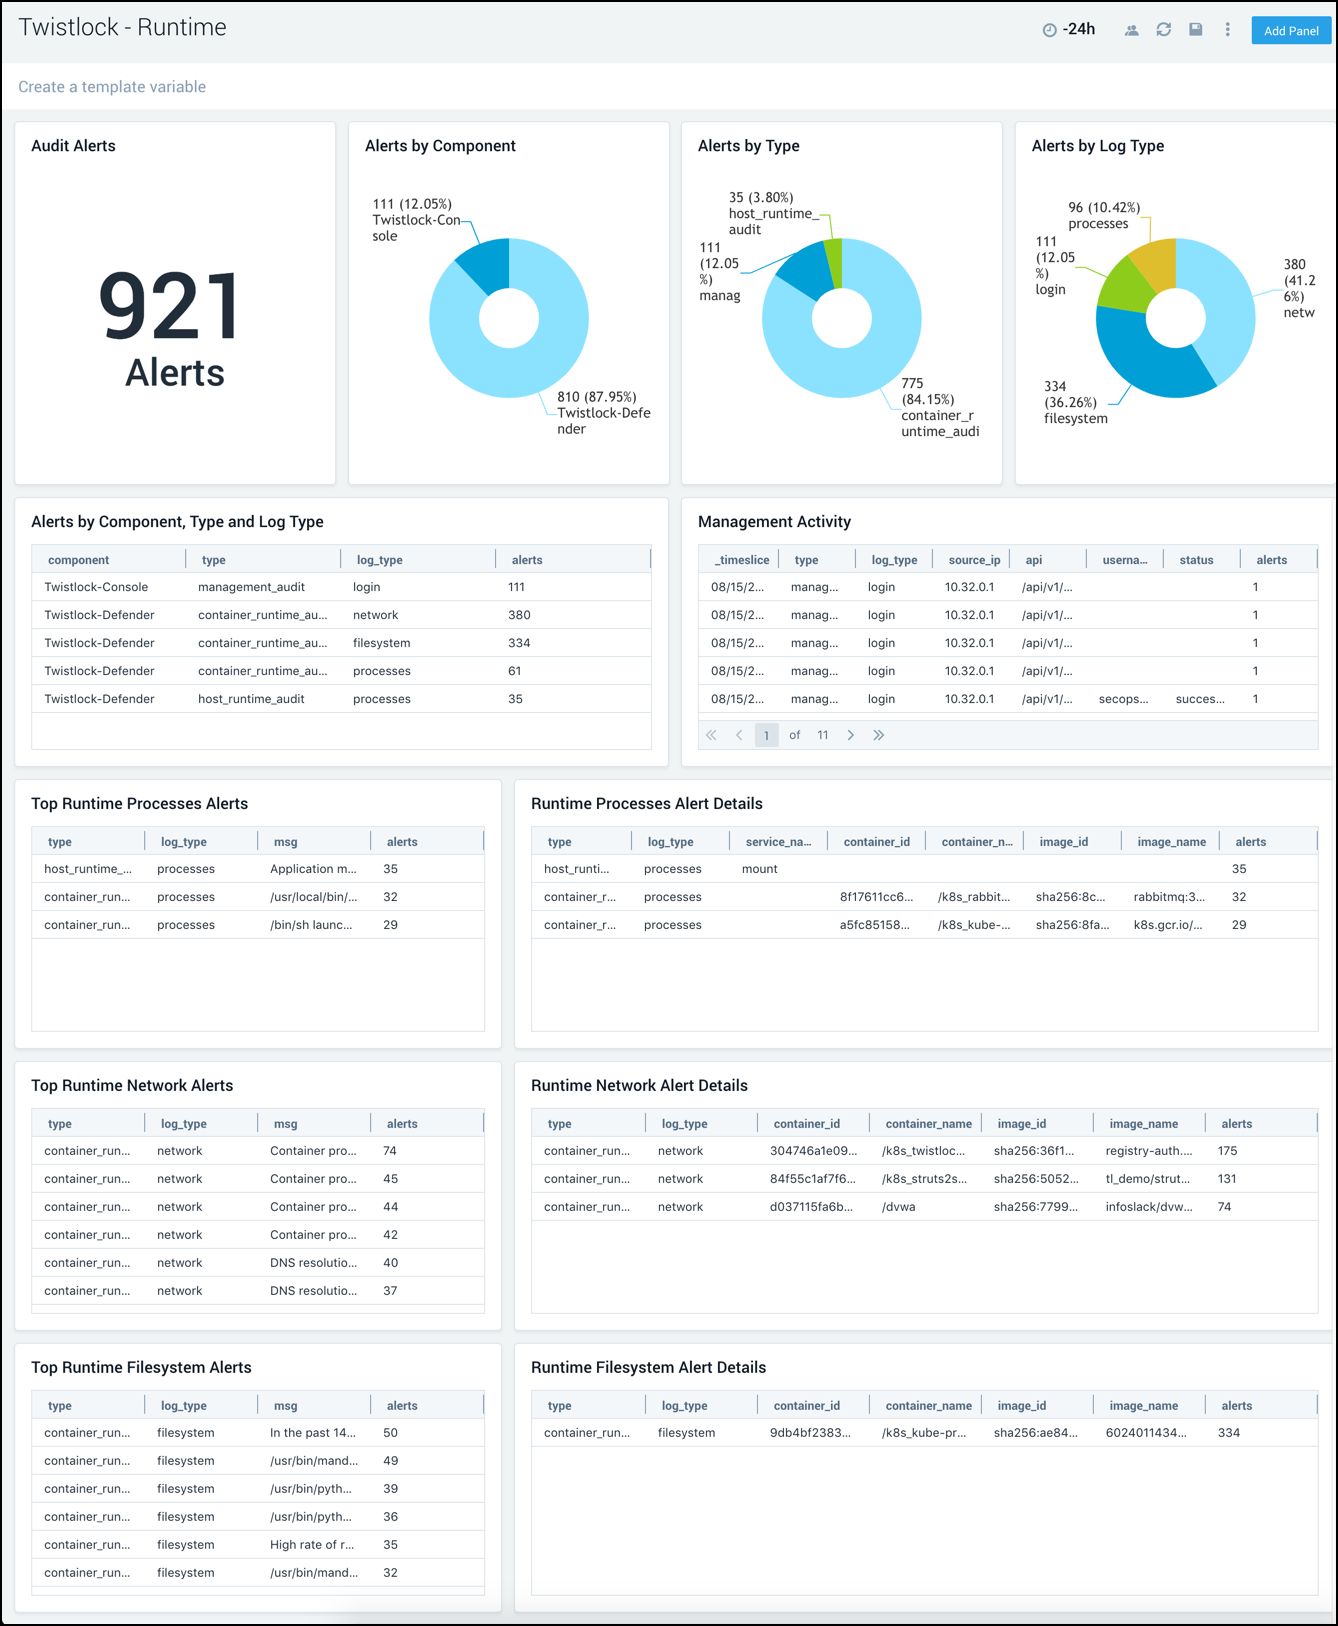
Use this dashboard to:
- Identify and remediate runtime threats in container environments across file systems, processes, system calls, or the network.
- Monitor audit events for console administrative activities and defender audit events.
Installing the Twistlock Classic App
This section provides instructions on how to install the Twistlock Classic App, as well as examples of each of the dashboards. The App pre-configured searches and dashboards provide easy-to-access visual insights into your data.
This section shows you how to install the Twistlock Classic App.
To install the app, do the following:
Locate and install the app you need from the App Catalog. If you want to see a preview of the dashboards included with the app before installing, click Preview Dashboards.
- From the App Catalog, search for and select the app.
- Select the version of the service you're using and click Add to Library.
Version selection is applicable only to a few apps currently. For more information, see Installing the Apps from the Library.
- To install the app, complete the following fields.
- App Name. You can retain the existing name, or enter a name of your choice for the app.
- Data Source. Select either of these options for the data source.
- Choose Source Category, and select a source category from the list.
- Choose Enter a Custom Data Filter, and enter a custom source category beginning with an underscore. Example: (
_sourceCategory=MyCategory).
- Advanced. Select the Location in Library (the default is the Personal folder in the library), or click New Folder to add a new folder.
- Click Add to Library.
Once an app is installed, it will appear in your Personal folder, or other folder that you specified. From here, you can share it with your organization.
Panels will start to fill automatically. It's important to note that each panel slowly fills with data matching the time range query and received since the panel was created. Results won't immediately be available, but with a bit of time, you'll see full graphs and maps.
Viewing Twistlock Classic Dashboards
Filter with template variables
Template variables provide dynamic dashboards that rescope data on the fly. As you apply variables to troubleshoot through your dashboard, you can view dynamic changes to the data for a fast resolution to the root cause. For more information, see the Filter with template variables help page.
You can use template variables to drill down and examine the data on a granular level.
Overview
The Twistlock - Overview dashboard provides an at-a-glance overview of the state of your Kubernetes and container environments, including the number of hosts, containers, audit events, rules triggered, and defender incidents. The panels also display information on a variety of critical vulnerabilities by type, severity, and affected containers.
Use this dashboard to:
- Verify the number of host containers being monitored by Twistlock.
- Quickly understand and remediate vulnerabilities on hosts and images.
- Understand which CVEs have fixes available and use that information to triage and remediate vulnerabilities.
- Monitor trends for vulnerabilities and compliance issues detected.
32
Scans
33
The Twistlock - Scans dashboard provides insights into scan events. Panels show scan summaries, vulnerability information and container compliance violations.
Use this dashboard to:
- Monitor scan events and their results.
- Identify and remediate the most vulnerable hosts, images, and compliance violations.
34
Detected Vulnerabilities
35
The Twistlock - Detected Vulnerabilities dashboard provides detailed information on detected vulnerabilities in the registry, image, and host.
Use this dashboard to:
- Prioritize, identify and remediate vulnerabilities on the registry, images, and hosts.
- Identify top rules triggered by Twistlock to understand how to optimize or add new rules going forward.
- Use "Twistlock - CVE Status" dashboard to work on a specific host, image, and registry, based on Twistlock's recommendation.
CVE Status
The Twistlock - CVE Status dashboard combines high-level views of common vulnerabilities and exposures (CVE) along with detailed information. Panels display at-a-glance views for host, image, and registry scans, and available fixes.
Use this dashboard to:
- Quickly identify, prioritize, and remediate CVE’s in your environment, for which documented fixes are available.
- Monitor trends of vulnerabilities detected within the last 2 days.
38
Compliance Violations
39
The Twistlock - Compliance Violations dashboard provides detailed information on system-wide compliance violations, organized according to the severity of violation, description of violation, and rules triggered by the violation.
Use this dashboard to:
- Prioritize, identify, and remediate compliance violations.
- Identify Twistlock rules that trigger violations and optimize them as needed.
- Monitor compliance finding. These finding messages are generated as a byproduct of container scans, image scans, host scans, and registry scans.
40
Defender Incidents
41
The Twistlock - Defender Incidents dashboard combines high-level and detailed information for defender incidents, which are logical groupings of events related by context that reveal known attack patterns, defender incidents, and process activity.
**Use this dashboard to monitor:
- Known attack patterns. Incidents are logical groupings of events, related by context, that reveal known attack patterns.
- Processes activity in a container. Look into whether the process was spawned from a shell session.
Runtime
The Twistlock - Runtime dashboard provides detailed information on system and runtime threats, alerts and management activity.
Use this dashboard to:
- Identify and remediate runtime threats in container environments across file systems, processes, system calls, or the network.
- Monitor audit events for console administrative activities and defender audit events.
44