
We're excited to announce automatic log level detection for Log Search queries, helping you to quickly identify anomalies without having to search through large volume of logs to find high severity issues.

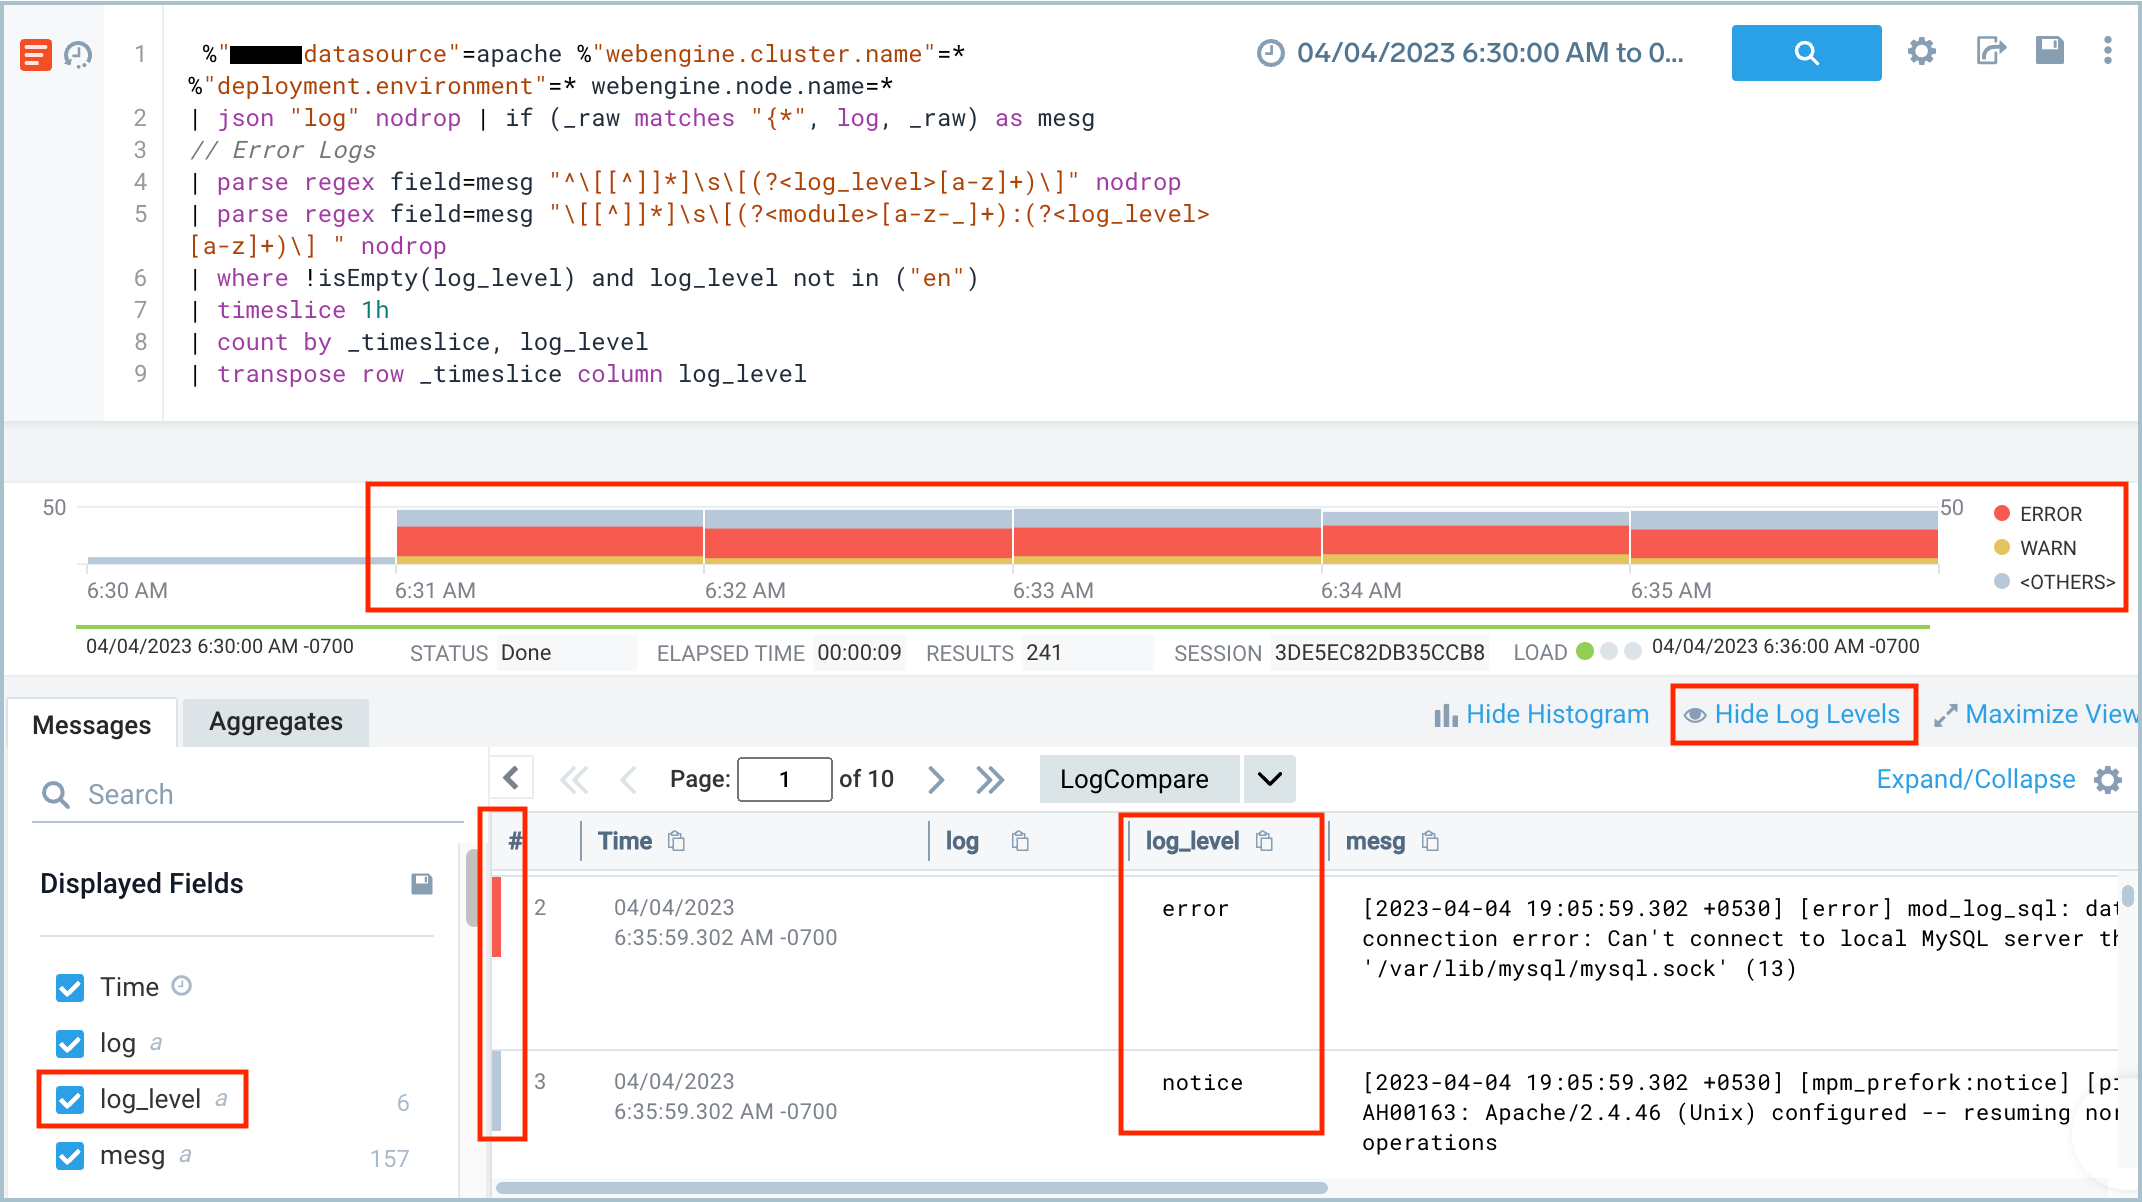
With this update, you can visualize and filter log-level distribution in the Histogram results and Messages table messages of specific log level(s) in the same view. Learn more.

NOTE: This feature is in Beta. To participate, contact your Sumo Logic account executive or our Support Team.

Hide log levels

Our new Scheduled Report feature enables you to receive an email copy of a dashboard periodically in either PDF or PNG format, allowing you to get insight into the dashboard without logging into the Sumo Logic platform.

We’re happy to announce a release that saves you configuration time. Our new and improved OpenTelemetry collector data onboarding workflow that gets you up and running with infrastructure monitoring in minutes. With this update, you can start monitoring host and process data, web servers (like IIS, Nginx), databases (like MySQL, Redis, Cassandra), and other sources out of the box - no manual configuration required. Learn more.

The Sumo Logic Distribution for OpenTelemetry, a single unified agent to send Logs, Metrics, Traces, and Metadata, helps simplify and streamline Observability and debugging to improve overall system reliability and efficiency. Learn more.

Note: The new onboarding workflows are only available for new Trial customers at this time.

OpenTelemetry collector onboarding flow

Beta - To prepare for Dashboards (Classic) deprecation in late 2023, we've released a tool to assist you with migrating from Dashboards (Classic) to Dashboards (New). You can access this tool directly from a Classic dashboard page by clicking on the Migrate to new dashboards link at the top of the page.

For more information, including the current limitations of the tool, see Migrate Dashboards. Start planning and migrating your Classic dashboards now. You can learn more from our Community page.

We've made enhancements to the query editor that will make it easier for you to work with long queries and larger results. With this update, you can now adjust the size of the search query editor, allowing for better visibility into long queries. This will be especially helpful for those of you who have found it difficult to review long queries in their entirety due to the fixed editor size. Additionally, you can reduce the size of the editor while examining larger results, making it easier to navigate through your data.

We've released SLO Lookup Tables, which allow you to view all SLO metadata in your environment. Data is managed and refreshed automatically on our end. To use, you can enlist the contents of the lookup table, which reside under a fixed path (sumo://content/slos) or join the results of your SLO precomputed data (from _view = sumologic_slo_output) with metadata contained in the lookup table. Learn more.

You can now launch a Log Search session directly from an SLO dashboard panel, giving you the ability to drill down further into your SLO data. You can also add Log Search results to any other Sumo Logic dashboard, allowing you to correlate SLO performance data with other categories of data. Learn more.

SLO Open Log Search

We have added support for multiple metrics queries for the threshold-based definition for the Query field in the SLI definition. You can use it to generate derived time series using arithmetic operations with the help of joins.

Multiple metrics queries can be defined from scratch on the SLO editor and the metrics page and imported to the SLO editor via the Create an SLO menu option.

We've enhanced the alerting logic for Metrics Monitors to ensure more accurate alerts. For monitors that alert when all data points are above a given threshold at all times within, we've added a customizable parameter for the minimum number of required data points within an alerting window. And, for any existing monitor, the default setting is 2, which means that two data points are required within an alerting window to generate an alert. Learn more.

Critical Monitors that alert you to customer-critical service interruptions and other reliability measurements are great candidates to convert to Service-Level Objectives (SLOs). We've made this easy: you can now create SLOs directly from your Monitors in just a couple of clicks. The thresholds you set in your Monitor will carry over automatically to your new SLO definition, saving you time and effort. Learn more.

We've fixed a bug that caused inconsistent results for queries run on the Frequent and Infrequent data tiers due to inconsistent handling of whitespace characters within quoted phrases. With the fix, query results are now consistent across all data tiers.

For more information, see Normalization of Phrase Queries.

We have updated the Reuse Password After password policy. Previously, you could prevent Sumo Logic users from reusing up to 10 previously used passwords. Now, you can prevent users from reusing up to 12 previously used passwords. For more information, see Set the Password Policy.

Our new tracing Services List view provides a high-level summary of your service health insights and important KPIs in one compact table, allowing you to spot potential issues in your application infrastructure. Learn more.

We've rolled out the ability to customize your alert resolution notifications. So when setting up Sumo Logic webhook connections, you can now design and test both your alert and recovery JSON payloads.

Currently supported for Slack, Microsoft Teams, AWS Lambda, Azure Functions, generic webhook, PagerDuty, OpsGenie, and ServiceNow. Learn more.

note

We're doing a slow rollout for this feature. By Thursday, Jan 19, all customers will have access.

We’re released a new metrics operator: predict. The predict operator takes as input a single time series metric to predict future values. Predicting metrics such as CPU usage or memory consumption is useful for resource and capacity planning. For more information, see predict Metrics Operator.

We've released two metrics updates.

  • Expanded support for thresholds in metrics charts

    We've expanded support for setting Warning and Critical threshold values for metrics query results in charts. Now, you can define threshold metrics values in the Chart view for Time Series panels, and for these chart types for Categorical panels: Line, Area, Bar, Column, and Table. For more information, see Set Warning and Critical Thresholds.

  • Unified where and filter metrics operators

    We have merged the functionality of the filter metrics operator into the where operator. Previously you could use the filter operator to filter out time series, and the where operator to filter out data points within a time series. Now, the updated where operator supports filtering by time series and by data point. For more information, see where Metrics Operator.

    note

    The filter operator is still supported, but will be deprecated in the future.

We have added enhanced functionality to the Query Editor to help you create a better search experience and reduce errors when writing queries. This feature matches any open quotes, open brackets (curly, square, or parenthesis brackets), and completes the quotes automatically.

Legal
Privacy Statement
Terms of Use

Copyright © 2023 by Sumo Logic, Inc.