F5 BIG-IP Local Traffic Manager

The F5 - BIG-IP Local Traffic Manager (LTM) App helps you optimize and secure network traffic patterns coming into your data center using the F5 BIG-IP platform.
The Sumo Logic App for F5 - BIG-IP Local Traffic Manager (LTM) helps you optimize and secure network traffic patterns coming into your data center using the F5 BIG-IP platform. This App analyzes traffic flowing through the F5 Local Traffic Manager (LTM) and automatically detects threats using Sumo Logic Threat Intel. The Sumo Logic App for F5 - BIG-IP LTM provides pre-configured dashboards that allow you to monitor traffic details by application, facility, pool, active and non-responding hosts, connections, and logins. It also reports LTM CPU, disk usage, and outliers in LTM activities and traffic patterns.
Log Types
The F5 - BIG-IP Local Traffic Manager (LTM) App uses event logs with payloads, as described in this document.
Sample Log
{
    "event_source":"request_logging",
    "event_timestamp":"2019-01-01:01:01.000Z",
    "hostname":"hostname",
    "client_ip":"192.0.2.42",
    "server_ip":"",
    "http_method":"GET",
    "http_uri":"/",
    "virtual_name":"/Common/app.app/app_vs",
    "tenant":"Common",
    "application":"app.app",
    "telemetryEventCategory": "LTM"
}
Sample Query
The following query sample is from the F5 - BIG-IP LTM - Overview Dashboard, Pool Status panel.
_sourceCategory=f5/bigip/ltm  systemInfo
| json field=_raw "telemetryEventCategory"  as telemetryEventCategory
| json field=_raw "virtualServers"
| parse regex field=virtualServers "name\"\:\"(?<virtualServer_name>[\S]+?)\"" multi
| parse regex field=virtualServers "enabledState\"\:\"(?<enabledState>[\S]+?)\"" multi
| parse regex field=virtualServers "application\"\:\"(?<application>[\S]+?)\"" multi
| parse regex field=virtualServers "availabilityState\"\:\"(?<availabilityState>[\S]+?)\"" multi
| parse regex field=virtualServers "tenant\"\:\"(?<tenant>[\S]+?)\"" multi
| parse regex field=virtualServers "pool\"\:\"(?<pool>[\S]+?)\"" multi
| parse regex field=virtualServers "destination\"\:\"(?<destination>[\S]+?)\"" multi
| parse regex field=virtualServers "clientside.curConns\"\:(?<current_connections>[\S]+?)\," multi
| parse regex field=virtualServers "clientside.bitsOut\"\:(?<client_bits_out>[\S]+?)\," multi
| count by virtualServer_name, pool, application, enabledState, availabilityState
Collecting Logs for the F5 - BIG-IP LTM App
This section provides instructions for collecting logs for the F5 - BIG-IP LTM App, as well as a sample log message and query sample.
Collection overview
The following image provides a high-level view of the F5 - BIG-IP LTM collection process using the Telemetry Streaming.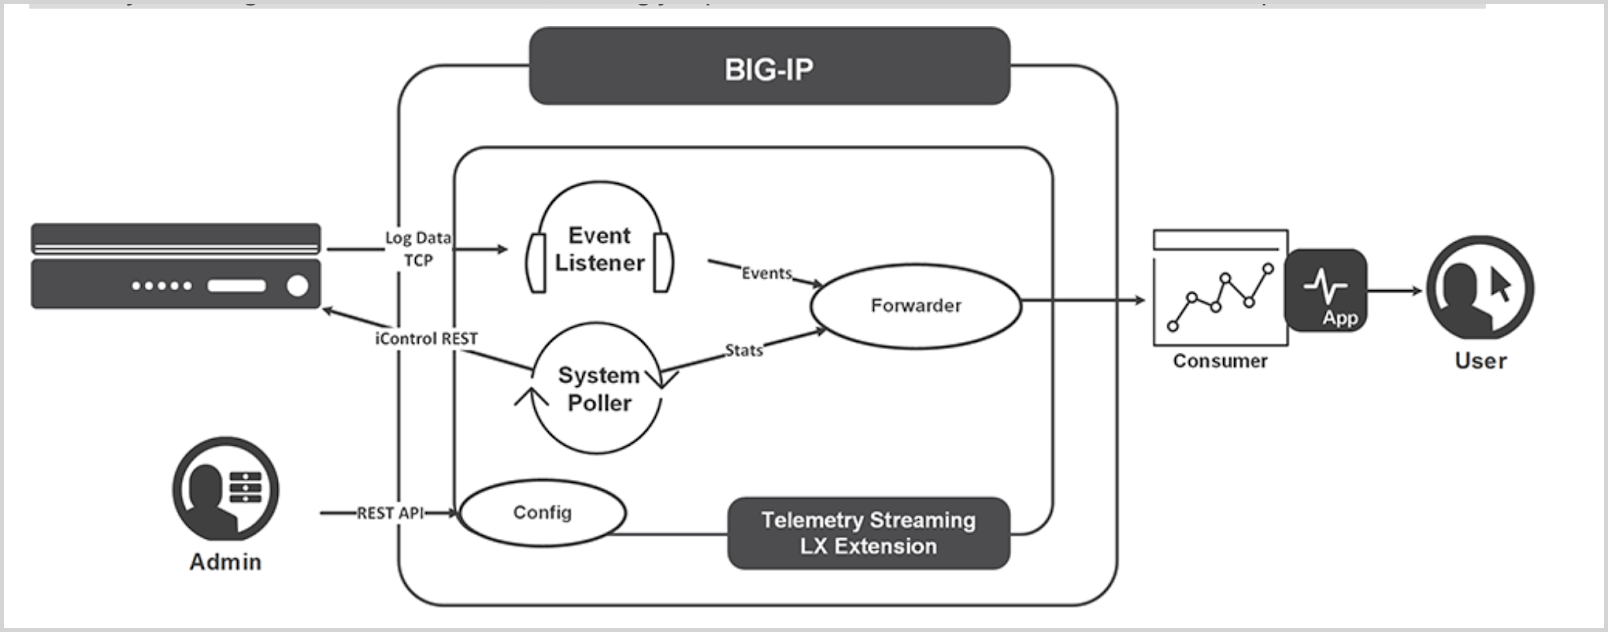
Telemetry Streaming (TS) is a software RPM file. Installing it on BIG-IP enables you to declaratively aggregate, normalize, and forward statistics and events from the BIG-IP to a consumer application by posting a single TS JSON declaration to TS’s declarative REST API endpoint.
Telemetry Streaming uses a declarative model, meaning you provide a JSON declaration rather than a set of imperative commands. For more information on Telemetry Streaming, see here.
Configure Log Collection for the F5 - BIG-IP LTM App
Prerequisite
- Install AS3 RPM
The Application Services 3 (AS3) extension is a mechanism for declaratively configuring application-specific resources on a BIG-IP system. This involves posting a JSON declaration to the system’s API endpoint, https://< BIG-IP>/mgmt/shared/appsvcs/declare.
- Install Telemetry Streaming RPM (download from here).
- Login to F5 (user admin, password from the above output), navigate to the Main tab, iApps > Package Management LX > Import.
- Select the downloaded file and click Upload to upload Telemetry Streaming RPM. For more information on installing TS RPM, see here.
- Enable AVR. To enable the AVR, follow the steps below:
- Go to System > Resource Provisioning.
- Enable Application Visibility and Reporting (AVR)
- Click Submit.
Collection Setup
Perform the following tasks to configure log collection for the F5 - BIG-IP LTM App.
Step 1: Create a Sumo Logic Hosted Collector
- Configure a Hosted Collector in Sumo Logic using these instructions.
- Add an HTTP source, configuring the Source Category with the string f5 in it (e.g. “f5/ltm”). Make a note of the URL for the HTTP source, as you will need it in the following steps. The URL for our example is: https://collectors.us2.sumologic.com/receiver/v1/http/Thisis4fakeendpoint4testing==
Step 2: Use AS3 Declarative language to define a logging profile on BIG-IP.
Download AS3Listener.json from here, and we will use it to define the logging profile st BIG IP. Use the following curl cmd to set logging profile at BIG-IP. Replace BIG-IP PWD, BIG-IP IP, and PORT in the following cmd :
curl -k --user admin:<BIG-IP PWD> -H "Accept: application/json" -H "Content-Type:application/json" -X POST -d@AS3Listener.json https://<BIG-IP IP>:<PORT>/mgmt/shared/appsvcs/declare | python -m json.tool
Step 3: Sumo Logic Consumer Set up using Telemetry
Download Sumo Logic Consumer sumo.json from here, and replace SUMOLOGIC_HOST.
SUMOLOGIC_SECRET_KEY and SUMOLOGIC_PATH with values from Sumo logic HTTP URL created in step 1.
Example: For Sumo Logic HTTP URL https://collectors.us2.sumologic.com/receiver/v1/http/Thisis4fakeendpoint4testing== above values are as follows :
SUMOLOGIC_HOST. collectors.us2.sumologic.comSUMOLOGIC_SECRET_KEY. /receiver/v1/http/SUMOLOGIC_PATH. Thisis4fakeendpoint4testing==
Now, Using telemetry we will define a Sumo Logic sink , which will enable us to forward statistics and events from the BIG-IP to Sumo Logic. Use the following curl cmd and replace BIG-IP PWD, BIG-IP IP, and PORT.
curl -k --user admin:<BIGIP PWD> -H "Accept: application/json" -H "Content-Type:application/json" -X POST -d@sumo.json https://<BIG-IP IP>:<PORT>3/mgmt/shared/telemetry/declare | python -m json.tool
Installing the F5 - BIG-IP LTM App
This section provides instructions for installing the F5 - BIG-IP LTM App, as well as examples and explanations for each of the predefined dashboards.
Using these instructions imports the JSON into your Sumo Logic environment
Locate and install the app you need from the App Catalog. If you want to see a preview of the dashboards included with the app before installing, click Preview Dashboards.
- From the App Catalog, search for and select the app.
- Select the version of the service you're using and click Add to Library. Version selection is applicable only to a few apps currently. For more information, see Installing the Apps from the Library.
- To install the app, complete the following fields.
- App Name. You can retain the existing name, or enter a name of your choice for the app.
- Data Source. Select either of these options for the data source.
- Choose Source Category, and select a source category from the list.
- Choose Enter a Custom Data Filter, and enter a custom source category beginning with an underscore. Example: (
_sourceCategory=MyCategory).
- Advanced. Select the Location in Library (the default is the Personal folder in the library), or click New Folder to add a new folder.
- Click Add to Library.
Once an app is installed, it will appear in your Personal folder, or other folder that you specified. From here, you can share it with your organization.
Panels will start to fill automatically. It's important to note that each panel slowly fills with data matching the time range query and received since the panel was created. Results won't immediately be available, but with a bit of time, you'll see full graphs and maps.
Viewing F5 - BIG-IP LTM Dashboards
Template variables provide dynamic dashboards that can rescope data on the fly. As you apply variables to troubleshoot through your dashboard, you view dynamic changes to the data for a quicker resolution to the root cause. You can use template variables to drill down and examine the data on a granular level. For more information, see Filter with template variables.
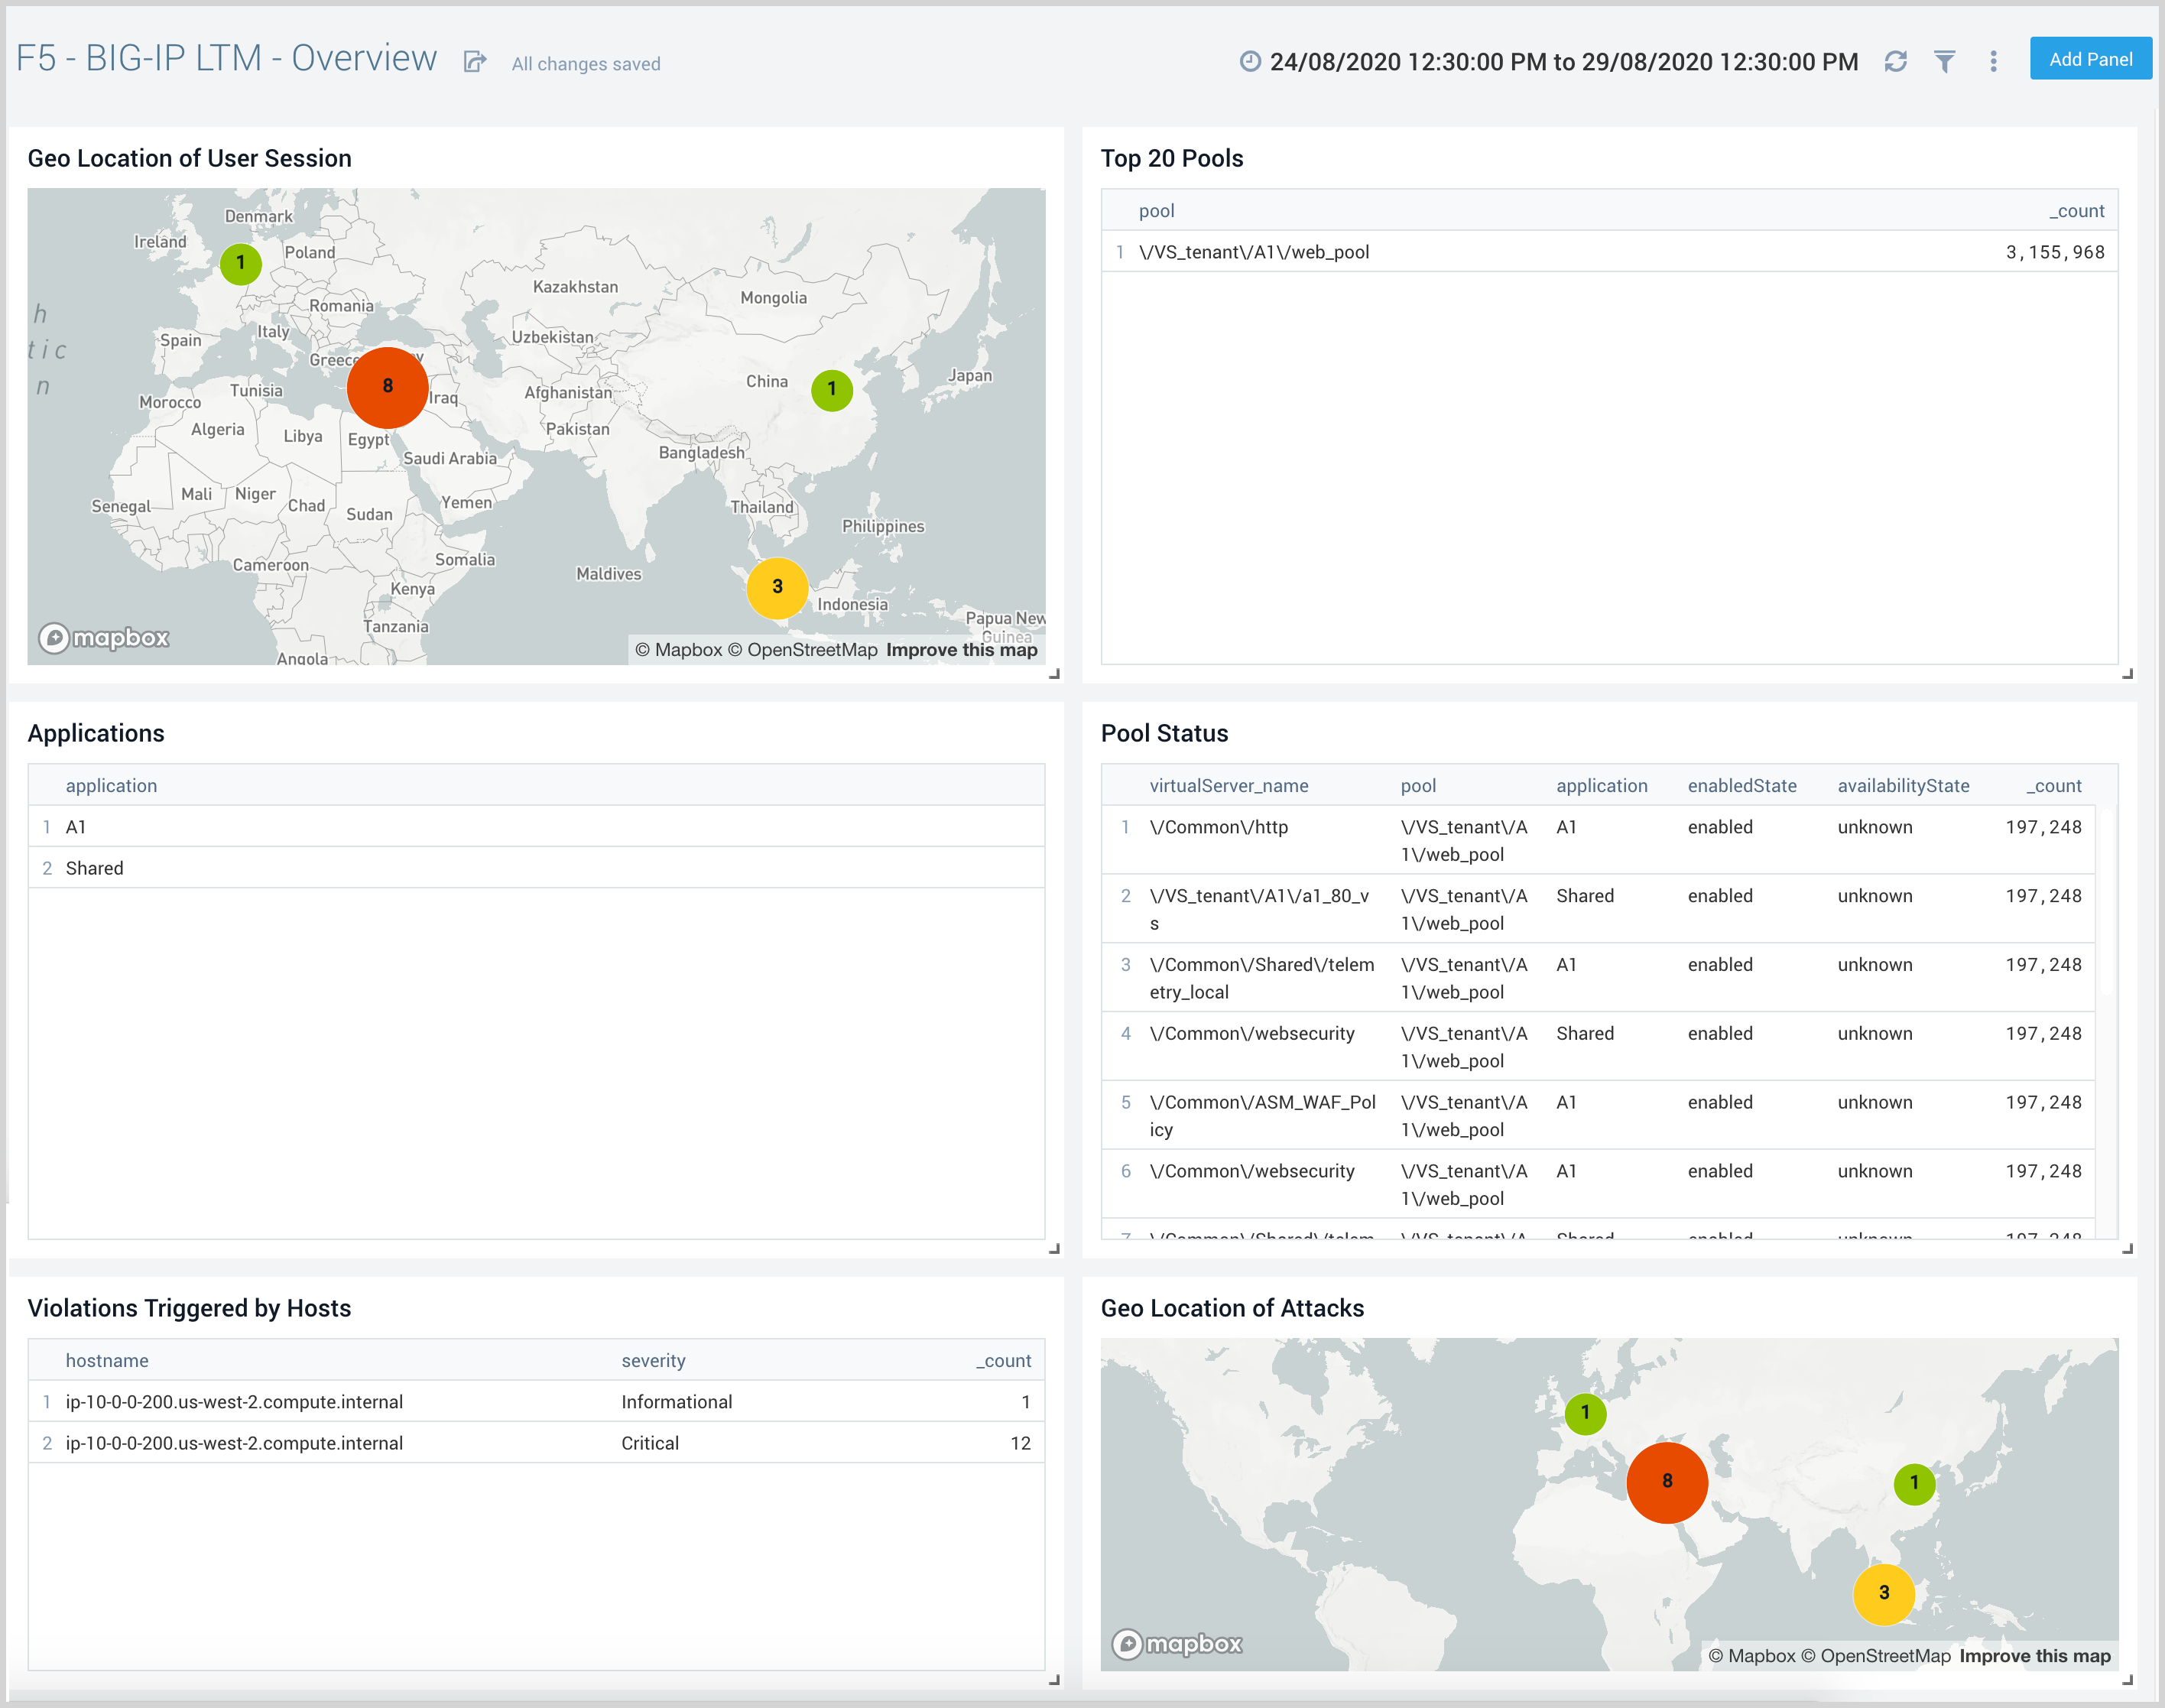
Overview
F5 - BIG-IP LTM - Overview dashboard provides details on the network traffic for applications, pools, and its status. It also provides information about violations triggered and their geo-location.
Use this dashboard to:
- View geographic locations of incoming client requests.
- Get a high-level view of top pools, pool status, and pool names by the application.
- Review applications responsible for network traffic, their facilities, as well as profiles per virtual server by the application.
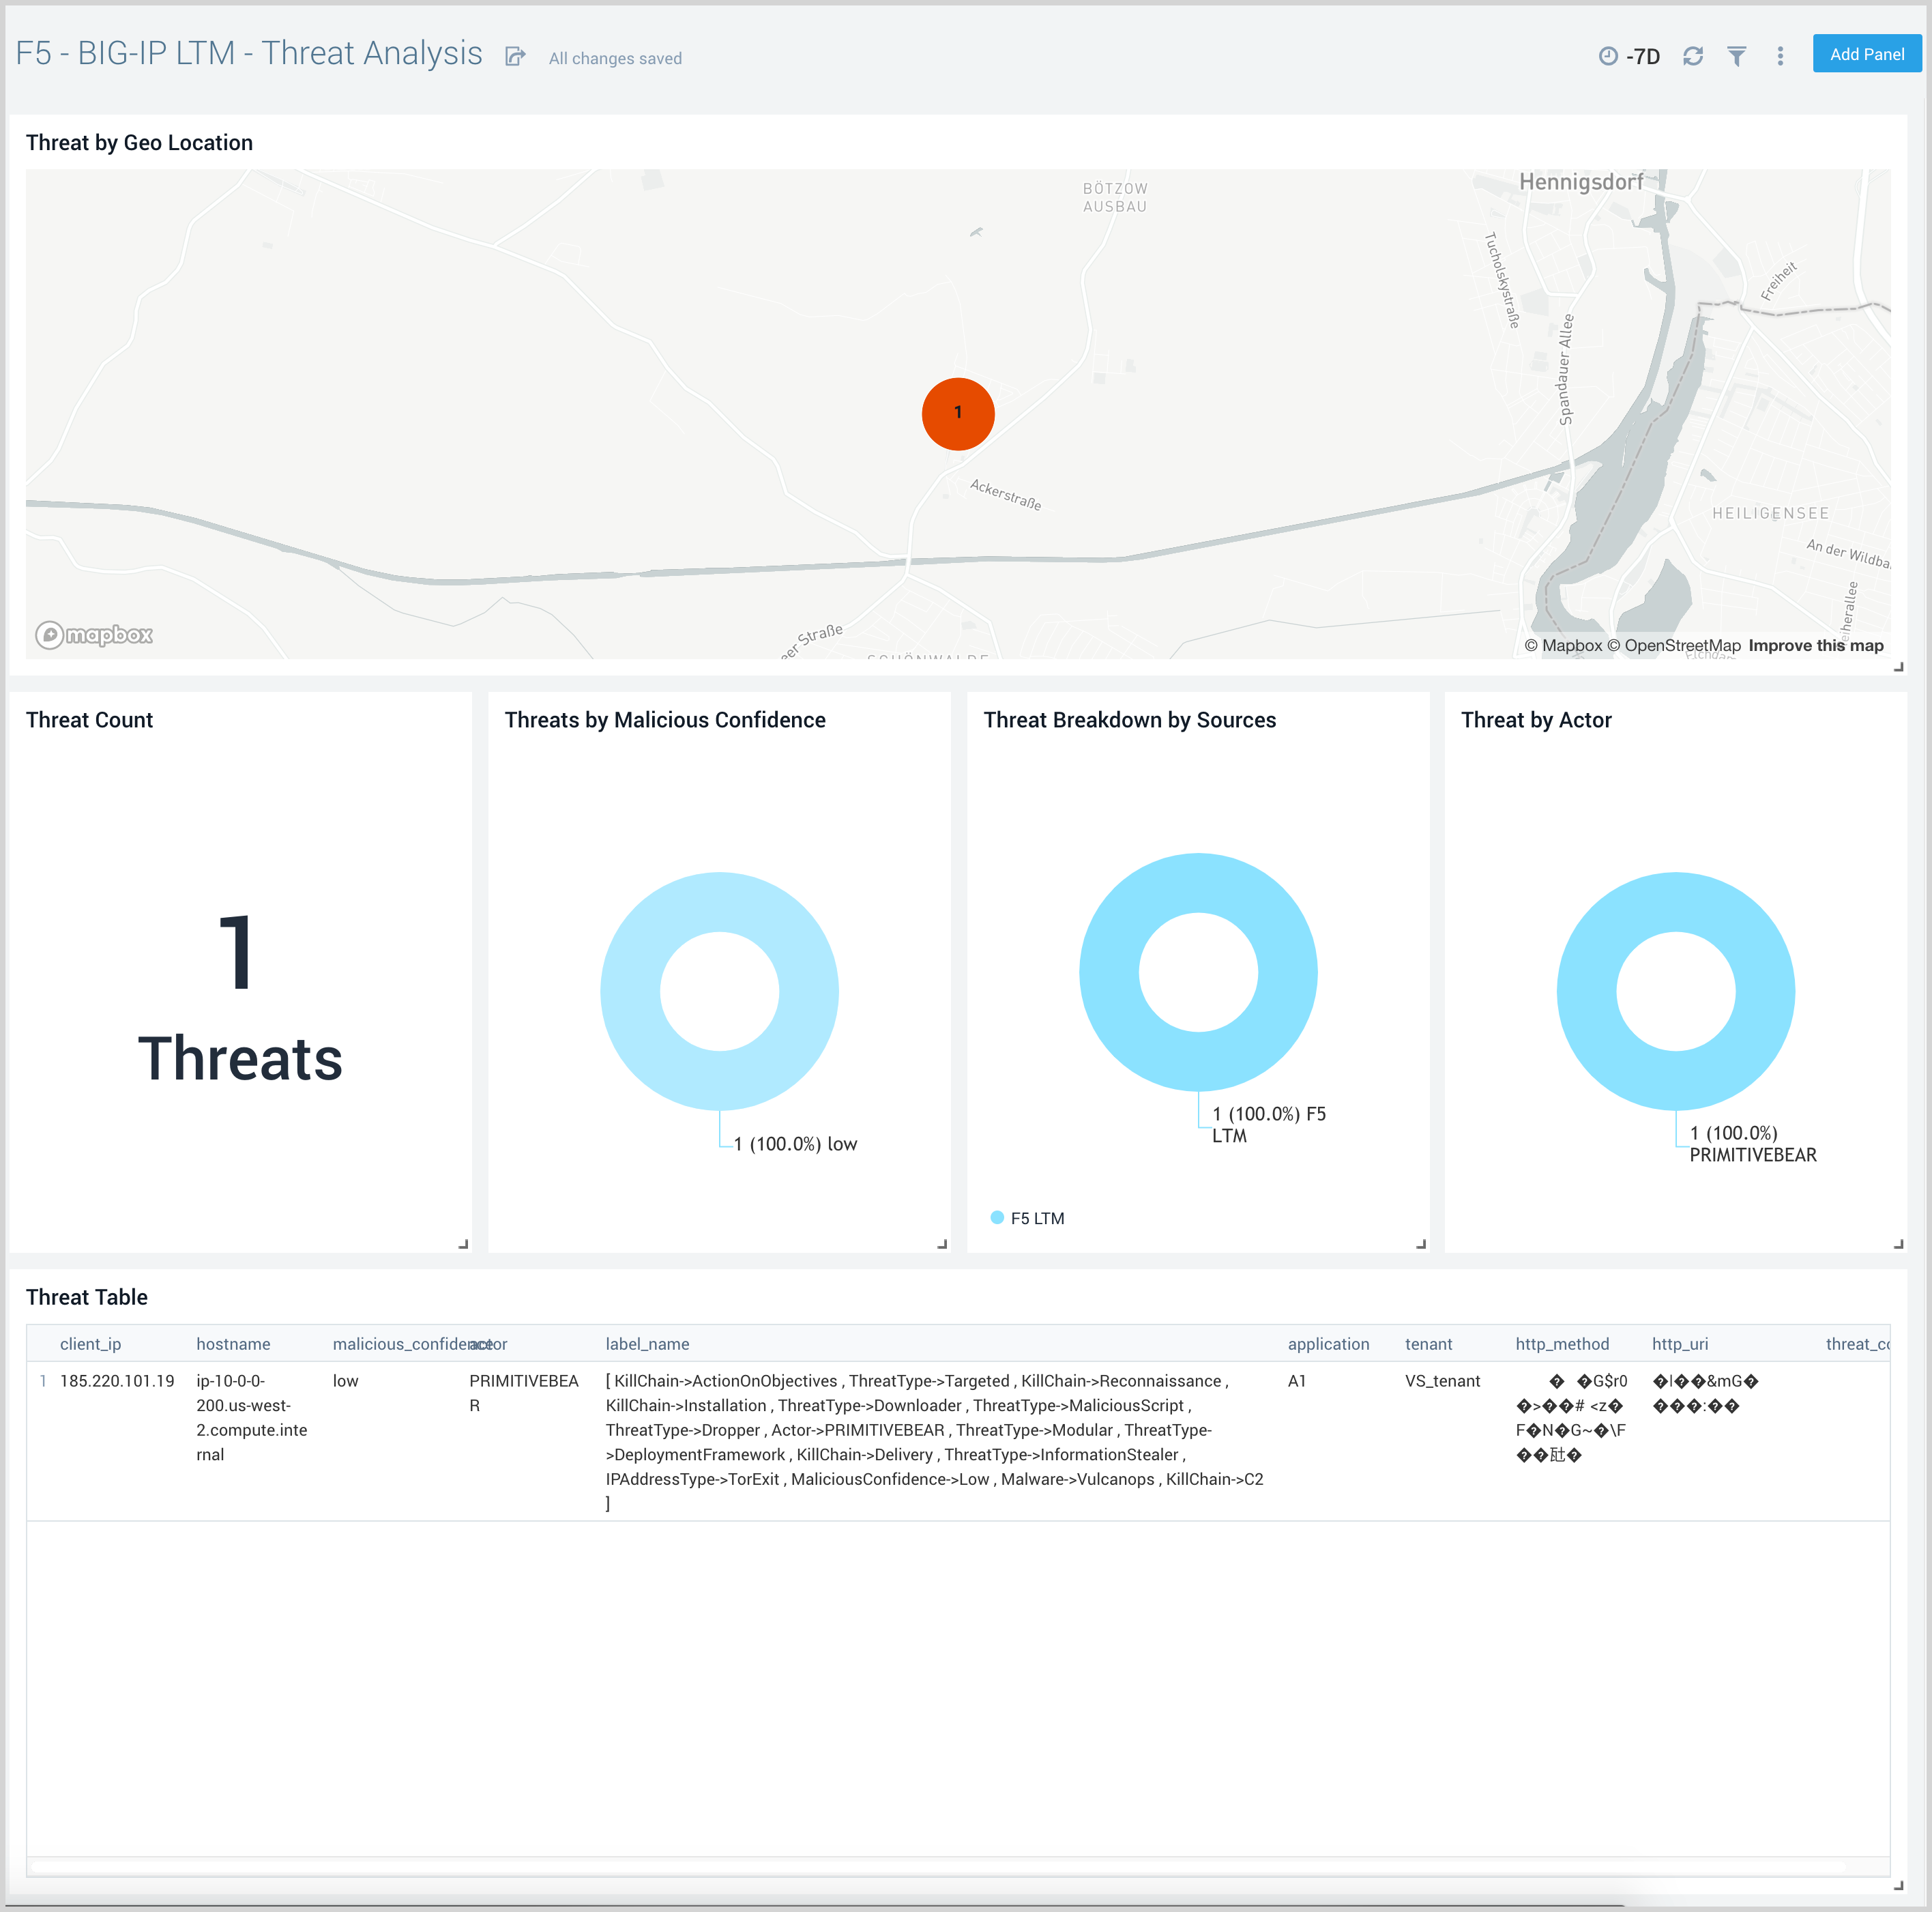
Threat Analysis
F5 - BIG-IP LTM - Threat Analysis dashboard provides an overview of the number of threats, their geographic location, and a breakdown by source using the Threat Intel App. This dashboard also provides details on the severity of threats, as well as the network, user name, and country of origin.
Use this dashboard to:
- Review details on potential threats and IOCs for incoming requests to F5 LTM.
- See the frequency of IP threats by actor, log source, and malicious confidence.
- View trends over time.
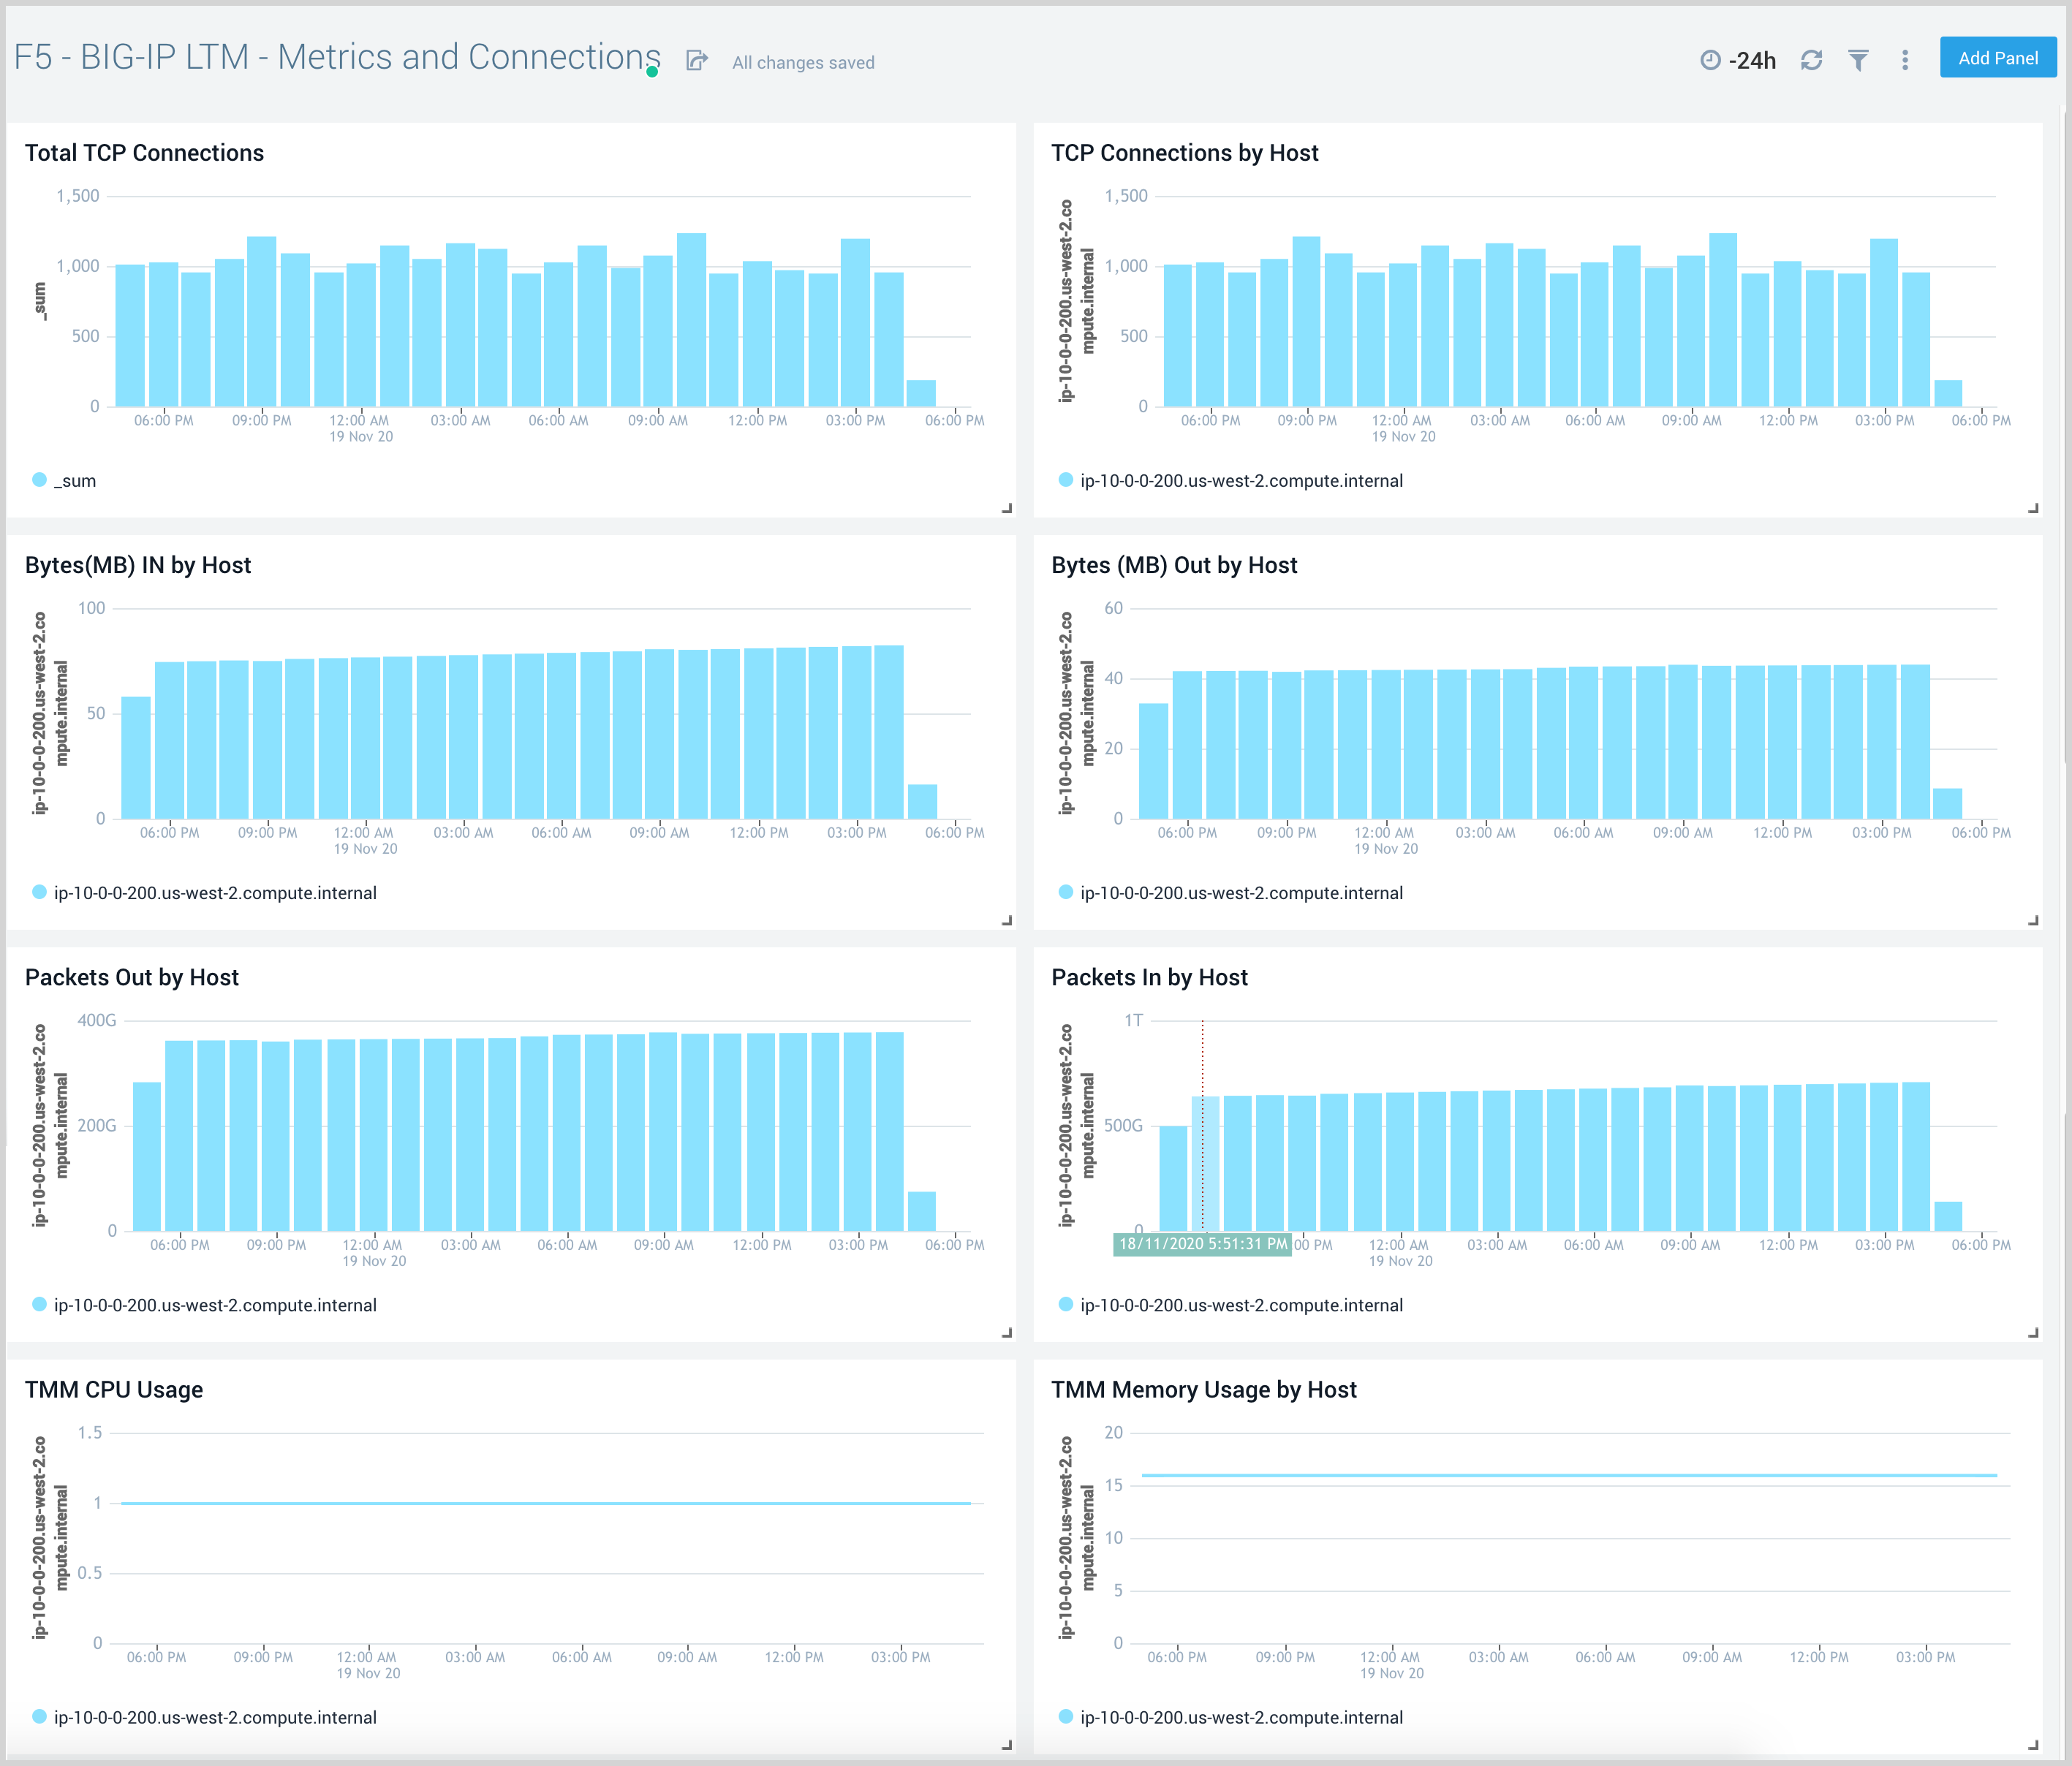
Metrics and Connections
F5 - BIG-IP LTM - Metrics and Connections dashboard provides an at-a-glance view of TCP connections, network traffic by host, and Traffic Manager resource usage.
Use this dashboard to:
- Review details of incoming TCP connection requests.
- Get a high-level analysis of network traffic.
- Get an overview of CPU and memory usage.
- Drill down for a view granular metrics by host using the “host” filter.
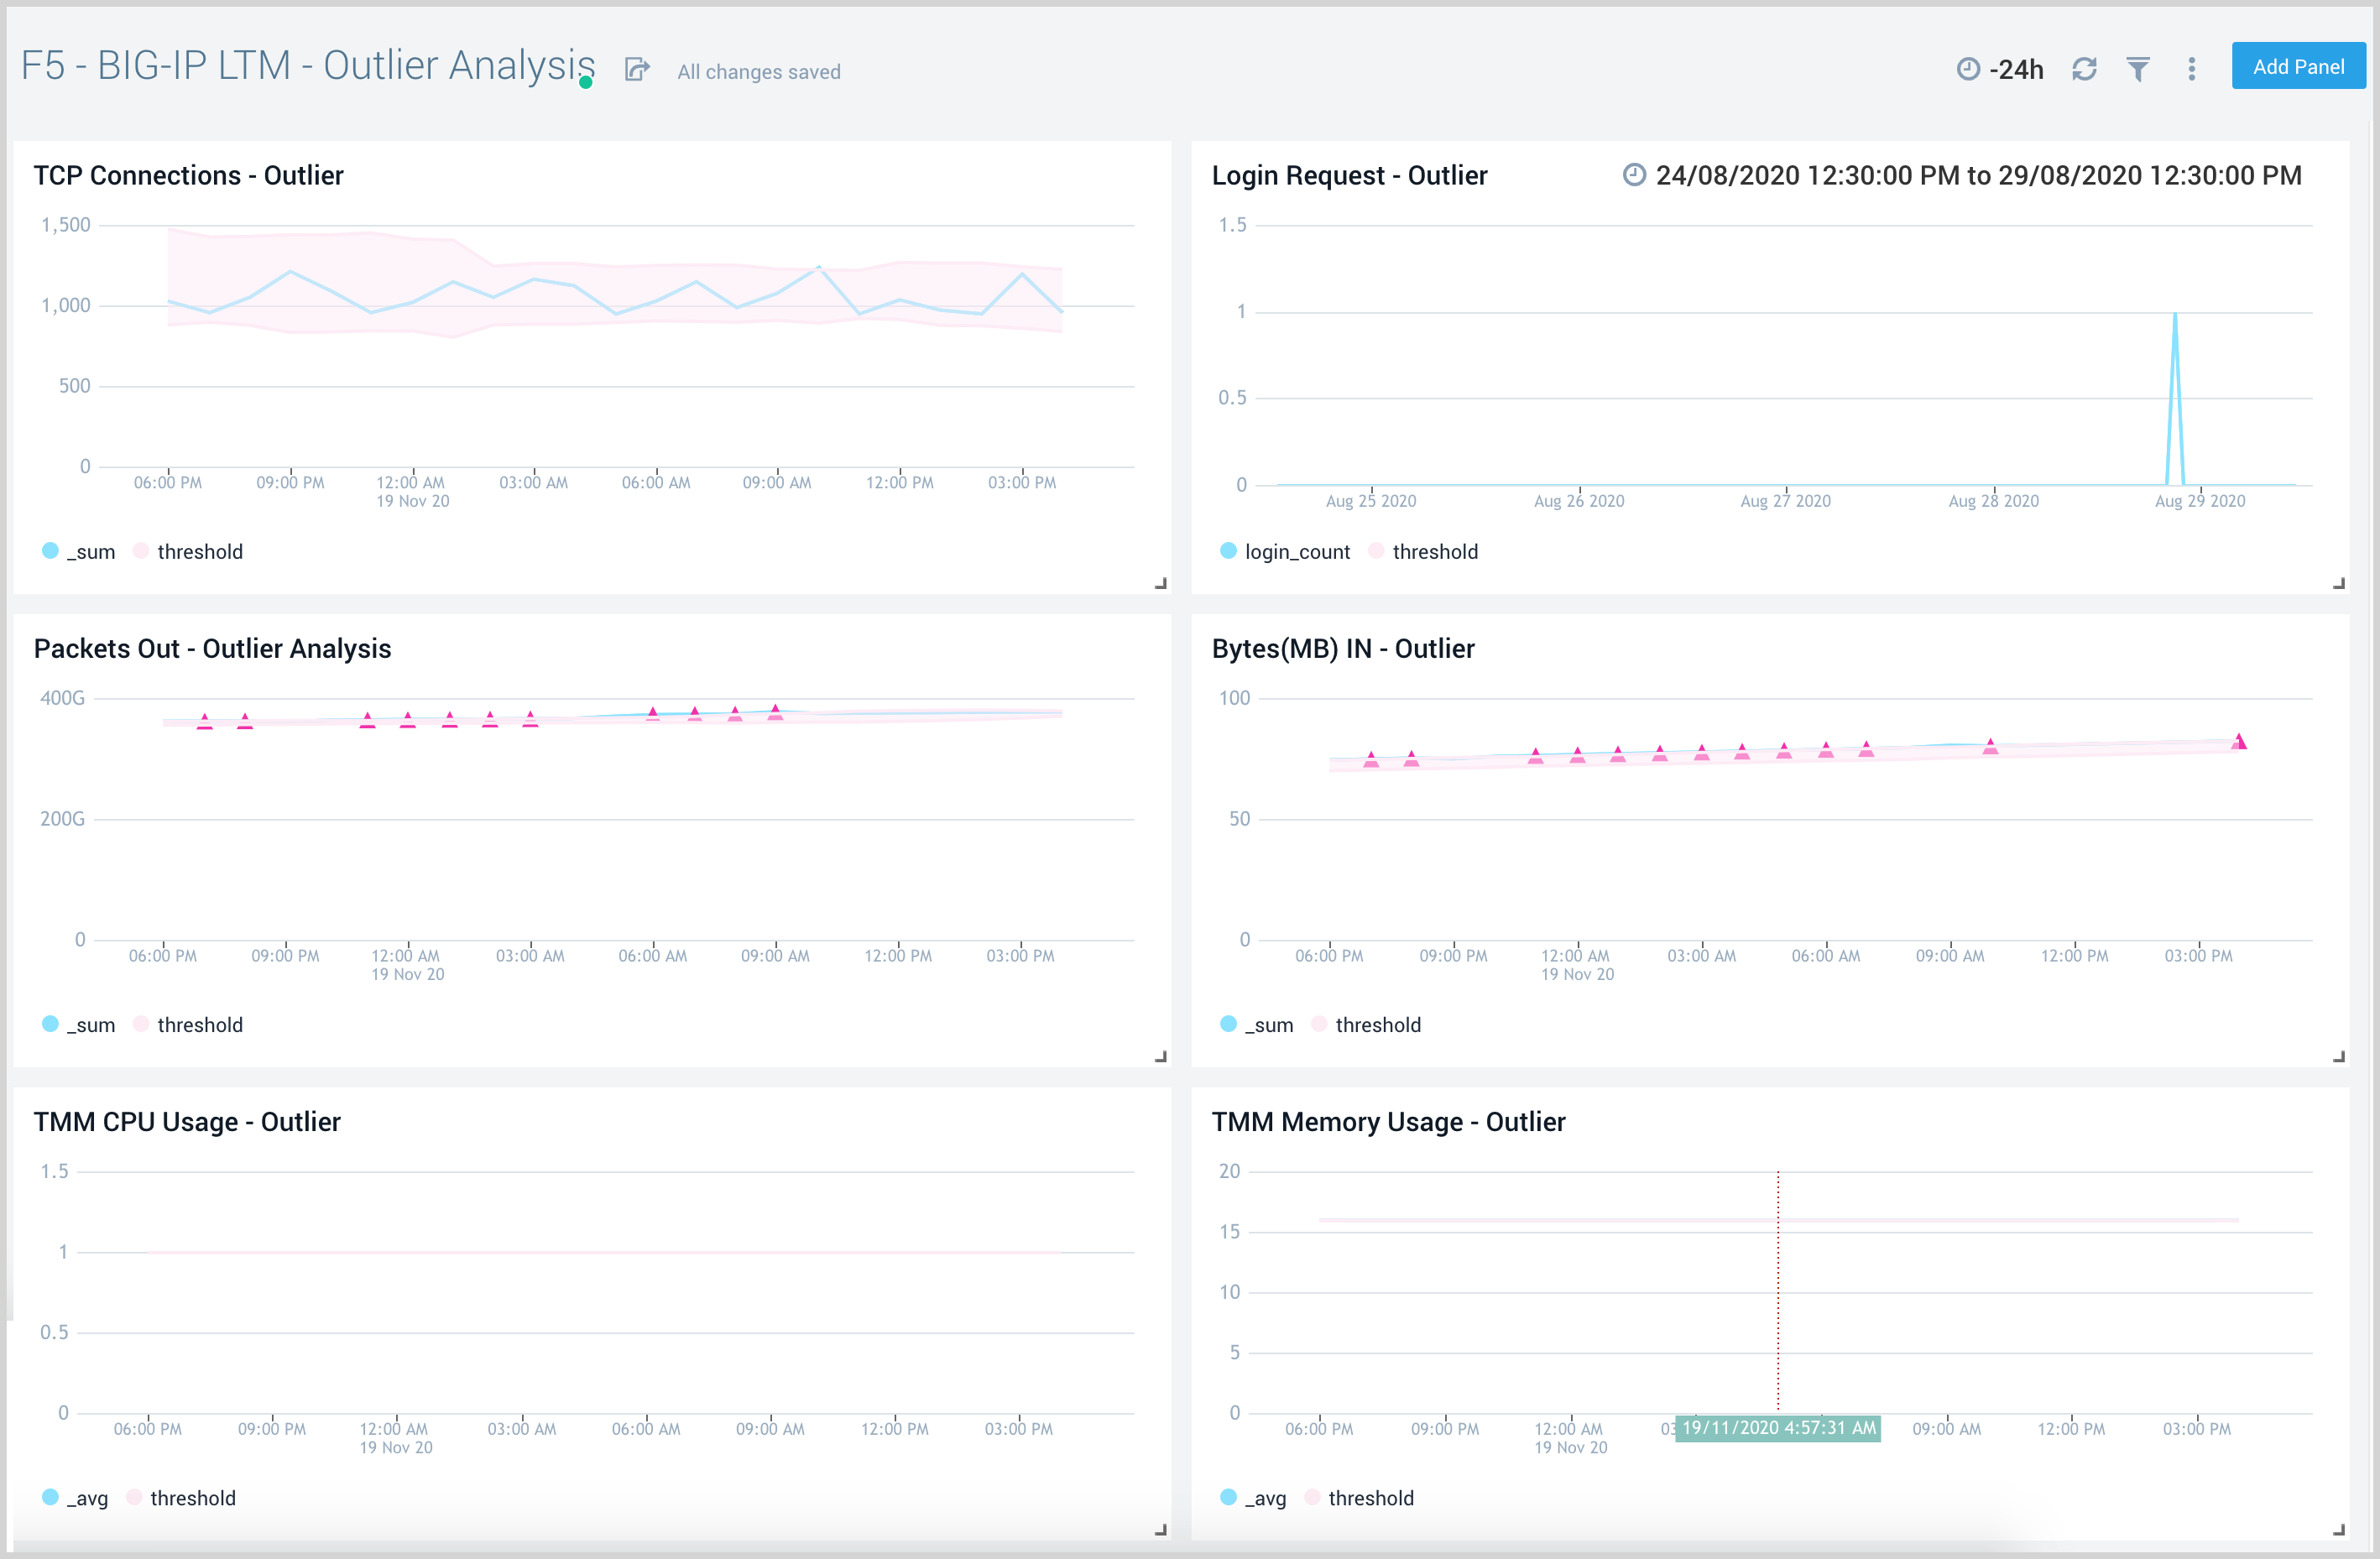
Outlier Analysis
F5 - BIG-IP LTM - Outlier Analysis dashboard provides an at-a-glance view of TCP connection and login request outliers, along with network traffic and Traffic Manager resource usage.
Use this dashboard to find any outliers in your incoming traffic, CPU and memory usage.
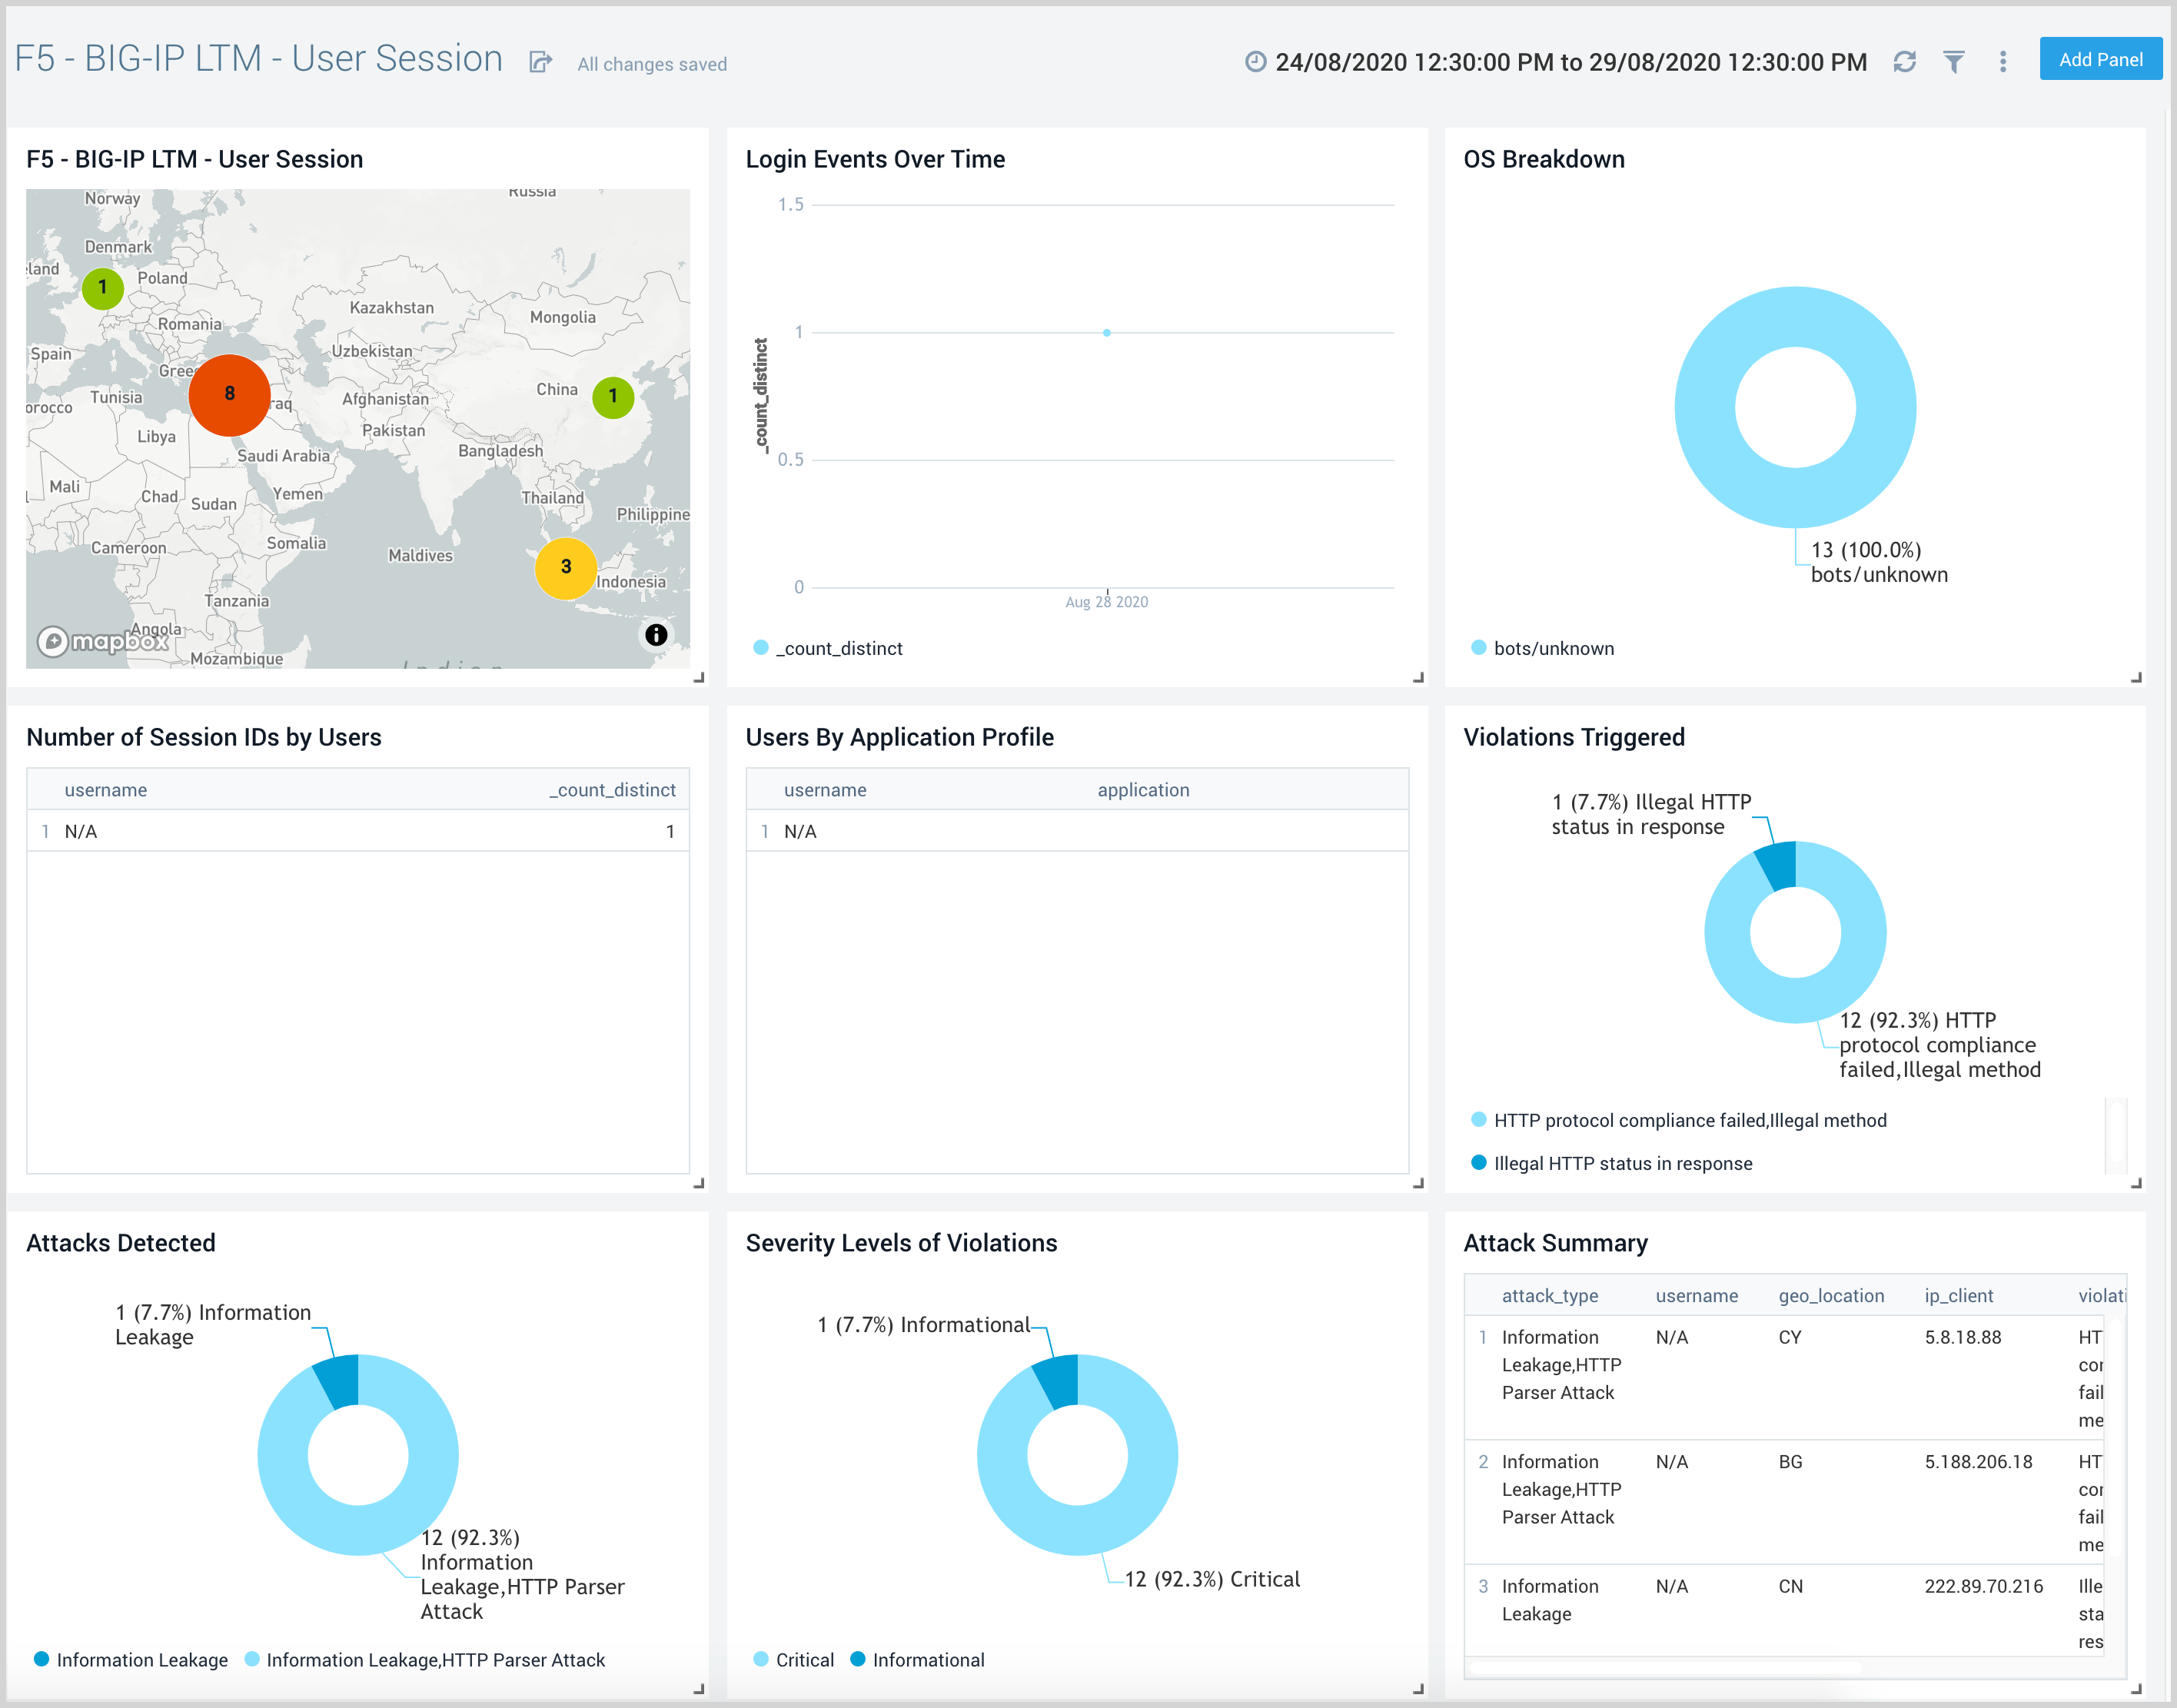
User Session Events
F5 - BIG-IP LTM - User Session Events dashboard provides an at-a-glance view of user activity and their geographic location. This dashboard also provides information on login trends, operating systems used, user session IDs, and users by their application profile.
Use this dashboard to:
- View the geographic location of active users.
- Review information on browsers and platforms used, and network traffic details.
- Review user requests and application access by users.