CrowdStrike Falcon Endpoint Protection
The CrowdStrike Falcon Endpoint Protection App provides visibility into the security posture of your endpoints as analyzed by the CrowdStrike Falcon Endpoint Protection platform. The app allows you to analyze indicators of compromise (IOCs) by affected users, tactic, technique, and objective, and identify hosts on your network with the highest malware detections. The dashboards in this app help identify threats and incidents, from which you can drill down to investigate further.
The CrowdStrike Falcon Endpoint Protection Platform is a cloud-native framework that protects endpoints to stop breaches and improve performance with the robust power of the cloud combined with an intelligent, lightweight endpoint agent.
This version of the CrowdStrike Falcon Endpoint Protection App and its collection process has been tested with SIEM Connector Version 2.1.0+001-siem-release-2.1.0.
Log Types
The CrowdStrike Falcon Endpoint Protection App uses the following log types:
- Detection Event
- Authentication Event
- Detection Status Update Event
For more information on Events, please refer to the CrowdStrike Falcon Endpoint Protection Streaming API Event Dictionary.
Sample Logs
For more information on Events, please refer to Streaming API Event Dictionary.
  {
   {
    "metadata": {
        "customerIDString": “xxxxxxxxxxxxxxxxxxxxxxxxxxxxxx",
        "offset": 14947764,
        "eventType": "DetectionSummaryEvent",
        "eventCreationTime": 1536846439000,
        "version": "1.0"
    },
    "event": {
        "ProcessStartTime": 1536846339,
        "ProcessEndTime": 0,
        "ProcessId": 38684386611,
        "ParentProcessId": 38682494050,
        "ComputerName": "CS-SE-EZ64",
        "UserName": "demo",
        "DetectName": "Process Terminated",
        "DetectDescription": "Terminated a process related to the deletion of backups, which is often indicative of ransomware activity.",
        "Severity": 4,
        "SeverityName": "High",
        "FileName": "explorer.exe",
        "FilePath": "\\Device\\HarddiskVolume1\\Windows",
        "CommandLine": "C:\\Windows\\Explorer.EXE",
        "SHA256String": "6a671b92a69755de6fd063fcbe4ba926d83b49f78c42dbaeed8cdb6bbc57576a",
        "MD5String": "ac4c51eb24aa95b77f705ab159189e24",
        "MachineDomain": "CS-SE-EZ64",
        "FalconHostLink": "<a href="https://falcon.crowdstrike.com/activity/detections/detail/ec86abd353824e96765ecbe18eb4f0b4/38655257584?_cid=xxxxxxxxxxxxxxxxxx">https://falcon.crowdstrike.com/activity...xxxxxxxxxxxxxx</a>",
        "SensorId": "ec86abd353824e96765ecbe18eb4f0b4",
        "DetectId": "ldt:ec86abd353824e96765ecbe18eb4f0b4:38655257584",
        "LocalIP": "xx.xx.xx.xx",
        "MACAddress": "xx-xx-xx-xx-xx",
        "Tactic": "Malware",
        "Technique": "Ransomware",
        "Objective": "Falcon Detection Method",
        "PatternDispositionDescription": "Prevention, process killed.",
        "PatternDispositionValue": 16,
        "PatternDispositionFlags": {
            "Indicator": false,
            "Detect": false,
            "InddetMask": false,
            "SensorOnly": false,
            "Rooting": false,
            "KillProcess": true,
            "KillSubProcess": false,
            "QuarantineMachine": false,
            "QuarantineFile": false,
            "PolicyDisabled": false,
            "KillParent": false,
            "OperationBlocked": false,
            "ProcessBlocked": false
        }
    }
}
{
  "event": {
    "AuditKeyValues": [
      {
        "Key": "target_name",
        "ValueString": "user@example.com"
      }
    ],
    "OperationName": "activateUser",
    "ServiceName": "CrowdStrike Authentication",
    "Success": true,
    "UserId": "user@example.com",
    "UserIp": "192.0.2.100",
    "UTCTimestamp": 1452711518
  },
  "metadata": {
    "customerIDString": "0123456789ABCDEFGHIJKLMNOPQRSTUV",
    "eventType": "AuthActivityAuditEvent",
    "eventCreationTime": 1480375833,
    "offset": 80960
  }
}NOPQRSTUV","eventType":"AuthActivityAuditEvent","eventCreationTime":1480375833,"offset":80960}}
{
    "metadata": {
        "customerIDString": "0123456789ABCDEFGHIJKLMNOPQRSTUV",
        "offset": 11049003,
        "eventType": "UserActivityAuditEvent",
        "eventCreationTime": 1479770848
    },
    "event": {
        "UserId": "user@example.com",
        "UserIp": "",
        "OperationName": "detection_update",
        "ServiceName": "detections",
        "AuditKeyValues": [
            {
                "Key": "detection_id",
                "ValueString": "ldt:b60f82cf1aa342f47363bf3b6bfb6b7d:123456356541"
            },
            {
                "Key": "new_state",
                "ValueString": "in_progress"
            },
            {
                "Key": "assigned_to",
                "ValueString": "Knightley"
            },
            {
                "Key": "assigned_to_uid",
                "ValueString": "user@example.com"
            }
        ],
        "UTCTimestamp": 1479770848
    }
}
Sample Queries
This section provides query examples for each event type.
_sourceCategory=*Crowdstrike*  DetectionSummaryEvent
| json "metadata.eventType", "metadata.customerIDString", "metadata.eventCreationTime" as event_type, customer_id, event_time
| formatDate(fromMillis(event_time), "MM/dd/yyyy HH:mm:ss:SSS") as event_time
| where event_type="DetectionSummaryEvent"
| json "event.Tactic","event.Technique", "event.Objective", "event.ComputerName", "event.UserName", "event.DetectId", "event.DetectDescription", "event.Severity", "event.SeverityName", "event.FileName", "event.FilePath", "event.CommandLine", "event.MD5String", "event.SHA1String", "event.MachineDomain" , "event.FalconHostLink", "event.IOCType", "event.IOCValue", "event.LocalIP", "event.MACAddress" as tactic, technique, objective, computer_name, user_name, detect_id, detect_desc, severity, severity_name, file_name, file_path, cmd_line, md5_string, sha1_string, machine_domain, falconHost_link, IOC_Ttype, IOC_value, local_ip, mac_address
| timeslice 1d
| count_distinct (detect_id) by _timeslice, severity_name
| fillmissing timeslice(1d)
| transpose row _timeslice column severity_name
_sourceCategory=*Crowdstrike*  AuthActivityAuditEvent (userAuthenticate or twoFactorAuthenticate)
| json "metadata.eventType", "metadata.customerIDString", "metadata.eventCreationTime" as event_type, customer_id, event_time
| formatDate(fromMillis(event_time), "MM/dd/yyyy HH:mm:ss:SSS") as event_time
| json "event.UserId", "event.UserIp", "event.OperationName", "event.ServiceName", "event.Success", "event.UTCTimestamp" as src_user, user_ip, operation_name, service_name, success, operation_tim
| formatDate(fromMillis(operation_time), "MM/dd/yyyy HH:mm:ss:SSS") as operation_time
| where success="true"
| count by operation_time, operation_name, src_user, user_ip
_sourceCategory=*Crowdstrike*  UserActivityAuditEvent
| json "metadata.eventType", "metadata.customerIDString", "metadata.eventCreationTime" as event_type, customer_id, event_time
| formatDate(fromMillis(event_time), "MM/dd/yyyy HH:mm:ss:SSS") as event_time
| where event_type="UserActivityAuditEvent"
| json "event.OperationName",  "event.UserId", "event.UserIp", "event.ServiceName", "event.AuditKeyValues" as operation_name, user_id, src_user, service_name, audit_values
| count by operation_name
| sort by _count
Collecting Logs for the CrowdStrike App
This section shows you how to configure log collection from CrowdStrike Falcon Endpoint Protection and have them sent to Sumo Logic. CrowdStrike Falcon Endpoint Protection provides endpoint detection and response, next-gen antivirus, and threat intelligence services through the cloud. Multiple security functions are consolidated into a single lightweight agent, for visibility across using central security analytics with Sumo Logic.
To collect logs from CrowdStrike Falcon Endpoint Protection, if you are not using the Sumo Logic FedRamp deployment, use the new Cloud to Cloud Integration for Crowdstrike to create the source and use the same source category while installing the app.
The sections below are deprecated for non-FedRamp Sumo Logic deployments. If you're using the Sumo Logic FedRamp deployment, use the sections below to configure the collection for this app.
Collection process overview (DEPRECATED)
SIEMs (Security Information and Event Management) are used to gather data from a variety of security products to detect, investigate, correlate, and remediate security threats. The Falcon SIEM Connector provides a fast and efficient way to optimize collection across an extensive number of endpoints.
Sumo Logic recommends installing the SIEM Connector and Sumo Logic Collector on the same machine for best performance.
To set up log collection for CrowdStrike Falcon, you'll download, install, and configure the CrowdStrike SIEM Connector to send data to Sumo Logic, through performing the following tasks.
Data collection flow (DEPRECATED)
The following graphic illustrates the Sumo Logic collection of CrowdStrike streaming API events using a SIEM Connector.
Before you begin (DEPRECATED)
It is important that you complete the following tasks before you start to configure log collection for CrowdStrike Falcon:
- Download the SIEM Connector guide, familiarize yourself with SIEM Connector and its config settings.
- Contact CrowdStrike support to enable the streaming APIs in your environment. You must do this before using the SIEM connector.
Step 1. Download and install CrowdStrike SIEM Connector on a host machine (DEPRECATED)
You perform this procedure from the Falcon console. You must have permission to be able to download and install from Falcon to complete this task.
To install a CrowdStrike SIEM Connector on a host machine, do the following:
- Login to your Falcon console and go to Support > Tool Downloads.
- Download the SIEM Connector installer for your operating system.
- Open a terminal window.
- Run the following installation command appropriate for your OS, replacing the
<installer package>variable with the SIEM installer you downloaded:
- CentOS:
sudo rpm -Uvh <installer package> - Ubuntu:
sudo dpkg -i <installer package>
Step 2. Configure CrowdStrike SIEM Connector (DEPRECATED)
This SIEM connector will stream events data from CrowdStrike Falcon Cloud in JSON format into a local file (output). The default location of the output file is /var/log/crowdstrike/falconhoseclient/output.
To configure CrowdStrike SIEM Connector, do the following:
- In the Falcon console go to Support > API Clients & Keys.
- Create an API client to use with the SIEM connector, and record its API client ID and API client secret. In the the Edit API client dialog, ONLY select the Event streams option, and then click Save.
- Open the /opt/crowdstrike/etc/cs.falconhoseclient.cfg file in a text editor.
- Edit the following lines in the cs.falconhoseclient.cfg file:
- Change app_id to SIEM-Connector.
- client_id - Add your recorded API Client ID
- client_secret - Add your recorded API Client Secret
- Make sure output_format is set to json
- For EventTypeCollection section - Enable all events:
- DetectionSummaryEvent = true
- AuthActivityAuditEvent = true
- UserActivityAuditEvent = true
- HashSpreadingEvent = true
- RemoteResponseSessionStartEvent = true
- RemoteResponseSessionEndEvent = true
- Save your changes.
- Restart the SIEM Connector, as appropriate for your OS:
- CentOS:
sudo service cs.falconhoseclientd start - Ubuntu 14.x:
sudo start cs.falconhoseclientd - Ubuntu 16.4:
sudo systemctl start cs.falconhoseclientd.service
Step 3. Set up a Sumo Logic installed collector and local file source (DEPRECATED)
You setup a Sumo Logic installed collector on the same host as the SIEM Connector. Then, set up a local file source on the installed collector to read the output file from Step 2 and send CrowdStrike Falcon Events to Sumo Logic.
To set up an installed collector and local file source, do the following:
- Install a Sumo Logic collector on the same host as the SIEM Connector. Follow the instructions for your operating system as described in Installed Collectors.
- Add a local file source to the collector for Streaming API Events. Follow the steps on Local File Source, with these additional changes:
- Set the Filepath to: /var/log/crowdstrike/falconhoseclient/output
- Set the Source Category to: crowdstrike/falcon
- Under Enable Multiline Processing, check Boundary Regex and enter the following regex:
^\{.*.
- Click Save.
For more information about the CrowdStrike Falcon SIEM Connector, see the CrowdStrike documentation, or contact CrowdStrike Customer Support at info@crowdstrike.com.
Installing the CrowdStrike Falcon Endpoint Protection App
This section provides instructions for installing the Sumo App for CrowdStrike Falcon Endpoint Protection, as well as examples for each of the app dashboards.
To install the app, do the following:
Locate and install the app you need from the App Catalog. If you want to see a preview of the dashboards included with the app before installing, click Preview Dashboards.
- From the App Catalog, search for and select the app.
- Select the version of the service you're using and click Add to Library. Version selection is applicable only to a few apps currently. For more information, see Installing the Apps from the Library.
- To install the app, complete the following fields.
- App Name. You can retain the existing name, or enter a name of your choice for the app.
- Data Source. Select either of these options for the data source.
- Choose Source Category, and select a source category from the list.
- Choose Enter a Custom Data Filter, and enter a custom source category beginning with an underscore. Example: (
_sourceCategory=MyCategory).
- Advanced. Select the Location in Library (the default is the Personal folder in the library), or click New Folder to add a new folder.
- Click Add to Library.
Once an app is installed, it will appear in your Personal folder, or other folder that you specified. From here, you can share it with your organization.
Panels will start to fill automatically. It's important to note that each panel slowly fills with data matching the time range query and received since the panel was created. Results won't immediately be available, but with a bit of time, you'll see full graphs and maps.
Viewing CrowdStrike Falcon Dashboards
Template variables provide dynamic dashboards that can rescope data on the fly. As you apply variables to troubleshoot through your dashboard, you view dynamic changes to the data for a quicker resolution to the root cause. You can use template variables to drill down and examine the data on a granular level. For more information, see Filter with template variables.
Parsers/FERs Folder
The app includes a "Parsers/FERs" folder that has pre-built searches to help in your investigations. These searches parse out commonly used fields for audit activity, detection summary, incident summary and remote response session events.
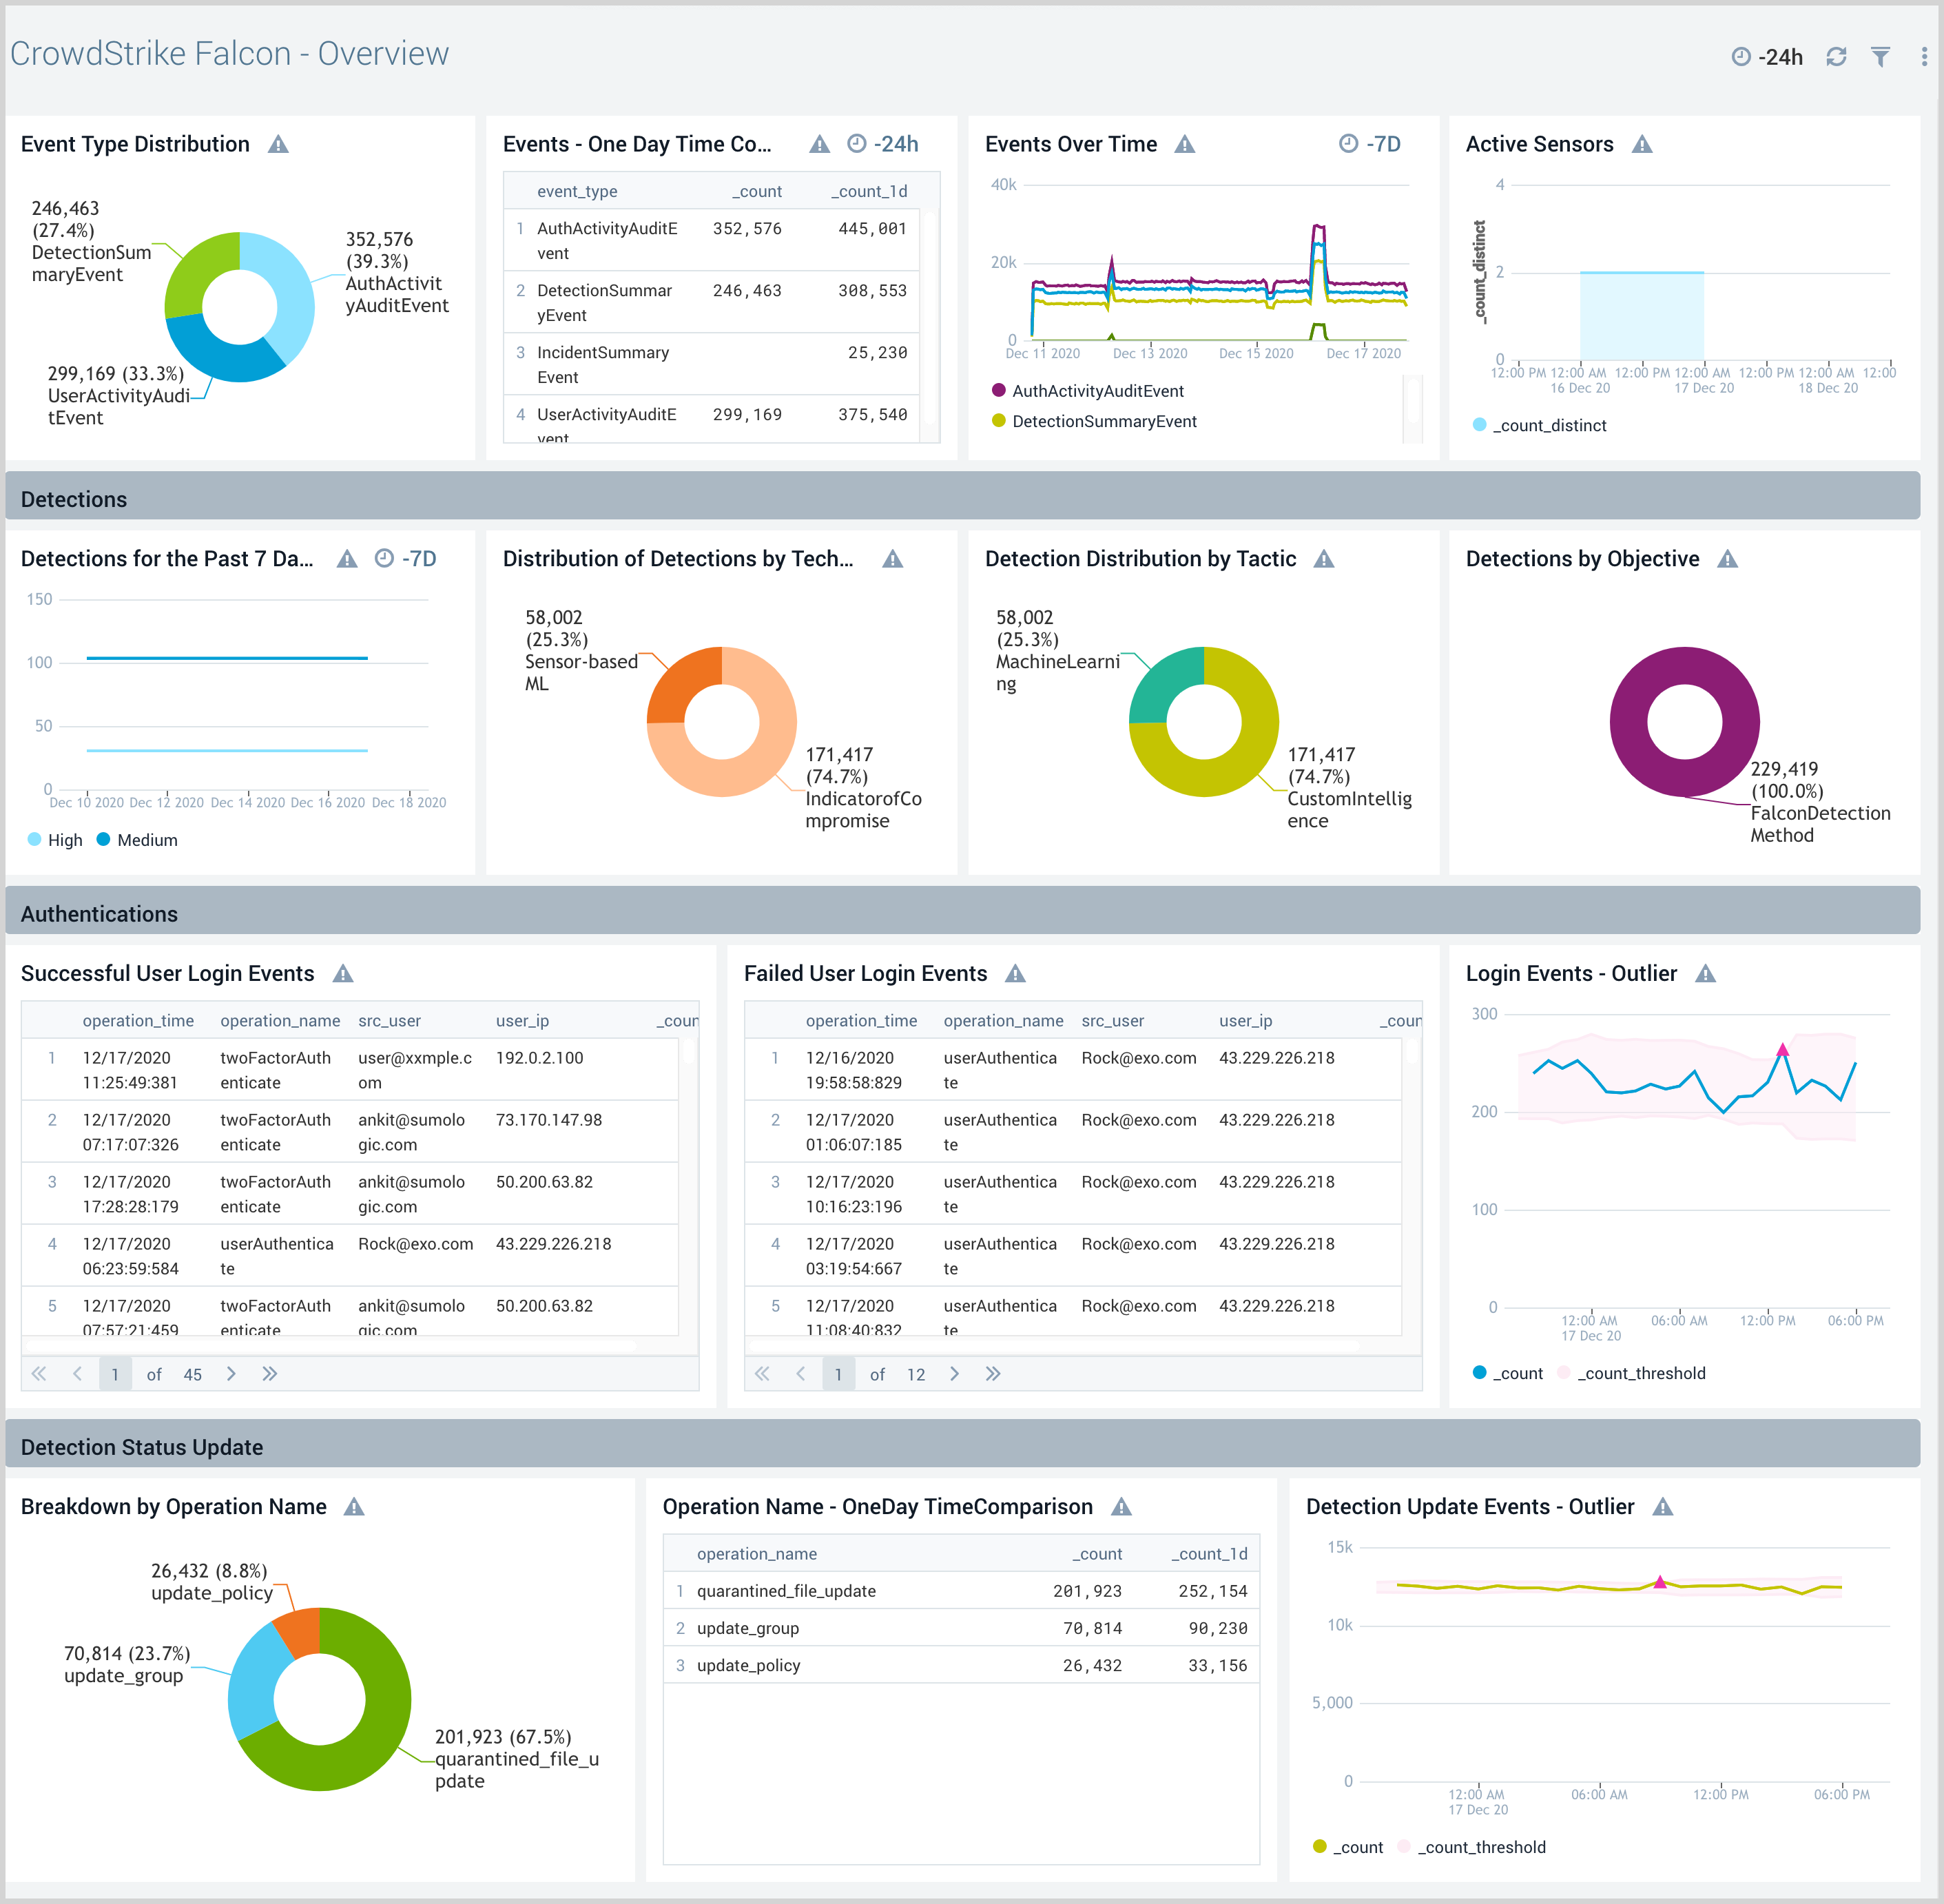
Overview
The CrowdStrike Falcon - Overview dashboard provides high-level visibility into the state of endpoints that are managed by the CrowdStrike Falcon platform. Panels provide insights into events, detections, authentications, and detection status updates for overall security posture and analysis of user activities.
Use this dashboard to:
- Understand the overall security posture of your environment as analyzed by CrowdStrike Falcon deployed in your network.
- Analyze user activities within the Falcon Console.
- Review all detection updates.
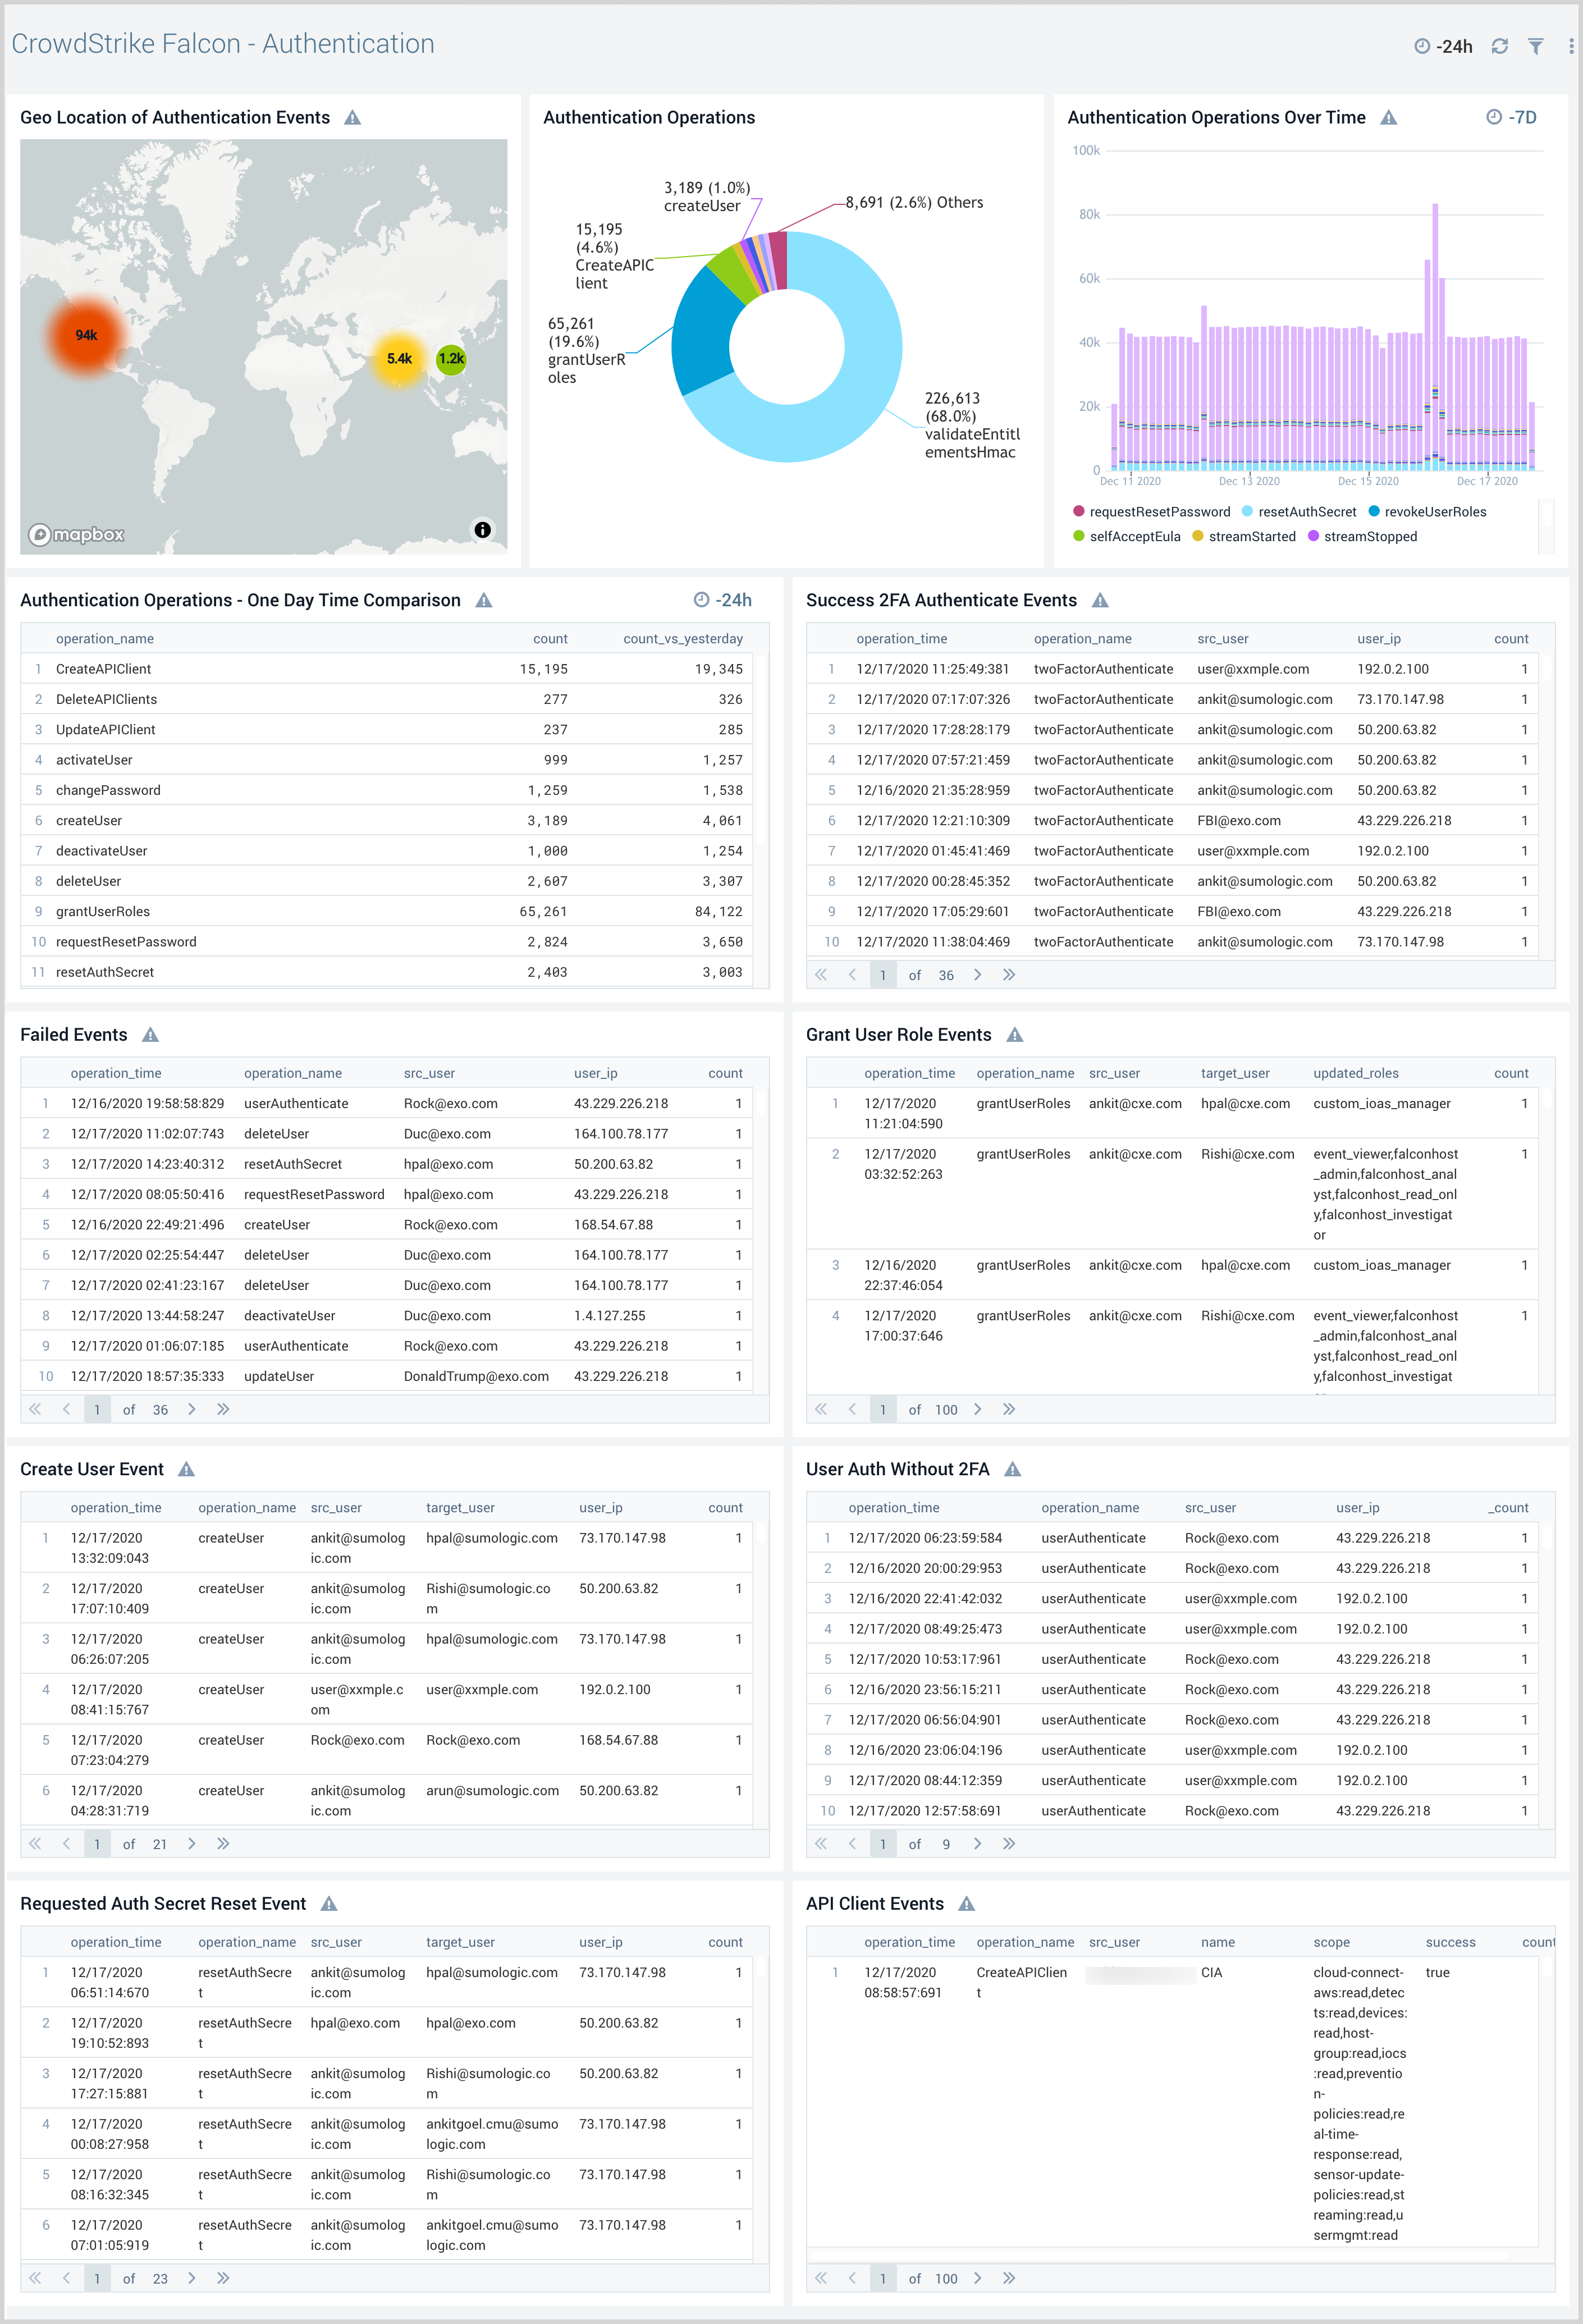
Authentication
The CrowdStrike Falcon - Authentication dashboard provides visibility into authentication-related user activities and their geographic locations. Panels also display detailed information for authentication comparisons and trends, requested auth secrets, 2-factor authentication, API client events, and failed events.
Use this dashboard to:
- Analyze user activities within your Falcon Console and the geographic location of the users responsible for these activities.
- Identify failed authentication events, user logins with and without 2-factor authentication.
- Detect OAuth2 API key access events.
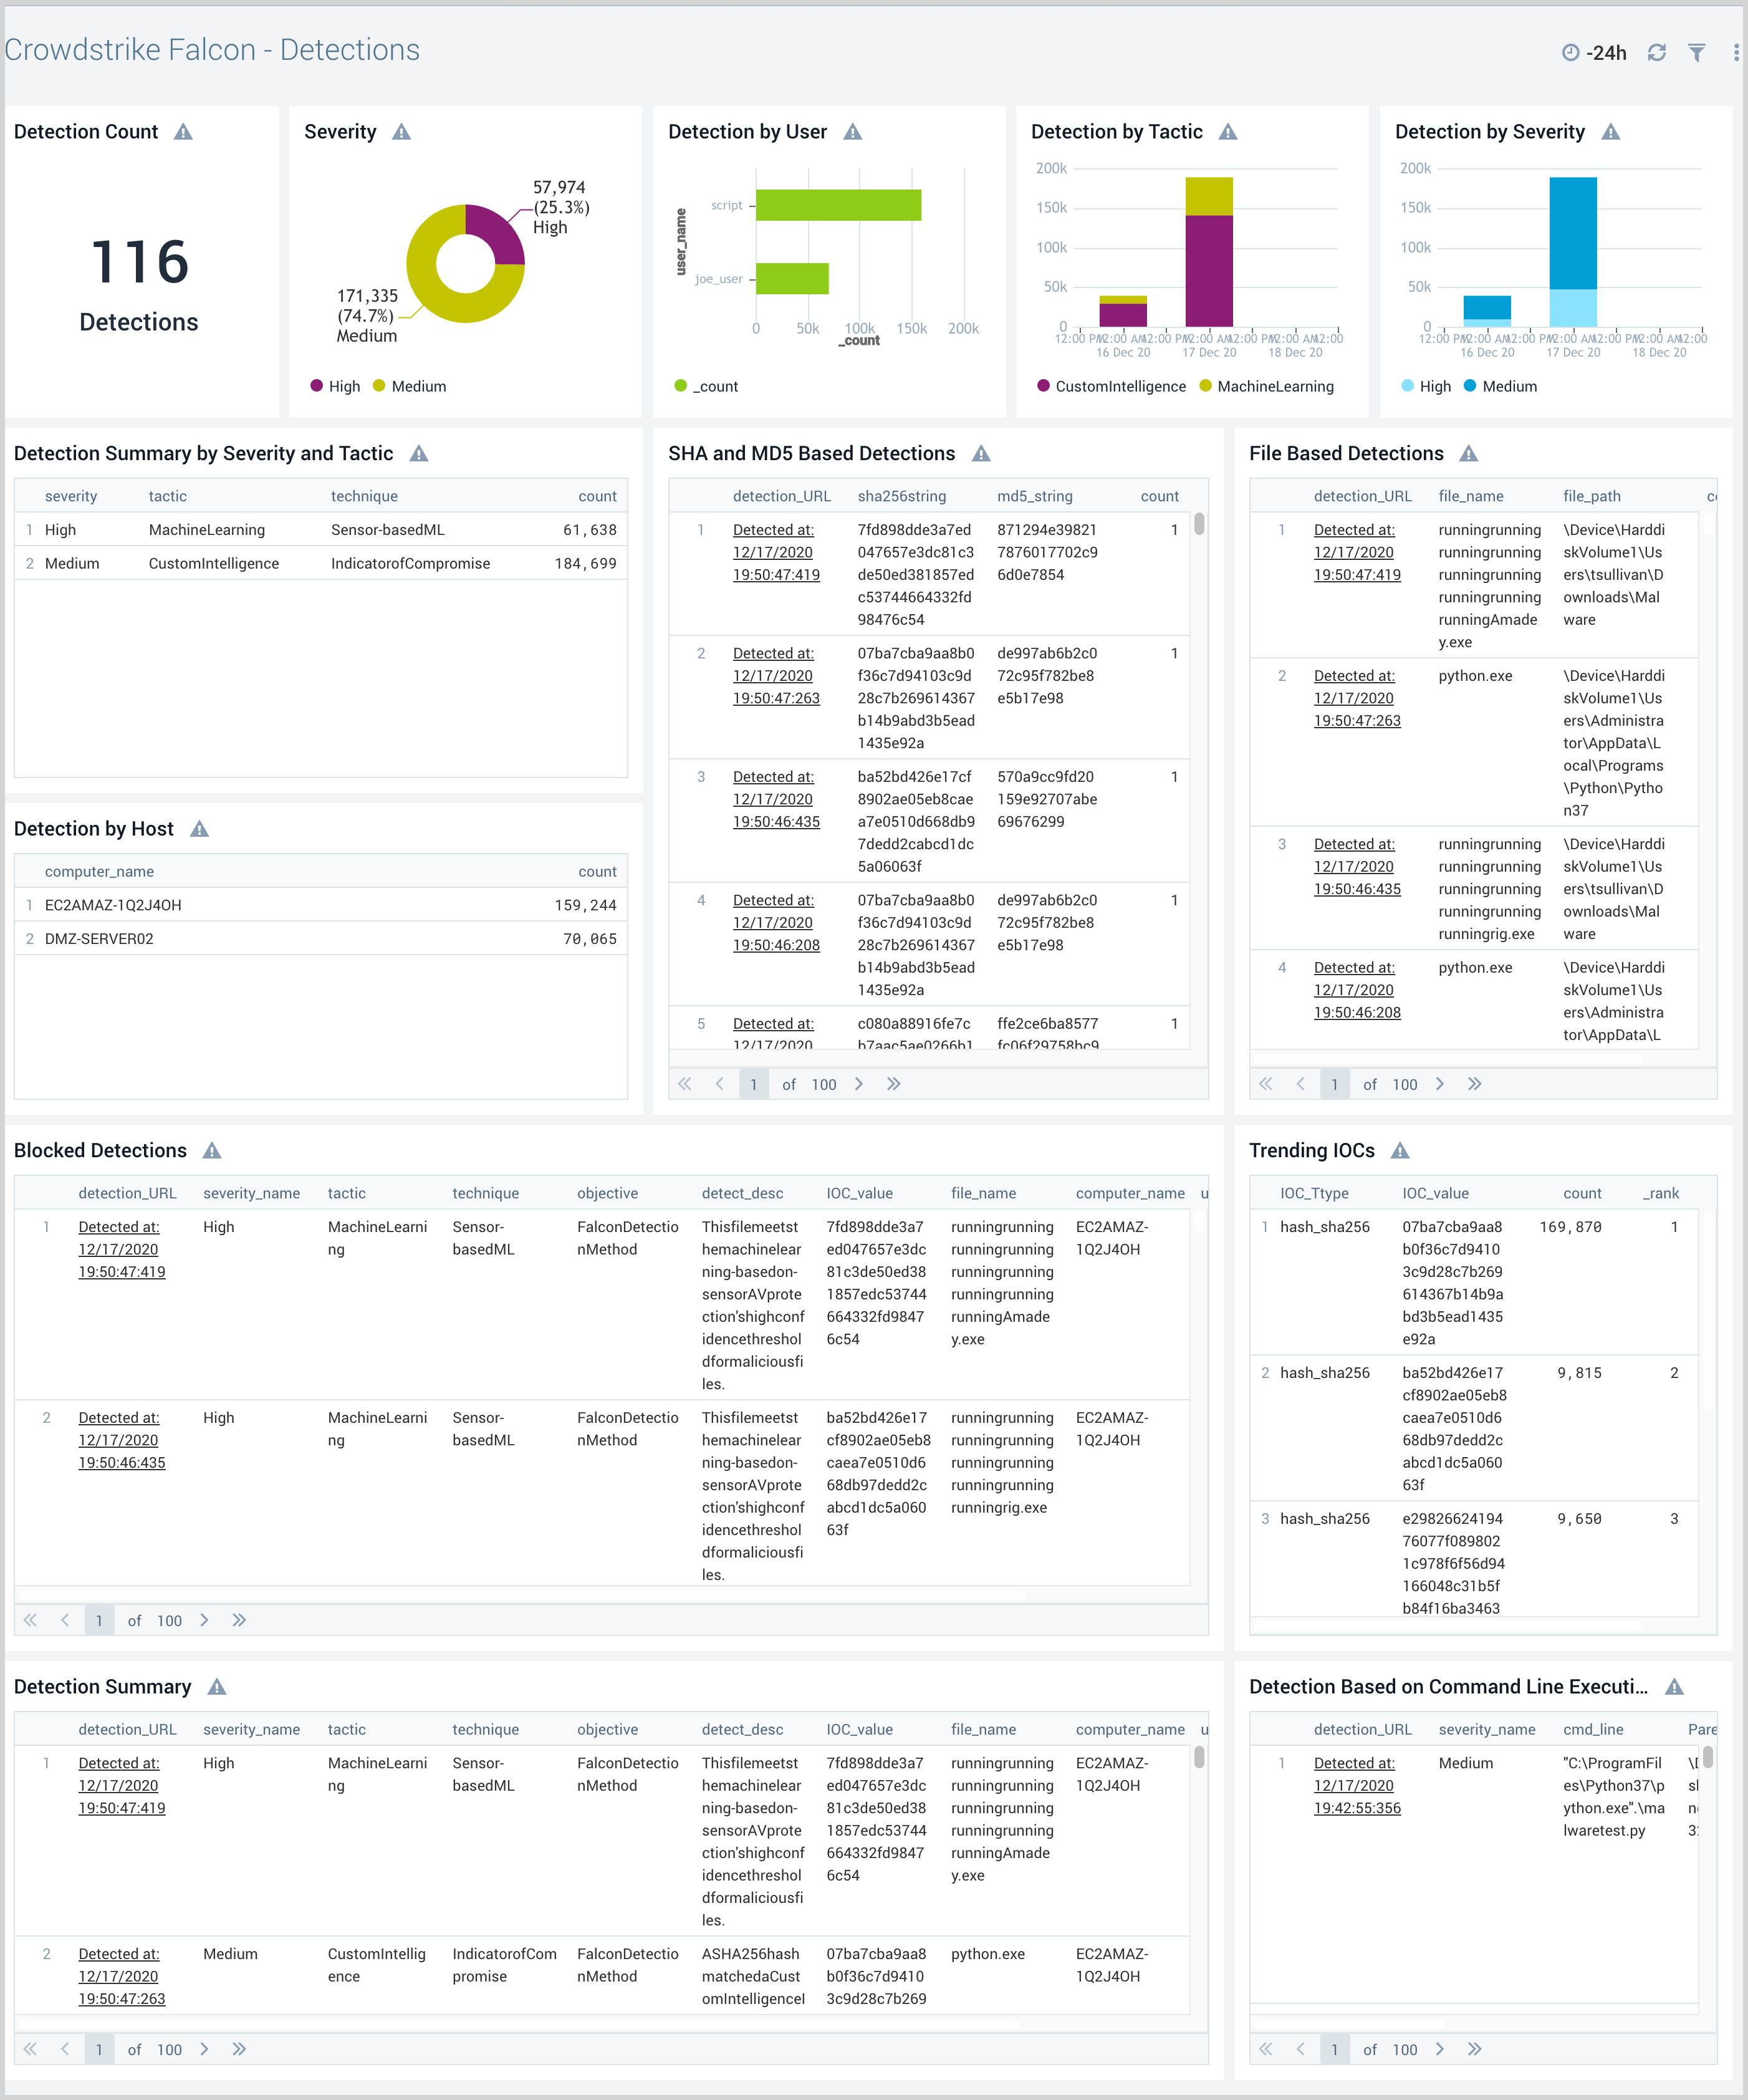
Detections
The CrowdStrike Falcon - Detections dashboard provides visibility into malicious behavior in your environment, where you can analyze group detections, discover blocked detections, and analyze detection trends by type. Panels also display a detailed analysis of detected malware and help quickly identify hosts with the most detected malware.
Use this dashboard to:
- Investigate malicious behavior across your endpoints.
- Analyze group detections by users, tactic, technique, and objective.
- Discover trending IOCs in your network.
- Identify malicious attempts that were blocked by CrowdStrike Falcon.
- Review detailed analysis of malware detected in the Detection Summary panel.
- Find hosts in your network with the most detected malware. Use pre-built links to go to the Falcon Console, so as to assign detection events and take action.
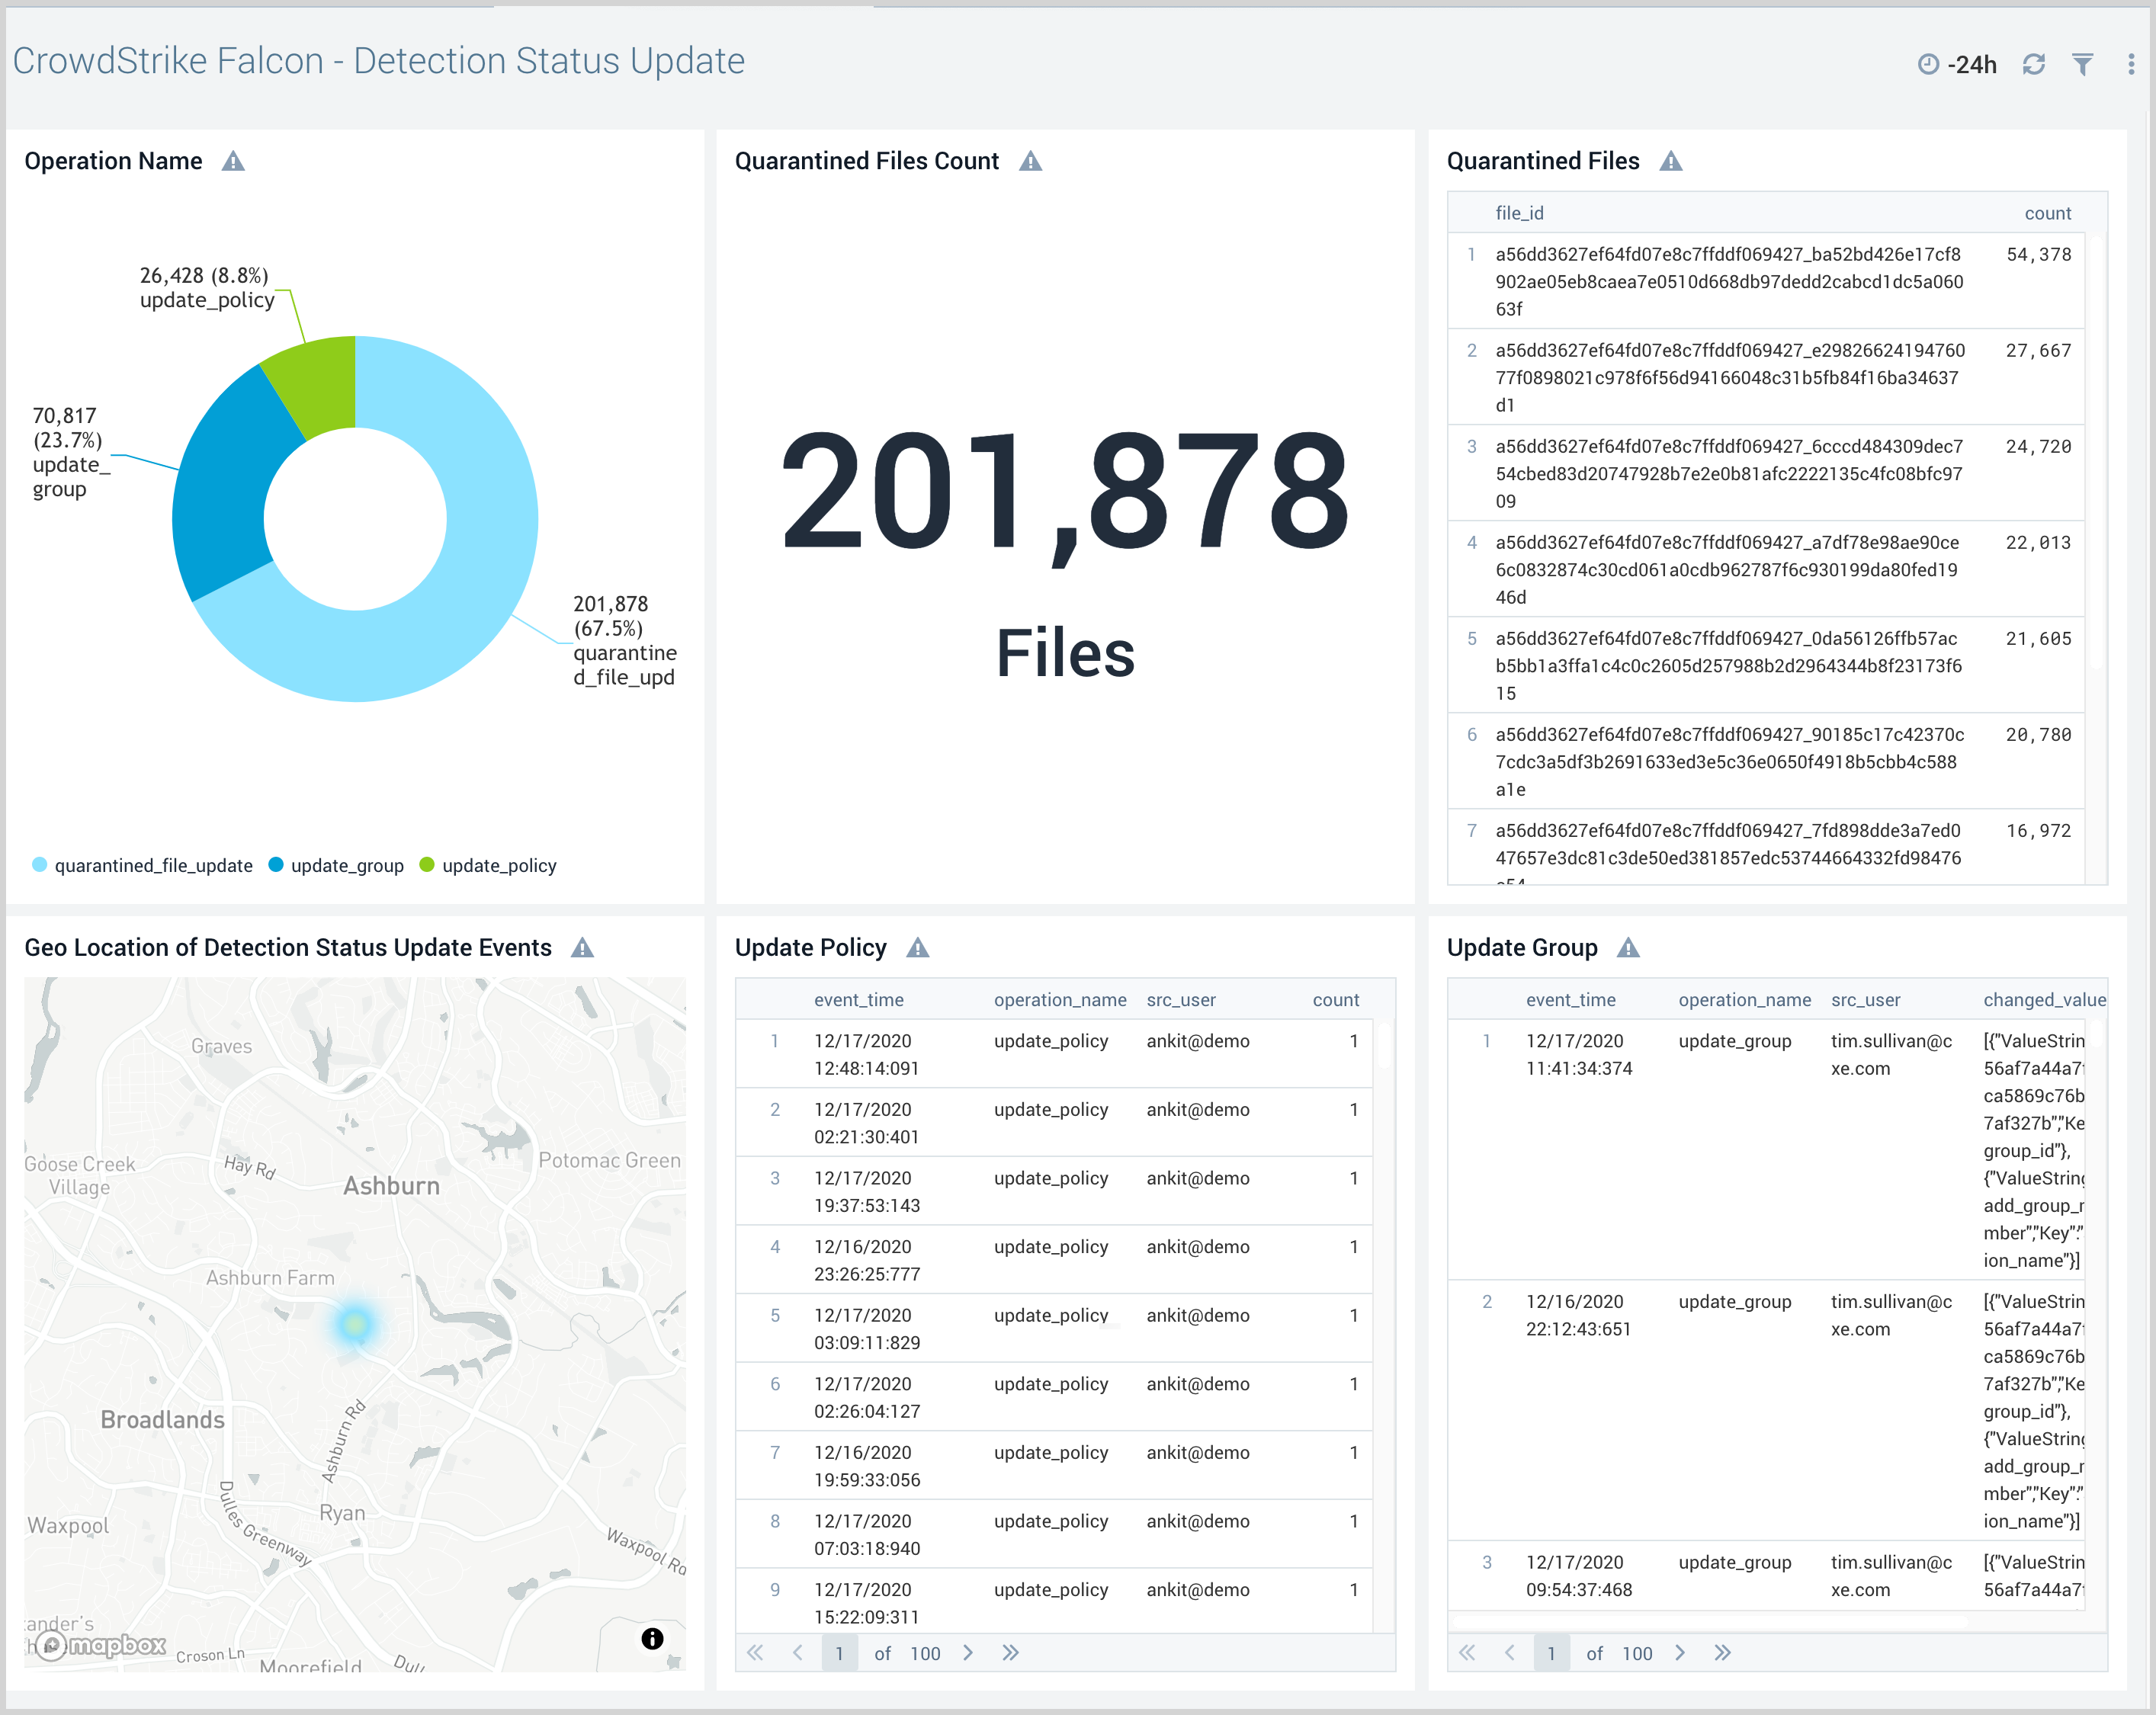
Detection Status Update
The CrowdStrike Falcon - Detection Status Update dashboard provides high-level and detailed insights into the status of severity event detection in your CrowdStrike environment. Panels display event geographic locations, event classification by operation, details on quarantined files, and updates on policies and groups.
Use this dashboard to:
- Find and analyze any updates to malware detections by CrowdStrike Falcon users.
- Identify quarantined files.
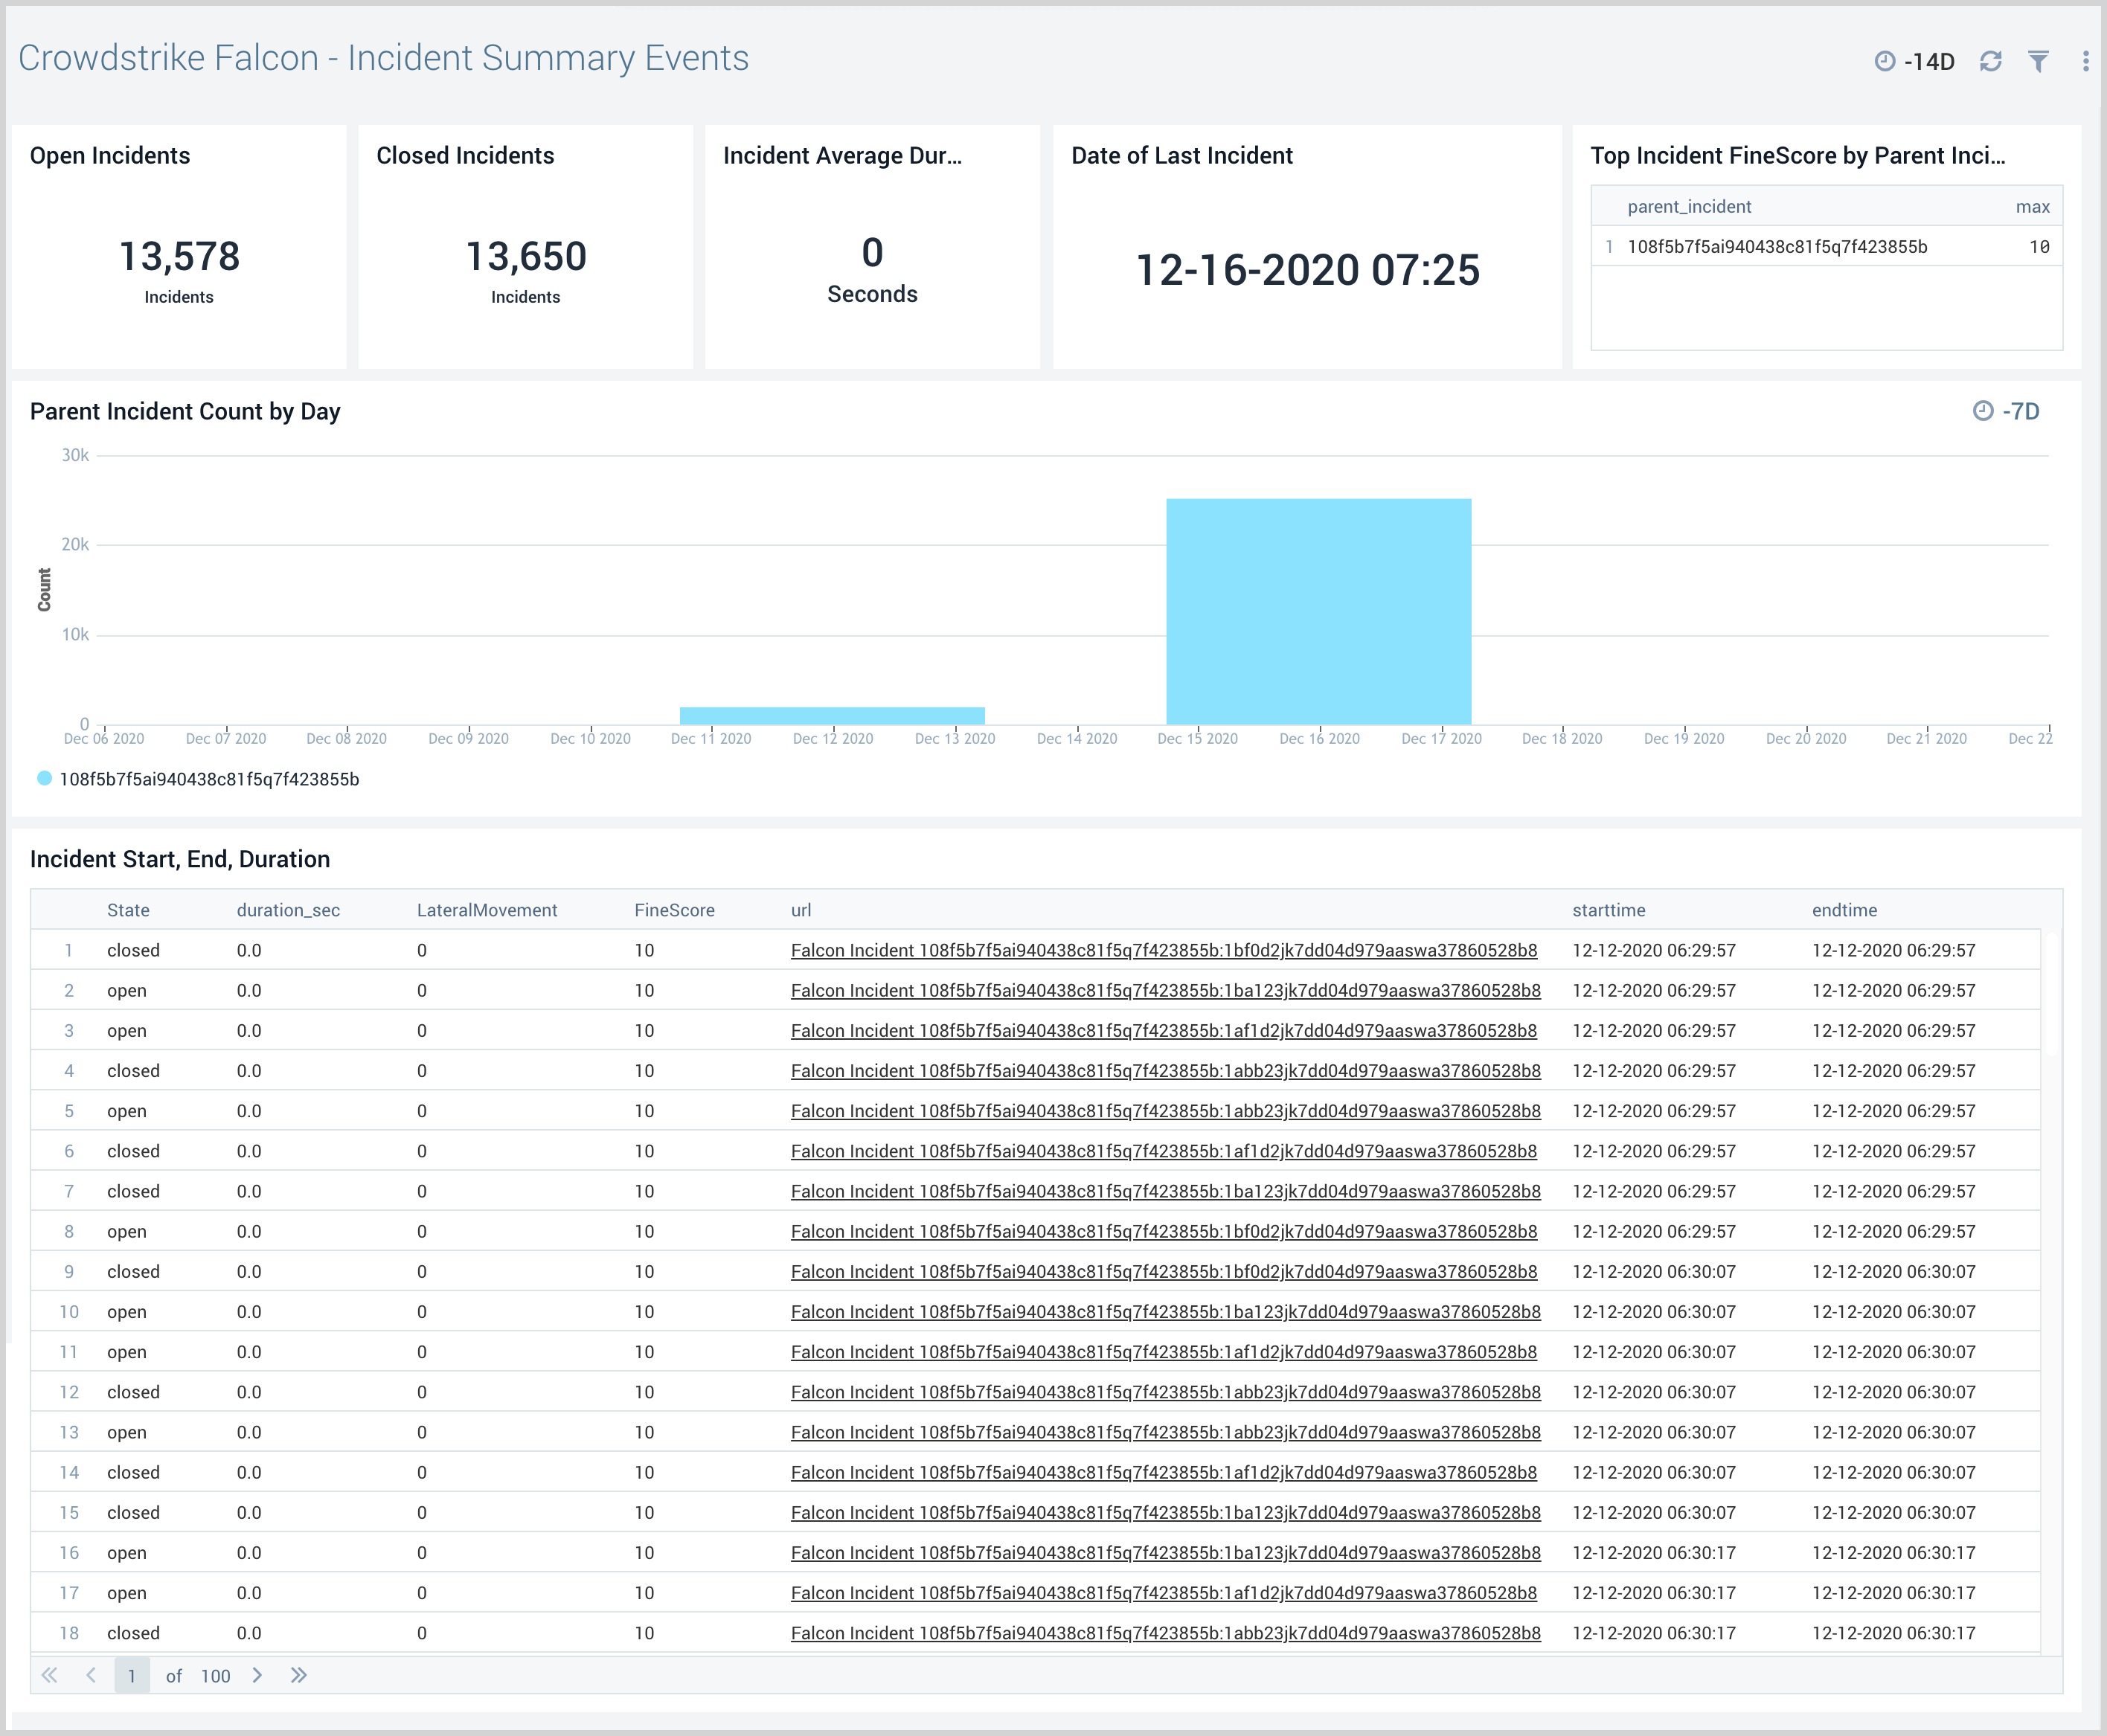
Incident Summary Events
30
The CrowdStrike - Falcon - Incident Summary Events dashboard provides visibility into Falcon incidents, event trends, and risk.
Use this dashboard to:
- Get an overview of incidents created and their risk.
- Identify unexpected events related to incidents by examining trends.
- Drill-down to the details of an incident using pre-built links in the CrowdStrike Falcon Console.