Imperva Incapsula

Imperva Incapsula is a cloud-based application delivery service that includes web security, DDoS protection, CDN, and load balancing.
The Sumo Logic app for Imperva Incapsula - Web Application Firewall (WAF) helps you monitor your web application protection service. The preconfigured dashboards provide insights on the threat alerts events.
Log Types
The Imperva Incapsula - Web Application Firewall App uses security and access logs. For more details, see here.
Sample Queries
| parse "fileId=* " as ID nodrop
| parse "src=* " as main_client_ip nodrop
| parse "caIP=* " as additional_client_ip nodrop
| parse "requestClientApplication=* cs2" as user_agent nodrop
| parse "request=* " as URL nodrop
| parse "tag=* " as ref_id nodrop
| parse "ccode=* " as country_code nodrop
| parse "cicode=* " as City nodrop
| parse "ccode=[*] " as country_code nodrop
| parse "app=* " as Protocol nodrop
| parse "deviceExternalId=* " as request_id nodrop
| parse "ref=* " as Referrer nodrop
| parse "requestMethod=* " as Method nodrop
| parse "cn1=* " as http_status_code nodrop
| parse "xff=* " as X_Forwarded_For nodrop
| parse "in=* " as content_length nodrop
| parse "suid=* " as account_id nodrop
| parse "Customer=* " as account_name nodrop
| parse "siteid=* " as site_id nodrop
| parse "sourceServiceName=* " as site_name nodrop
| parse "act=* " as request_result nodrop
| parse "postbody=* " as post_body nodrop
| parse "start=* " as request_start_time nodrop
| parse "sip=* " as server_ip nodrop
| parse "spt=* " as server_port nodrop
| parse "qstr=* " as query_string nodrop
| parse "cs1=* " as captcha_support nodrop
| parse "cs2=* cs2" as js_support nodrop
| parse "cs3=* cs3" as cookies_support nodrop
| parse "cs4=* cs4" as visitor_id nodrop
| parse "cs5=* cs5" as Debug nodrop
| parse "cs6=* cs6" as client_app
| parse "cs7=* cs7" as Latitude nodrop
| parse "cs8=* cs8" as Longitude nodrop
| parse "cs9=* cs9" as rule_name nodrop
| parse "filePermission=* " as attack_id nodrop
| parse "fileType=* " as attack_type nodrop
| parse "dproc=* cs6" as browser_type nodrop
_sourceCategory="Incapsula"
| parse "SIEMintegration|1|1|*|" as policy_type
| parse "sourceServiceName=* " as site_name
| count by policy_type
| top 10 policy_type by _count
Collecting Logs for the Imperva-Incapsula WAF App
This section provides instructions on configuring log collection for the Imperva - Incapsula Web Application Firewall App, as well as query samples.
Set up log integration in Imperva Incapsula
To configure log integration, do the following:
- Log into your my.incapsula.com account.
- On the sidebar, click Logs > Log Setup.
- Connection. Select Amazon S3.
- Next, fill in your credentials:
- Your S3 Access key, Secret key, and Path, where path is the location of the folder where you want to store the logs. Enter the path in the following format:
<Amazon S3 bucket name>/<log folder>. For example: MyBucket/MyIncapsulaLogFolder. - Click Test connection to perform a full testing cycle in which a test file will be transferred to your designated folder. The test file does not contain real data, and will be removed by Incapsula when the transfer is complete.
- Your S3 Access key, Secret key, and Path, where path is the location of the folder where you want to store the logs. Enter the path in the following format:
- Configure the additional options:
- Format. Select the format for the log files: CEF
- Compress logs. By default, log files are compressed. Clear this option to keep the logs uncompressed.
For detailed instructions, see here.
Set up in Sumo Logic
To configure log collection for Sumo Logic, do the following:
- Add a Sumo Logic Hosted Collector
- Configure AWS S3 Source.
Installing the Imperva-Incapsula WAF App
Now that you have set up collection for Imperva Incapsula - Web Application Firewall, install the Sumo Logic App to use the pre-configured searches and dashboards that provide visibility into your environment for real-time analysis of overall usage.
To install the app:
Locate and install the app you need from the App Catalog. If you want to see a preview of the dashboards included with the app before installing, click Preview Dashboards.
- From the App Catalog, search for and select the app.
- Select the version of the service you're using and click Add to Library. Version selection is applicable only to a few apps currently. For more information, see Installing the Apps from the Library.
- To install the app, complete the following fields.
- App Name. You can retain the existing name, or enter a name of your choice for the app.
- Data Source. Select either of these options for the data source.
- Choose Source Category, and select a source category from the list.
- Choose Enter a Custom Data Filter, and enter a custom source category beginning with an underscore. Example: (
_sourceCategory=MyCategory).
- Advanced. Select the Location in Library (the default is the Personal folder in the library), or click New Folder to add a new folder.
- Click Add to Library.
Once an app is installed, it will appear in your Personal folder, or other folder that you specified. From here, you can share it with your organization.
Panels will start to fill automatically. It's important to note that each panel slowly fills with data matching the time range query and received since the panel was created. Results won't immediately be available, but with a bit of time, you'll see full graphs and maps.
Viewing Imperva-Incapsula WAF Dashboards
WAF - Overview
See the overview of your WAF service including the source IP address, client app, user agent, country, ADR rules, and policy type.
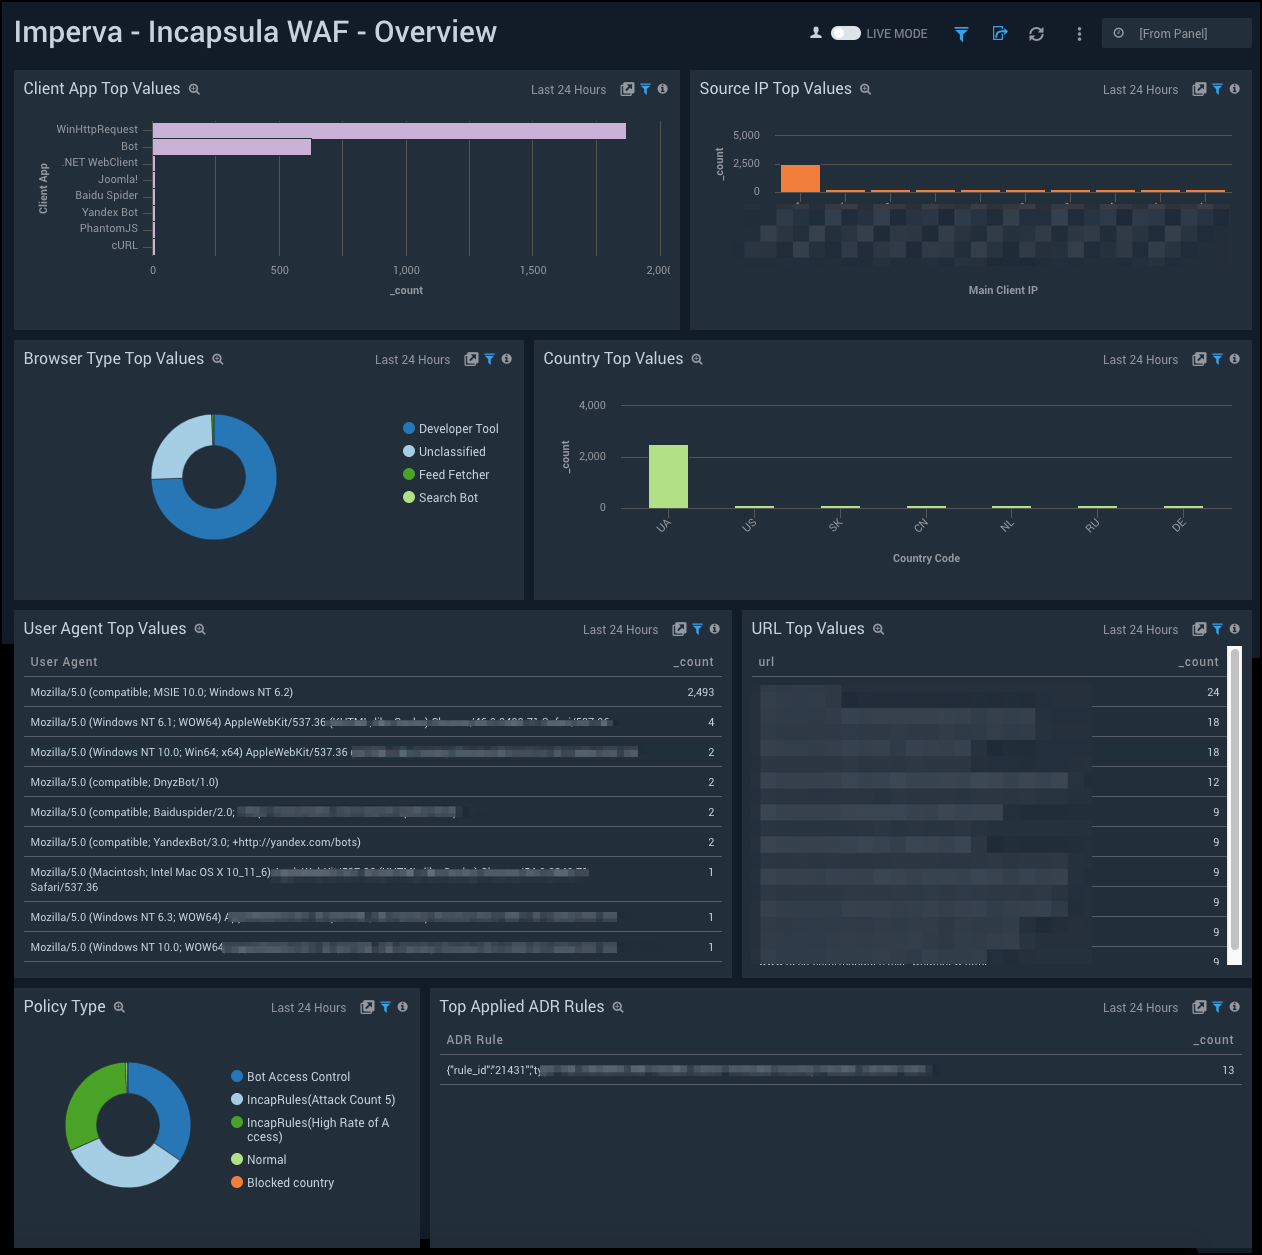
Client App Top Values. See the top 10 client apps by count in the last 14 days on a bar chart.
Source IP Top Values. See the top 10 source IP addresses by count in the last 14 days on a column chart.
Browser Type Top Values. See the top 10 browser types by count in the last 14 days on a pie chart.
Country Top Values. See the top 10 countries by count in the last 14 days on a column chart.
User Agent Top Values. See the top 10 user agents by count in the last 14 days displayed in a table.
URL Top Values. See the top 10 URLs by count in the last 14 days displayed in a table.
Policy Type. See the count and percentage of policy types in the last 14 days on a pie chart.
Top Applied ADR Rules. See the top 10 applied ADR rules by count in the last 14 days displayed in a table.
WAF - Blocked Countries
See the details of blocked countries in your WAF service including the source IP address, browser type, top countries, and user agent.
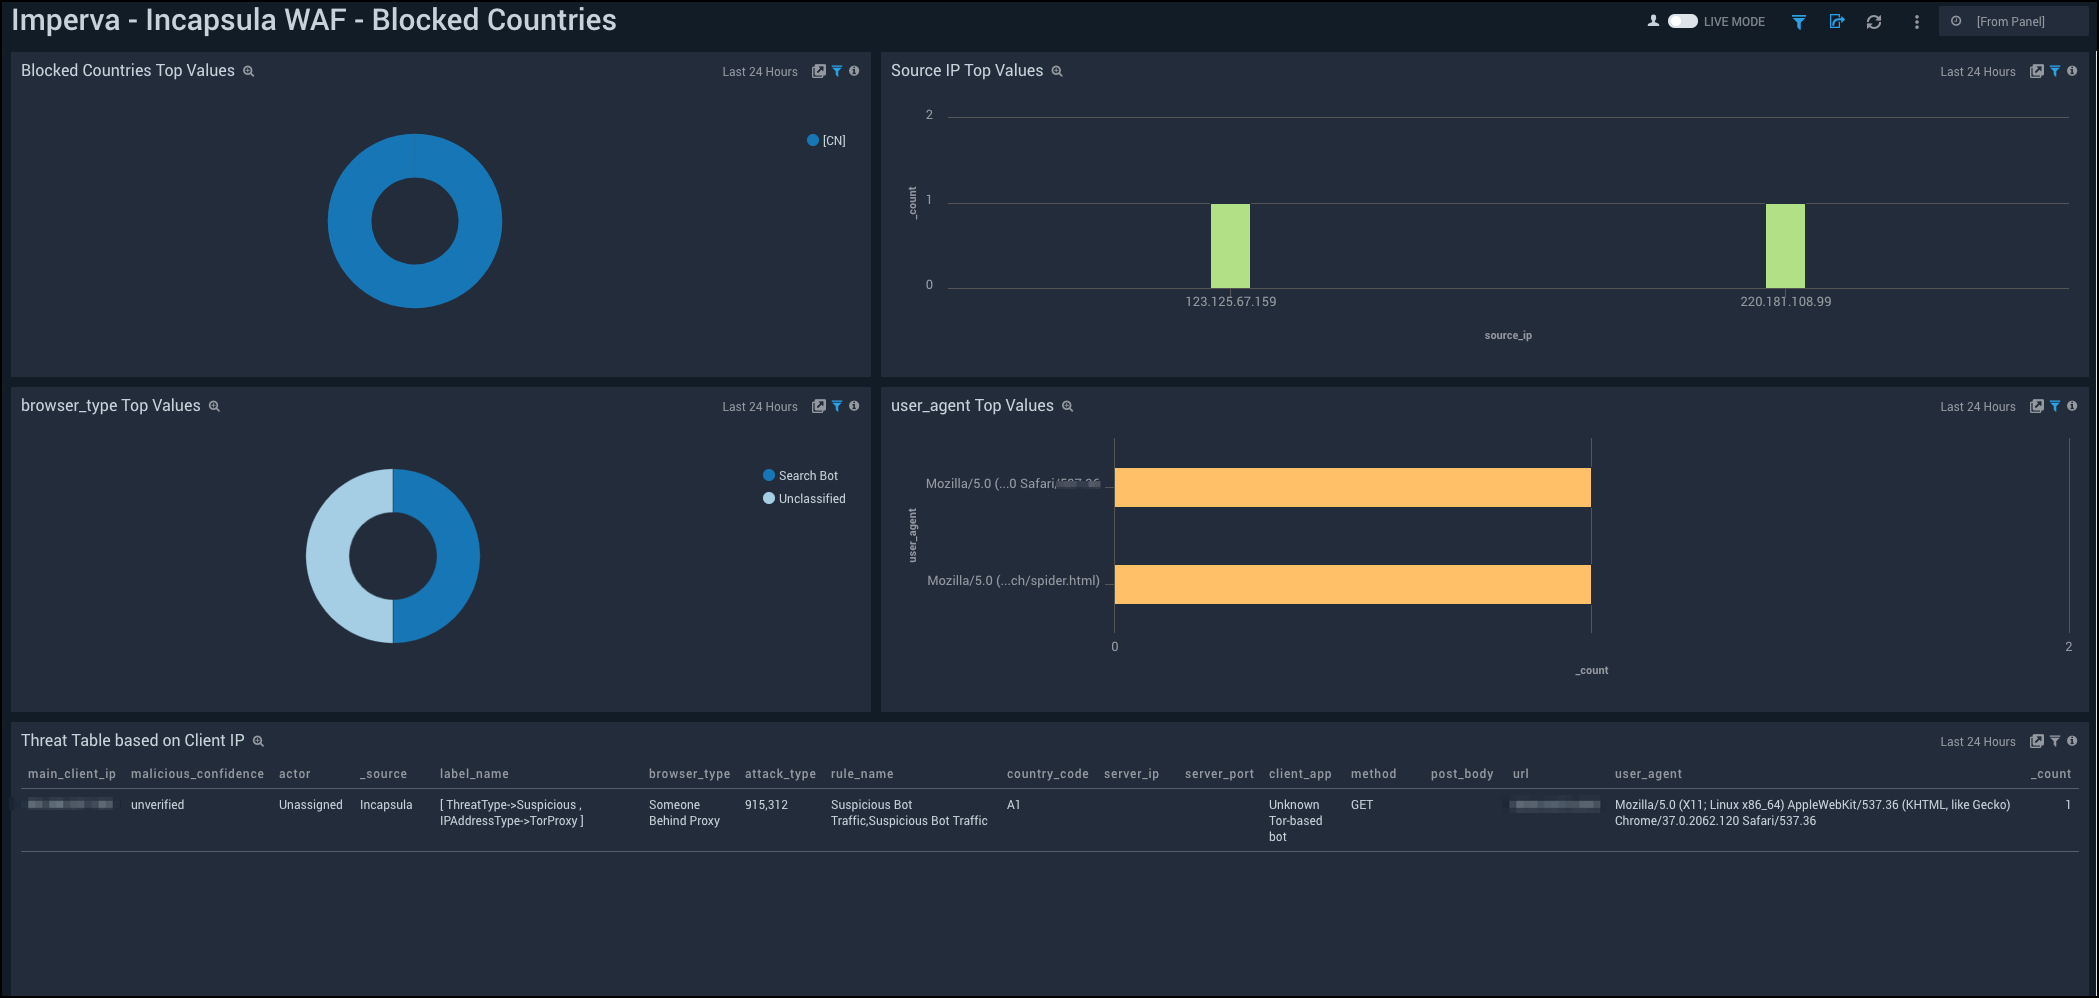
Blocked Countries Top Values. See the top 10 blocked countries by count in the last 14 days on a pie chart.
Source IP Top Values. See the top 10 source IP addresses by count in the last 14 days on a column chart.
Browser Type Top Values. See the top 10 browser types by count in the last 14 days on a pie chart.
User Agent Top Values. See the top 10 user agents by count in the last 14 days displayed in a table.
Threat Table based on Client IP. See the details of threats in the last 24 hours based on client IP address including the main client IP address, malicious confidence, actor, source, label name, browser type, attack type, rule name, country code, server IP, server port , client app, method, post body, URL, user agent, and count, displayed in a table.
WAF BOT - Access Control
See the details of BOT access control in your WAF service including the city, country, browser type, source IP address, and user agent.
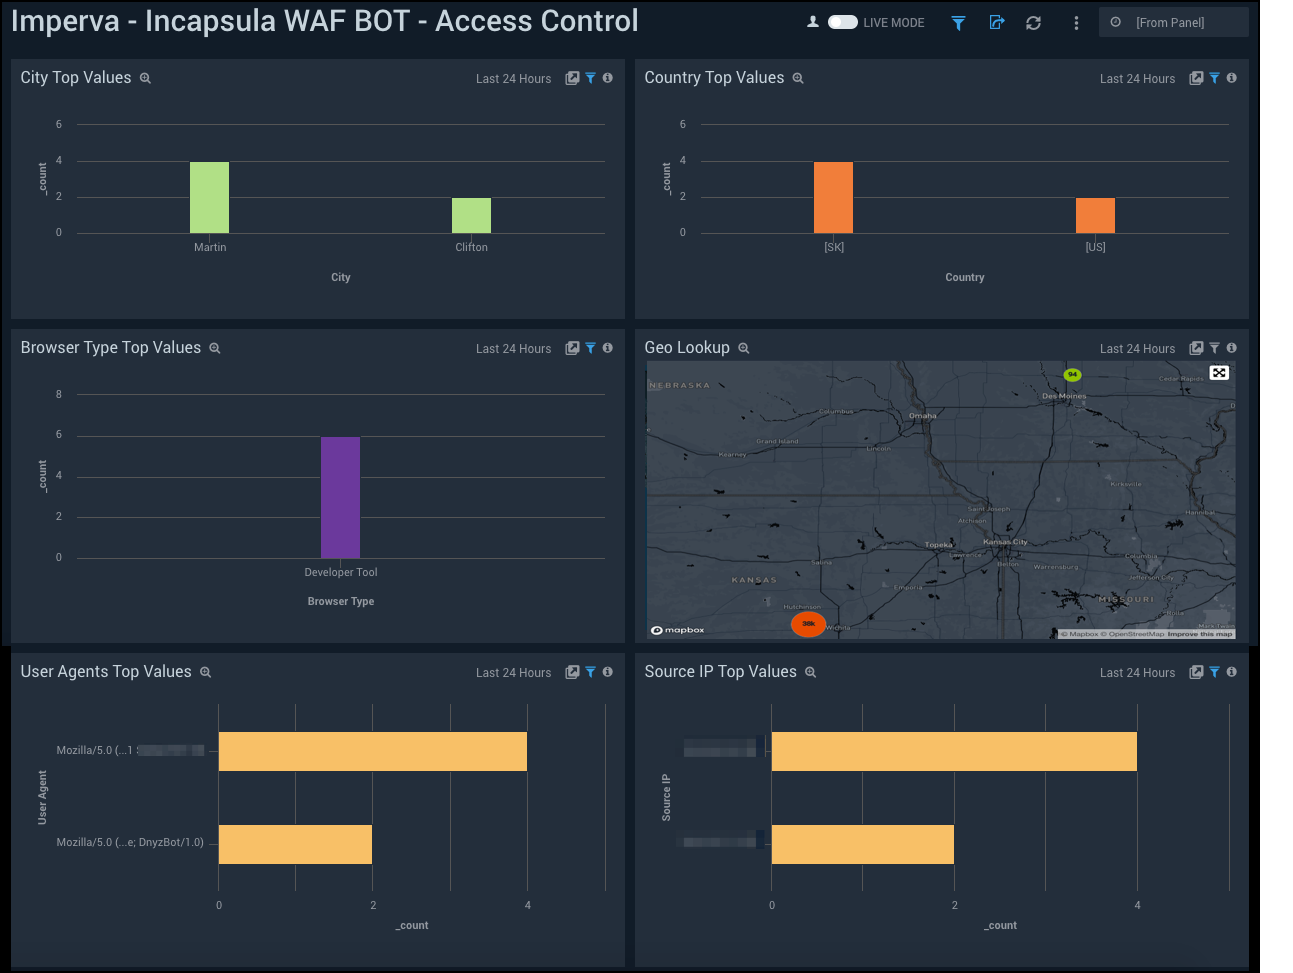
City Top Values. See the top 10 cities by count in the last 14 days on a column chart.
Country Top Values. See the top 10 countries by count in the last 14 days on a column chart.
Browser Type Top Values. See the top 10 browser types by count in the last 14 days on a column chart.
Geo Lookup. See the count and location of BOT access controls in the last 14 days on a world map.
User Agents Top Values. See the top 10 user agents by count in the last 14 days on a bar chart.
Source IP Top Values. See the top 10 source IP addresses by count in the last 14 days on a bar chart.