Zscaler Internet Access

The Sumo Logic App for Zscaler Internet Access (ZIA) collects logs via Cloud Nanolog Streaming Service (NSS) to populate pre-configured searches and Dashboards in order to visualize and provide insight into threats, DNS, web traffic behaviors, security, user browsing activities, and risk.
Log Types
The Sumo Logic App for Zscaler uses NSS feed output logs (Web, Tunnel, DNS, Firewall), as documented here.
Collect Logs for the Zscaler Internet Access App
Zscaler uses Cloud Nanolog Streaming Service (NSS), which allows direct cloud-to-cloud log streaming for all types of ZIA logs into Sumo Logic.
To collect logs for Zscaler, perform these steps, detailed in the following sections:
Step 1: Configure Sumo Logic Hosted Collector and an HTTP Source
To collect logs for Zscaler Web Security, do the following in Sumo Logic:
- Configure an Hosted Collector.
- Configure an Http Source.
- For Source Category, enter any string to tag the output collected from this Source, such as ZIA.
- Click Save and make note of the HTTP address for the Source. You will need it when you configure the Zscaler Cloud NSS in the next section.
Step 2: Configure Zscaler Cloud NSS
Zscaler uses Cloud Nanolog Streaming Service (NSS), which allows direct cloud-to-cloud log streaming for all types of ZIA logs into Sumo Logic.
To send logs to Sumo Logic using Cloud NSS, add a feed in ZIA using the following steps.
- Log into your Zscaler Internet Access system.
- Go to Administration -> Nanolog Streaming Service -> Cloud NSS Feeds.
Cloud NSS is not enabled by default in ZIA. If you do not see Cloud NSS Feeds option in your ZIA environment, create a support request with Zscaler support.
- From the Cloud NSS Feeds tab, click Add Cloud NSS Feed.
- In the Add NSS Feed dialog:
- Feed Name. Enter a name for your NSS feed.
- NSS Server. Select NSS for Web.
- Status. Enabled.
- SIEM Type.Select Sumo Logic.
- API URL. Paste the HTTP address for the Source generated in the previous section.
- HTTP Headers. No Headers are required for Sumo Logic. If it requires at least one Header, add a dummy Header:
- Log Type. Select Web Log.
- Feed Output Type. Select JSON.
- Feed Escape Character. Leave this field blank.
- Feed Output Format. The JSON format is displayed.
- User Obfuscation. Select Disabled.
- Timezone. Set to GMT by default.
- Web Log Filters. Choose filters you would like to have.
- Click Save.
- Repeat above steps for:
- NSS Type: NSS for Web and Log Type: Tunnel.
- NSS Type: NSS for Web and Log Type: SaaS Security.
- NSS Type: NSS for FireWall and Log Type: Firewall Logs.
- NSS Type: NSS for FireWall and Log Type: DNS Logs.
Note: Sumo Logic Dashboards utilize Web, Tunnel, DNS Logs.
(Optional) Configure the Zscaler NSS Feeds
If you are not able to use Zscaler Cloud NSS, you can collect logs for the ZIA App using NSS Servers. For DNS, Firewall, and Tunnel logs you can select JSON as the output format for the feed in the Add NSS Feeds dialog. For Web logs you will need to configure the feed as follows:
Log into your Zscaler NSS system.
Go to Administration > Settings > Nanolog Streaming Service.
From the NSS Feeds tab, click Add.
In the Add NSS Feed dialog: \
- Feed Name. Enter a name for your NSS feed.
- NSS Server. Select the NSS Server.
- SIEM IP Address. Enter the Sumo Logic Installed Collector IP address.
- Log Type. Select Web Log.
- Feed Output Type. Custom.
- NSS Type. NSS for Web is the default.
- Status. Select Enabled.
- SIEM TCP Port. Enter the Sumo Logic Syslog Source TCP port number.
- Feed Escape Character. Leave this field blank.
- Feed Output Format. Select Custom and paste the following:
\{ "sourcetype" : "zscalernss-web", "event" : \{"datetime":"%d{yy}-%02d{mth}-%02d{dd} %02d{hh}:%02d{mm}:%02d{ss}","reason":"%s{reason}","event_id":"%d{recordid}","protocol":"%s{proto}","action":"%s{action}","transactionsize":"%d{totalsize}","responsesize":"%d{respsize}","requestsize":"%d{reqsize}","urlcategory":"%s{urlcat}","serverip":"%s{sip}","clienttranstime":"%d{ctime}","requestmethod":"%s{reqmethod}","refererURL":"%s{ereferer}","useragent":"%s{ua}","product":"NSS","location":"%s{location}","ClientIP":"%s{cip}","status":"%s{respcode}","user":"%s{login}","url":"%s{eurl}","vendor":"Zscaler","hostname":"%s{ehost}","clientpublicIP":"%s{cintip}","threatcategory":"%s{malwarecat}","threatname":"%s{threatname}","filetype":"%s{filetype}","appname":"%s{appname}","pagerisk":"%d{riskscore}","department":"%s{dept}","urlsupercategory":"%s{urlsupercat}","appclass":"%s{appclass}","dlpengine":"%s{dlpeng}","urlclass":"%s{urlclass}","threatclass":"%s{malwareclass}","dlpdictionaries":"%s{dlpdict}","fileclass":"%s{fileclass}","bwthrottle":"%s{bwthrottle}","servertranstime":"%d{stime}","contenttype":"%s{contenttype}","unscannabletype":"%s{unscannabletype}","deviceowner":"%s{deviceowner}","devicehostname":"%s{devicehostname}"\}\}
- Duplicate Logs. Disabled by default.
- Timezone. Set to GMT by default.
- Click Save.
Sample Log Message
{
  "sourcetype": "zscalernss-web",
  "event": {
    "datetime": "2021-06-17 14:53:16",
    "reason": "Allowed",
    "event_id": "6974776045860487177",
    "protocol": "HTTP_PROXY",
    "action": "Allowed",
    "transactionsize": "639",
    "responsesize": "65",
    "requestsize": "574",
    "urlcategory": "Corporate Marketing",
    "serverip": "104.21.31.16",
    "clienttranstime": "0",
    "requestmethod": "CONNECT",
    "refererURL": "None",
    "useragent": "Windows Microsoft Windows 10 Pro ZTunnel/1.0",
    "product": "NSS",
    "location": "Road Warrior",
    "ClientIP": "40.83.138.250",
    "status": "200",
    "user": "testuser2@bd-dev.com",
    "url": "hamsan.yektanet.com:443",
    "vendor": "Zscaler",
    "hostname": "hamsan.yektanet.com",
    "clientpublicIP": "40.83.138.250",
    "threatcategory": "None",
    "threatname": "None",
    "filetype": "None",
    "appname": "General Browsing",
    "pagerisk": "0",
    "department": "Service Admin",
    "urlsupercategory": "Business and Economy",
    "appclass": "General Browsing",
    "dlpengine": "None",
    "urlclass": "Business Use",
    "threatclass": "None",
    "dlpdictionaries": "None",
    "fileclass": "None",
    "bwthrottle": "NO",
    "servertranstime": "0",
    "contenttype": "Other",
    "unscannabletype": "None",
    "odeviceowner": "5864177",
    "odevicehostname": "4051327232"
  }
}
Query Sample
_sourceCategory=ZIA
| json field=_raw "event.clientpublicIP", "event.user", "event.url", "event.action" as src_ip, src_user, url, action
| where action != "Allowed"
| parse regex field=url "(?<baseurl>.+?)[:/]" nodrop
| count by baseurl
| sort _count
| top 10 baseurl by _count
Install the Zscaler Internet Access App
This section provides instructions on how to install the Zscaler Internet Access App, and provides examples of each of the dashboards. The App preconfigured searches and Dashboards provide easy-to-access visual insights into your data.
To install the app, do the following:
Locate and install the app you need from the App Catalog. If you want to see a preview of the dashboards included with the app before installing, click Preview Dashboards.
- From the App Catalog, search for and select the app.
- Select the version of the service you're using and click Add to Library.
Version selection is applicable only to a few apps currently. For more information, see Installing the Apps from the Library.
- To install the app, complete the following fields.
- App Name. You can retain the existing name, or enter a name of your choice for the app.
- Data Source. Select either of these options for the data source.
- Choose Source Category, and select a source category from the list.
- Choose Enter a Custom Data Filter, and enter a custom source category beginning with an underscore. Example: (
_sourceCategory=MyCategory).
- Advanced. Select the Location in Library (the default is the Personal folder in the library), or click New Folder to add a new folder.
- Click Add to Library.
Once an app is installed, it will appear in your Personal folder, or other folder that you specified. From here, you can share it with your organization.
Panels will start to fill automatically. It's important to note that each panel slowly fills with data matching the time range query and received since the panel was created. Results won't immediately be available, but with a bit of time, you'll see full graphs and maps.
Viewing ZIA Dashboards
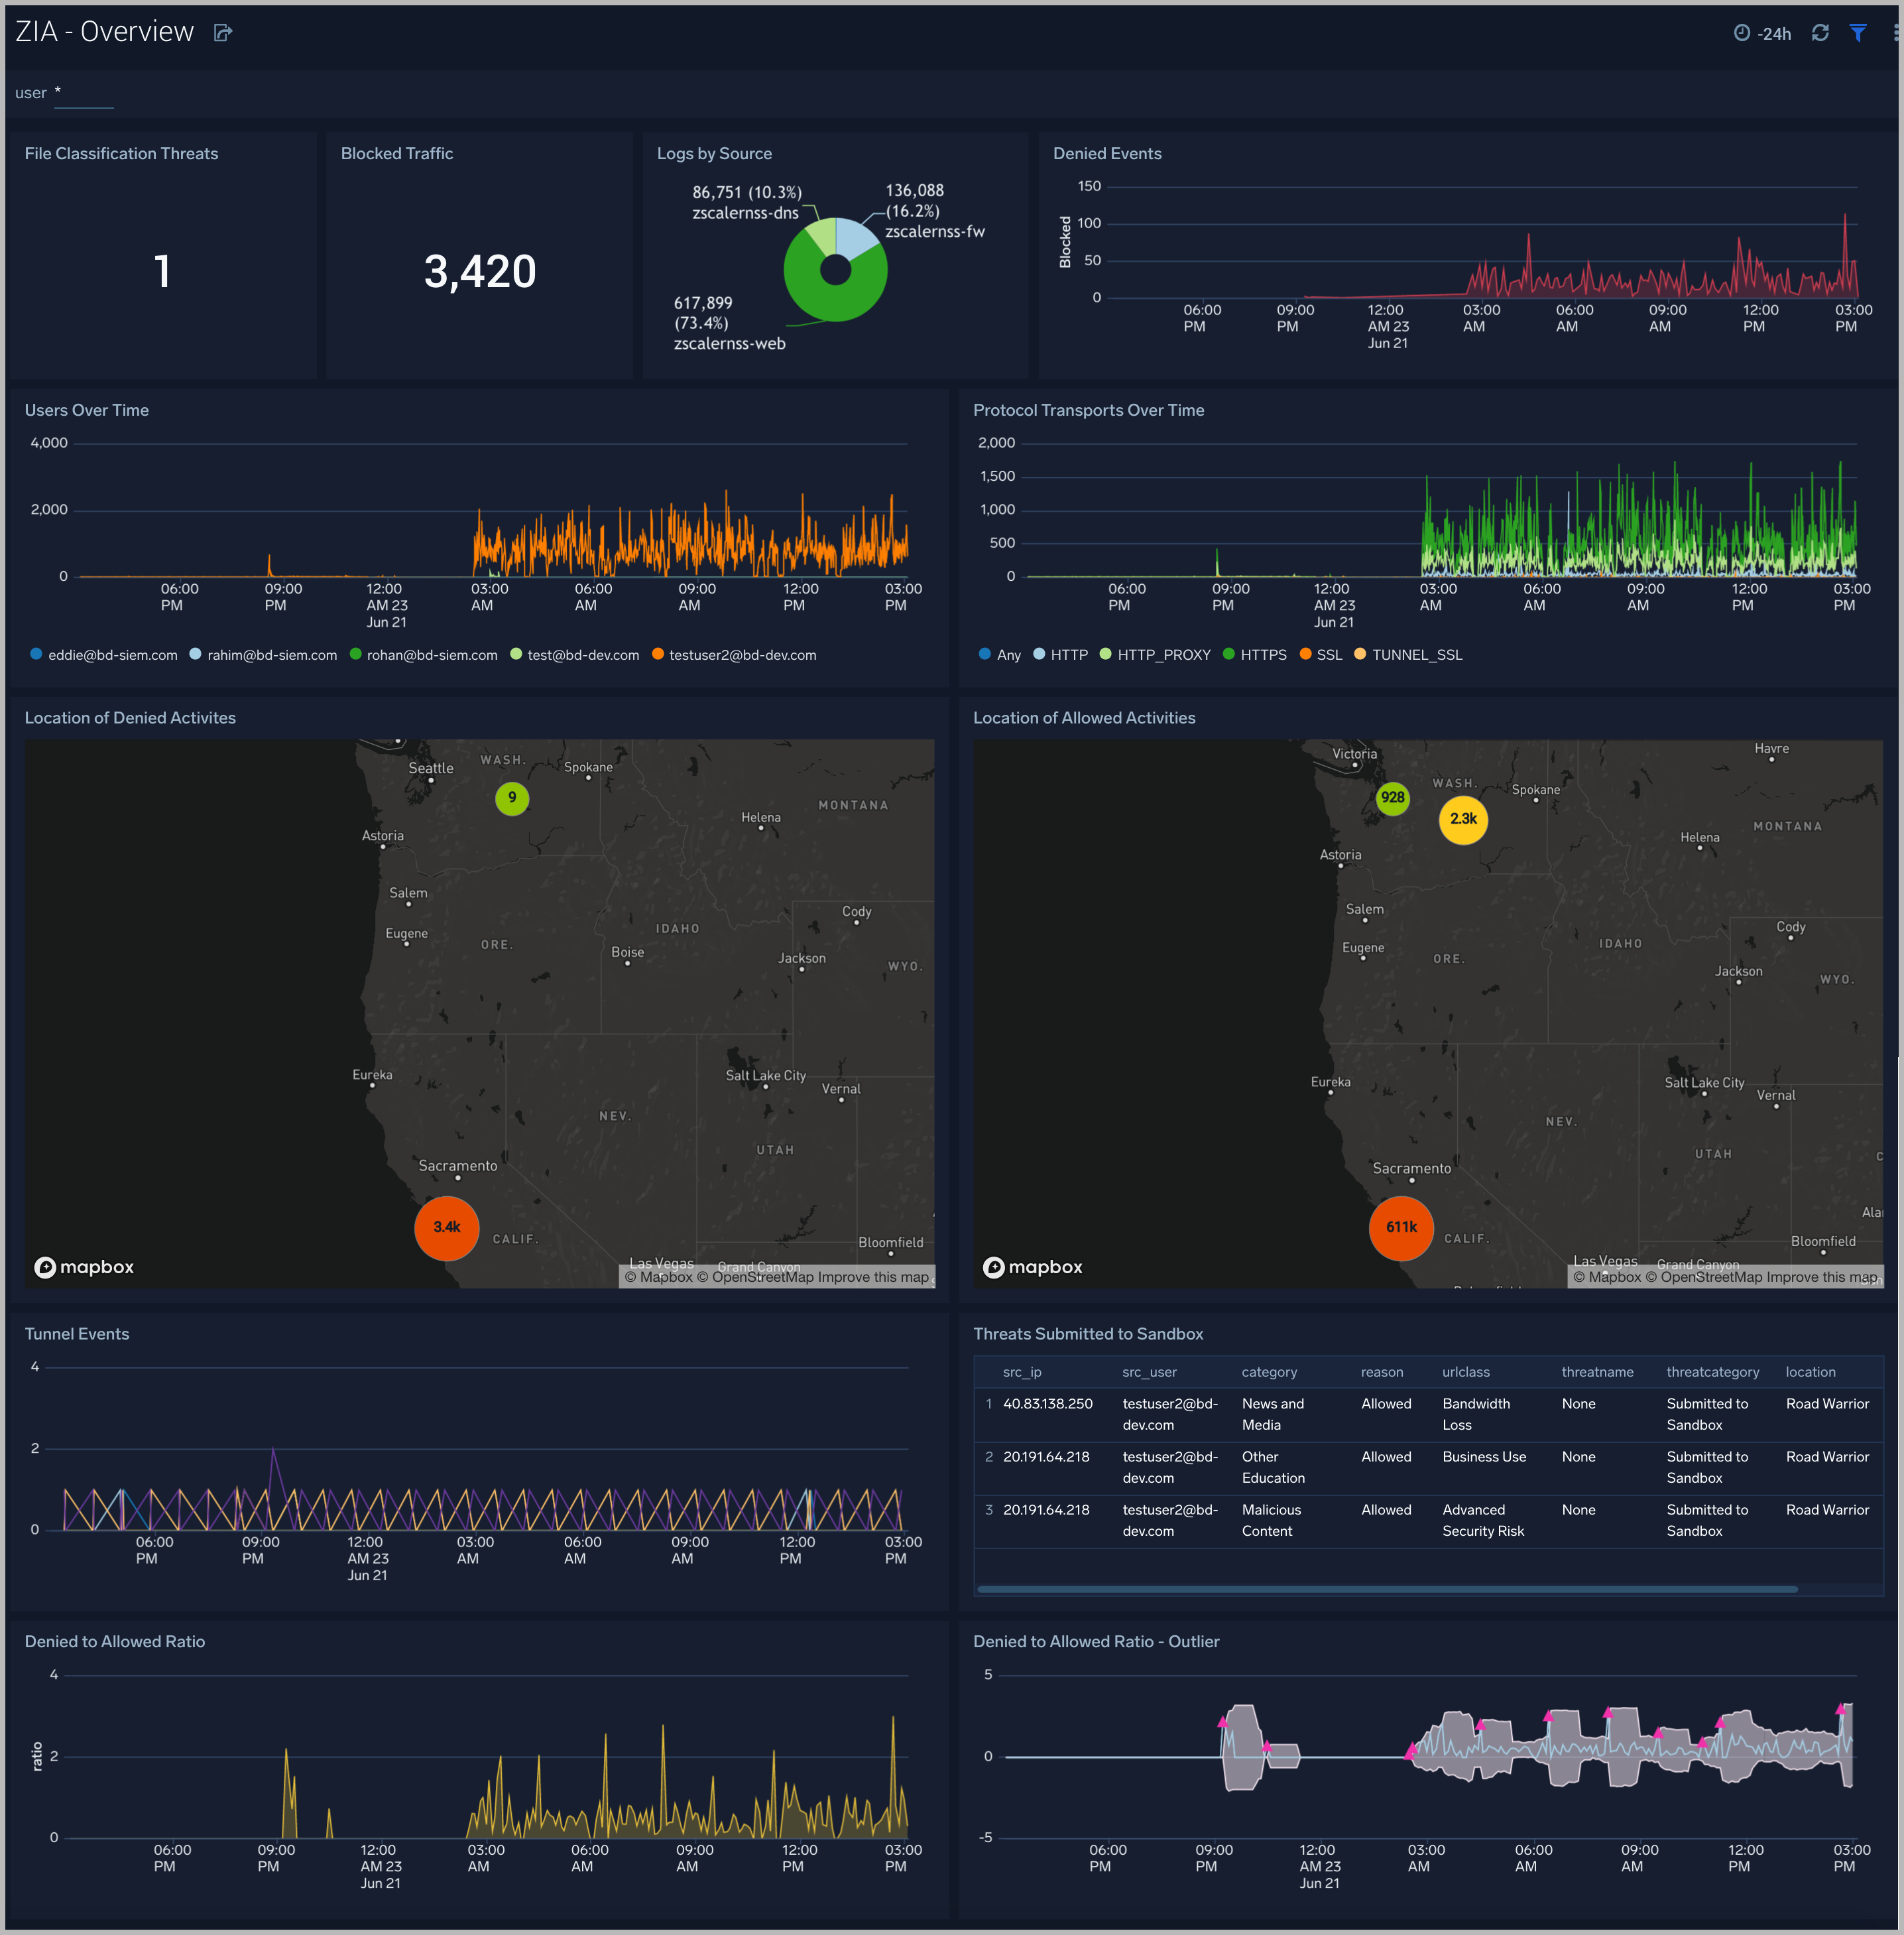
Zscaler - Overview
The Zscaler - Overview Dashboard provides general information of the Zscaler Web Gateway logs, including Panels that drill-down into the other Zscaler Dashboards. The Overview Dashboard gives a good starting point for detecting anomalies in blocked traffic and geographic hotspots for allowed and blocked traffic.
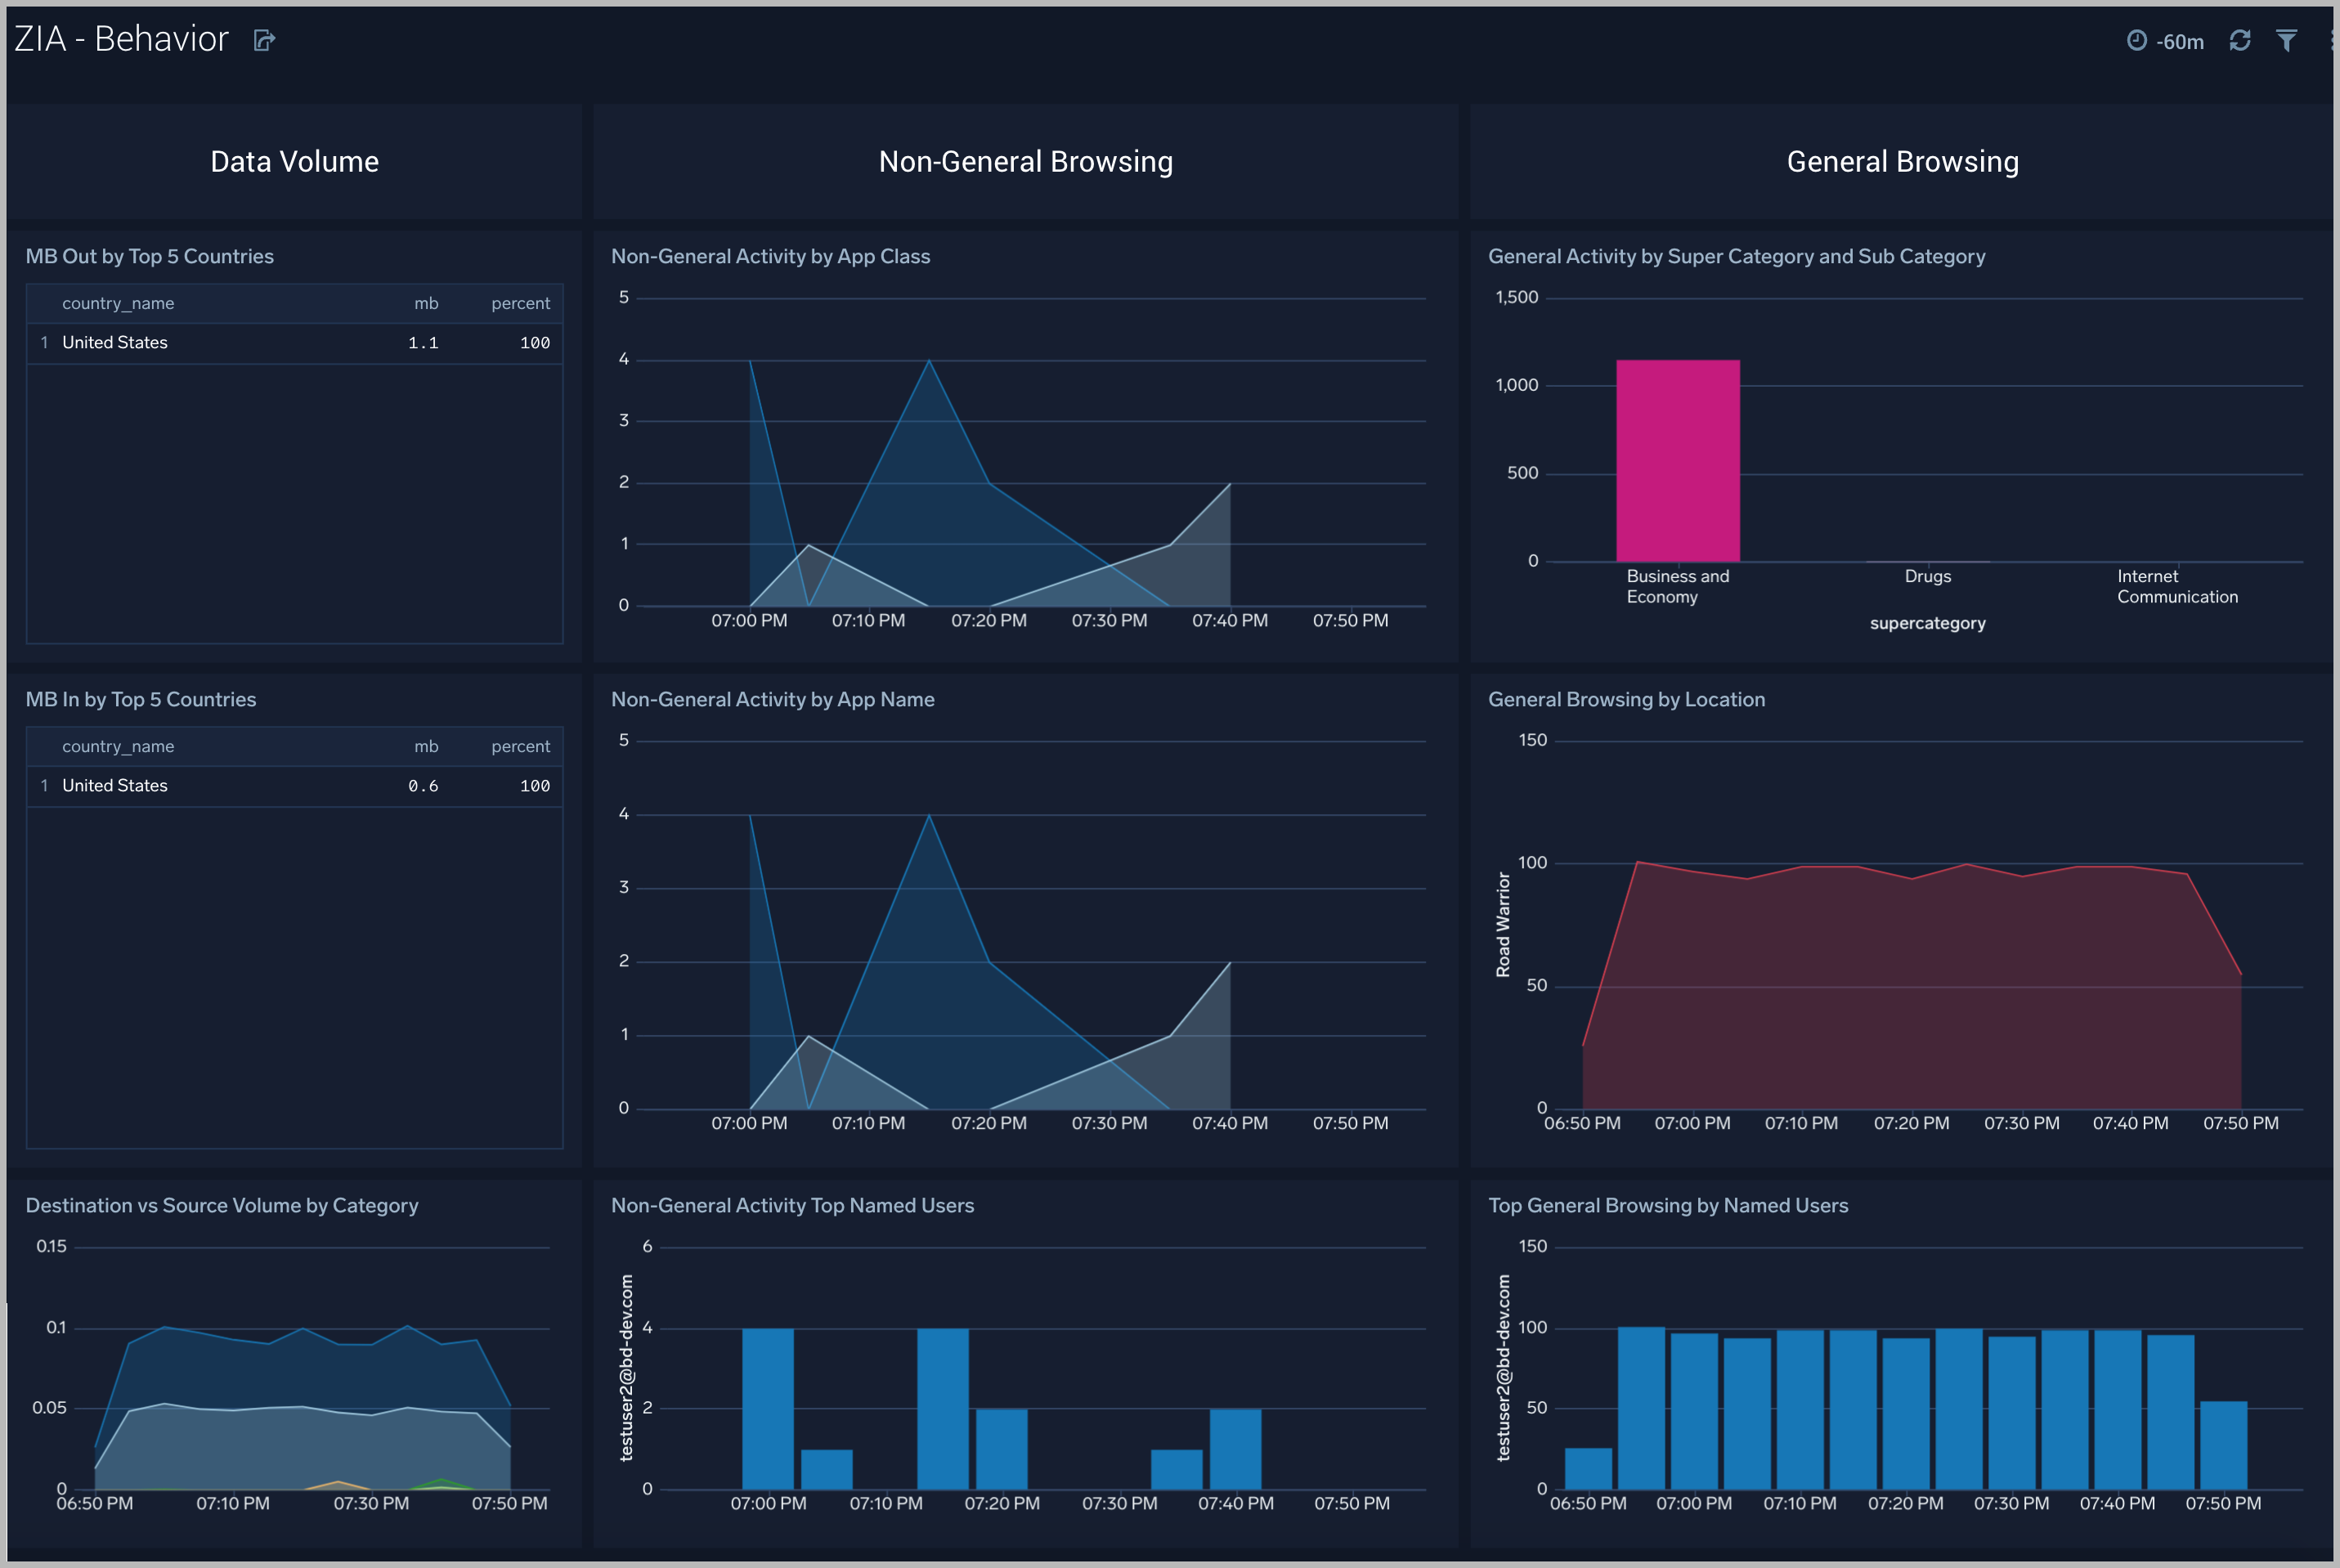
Zscaler- Behavior
The Zscaler - Behavior Dashboard focuses on allowed traffic behaviors, showing trends and deviations by users, content types accessed, content categories, super categories, and bandwidth trends.
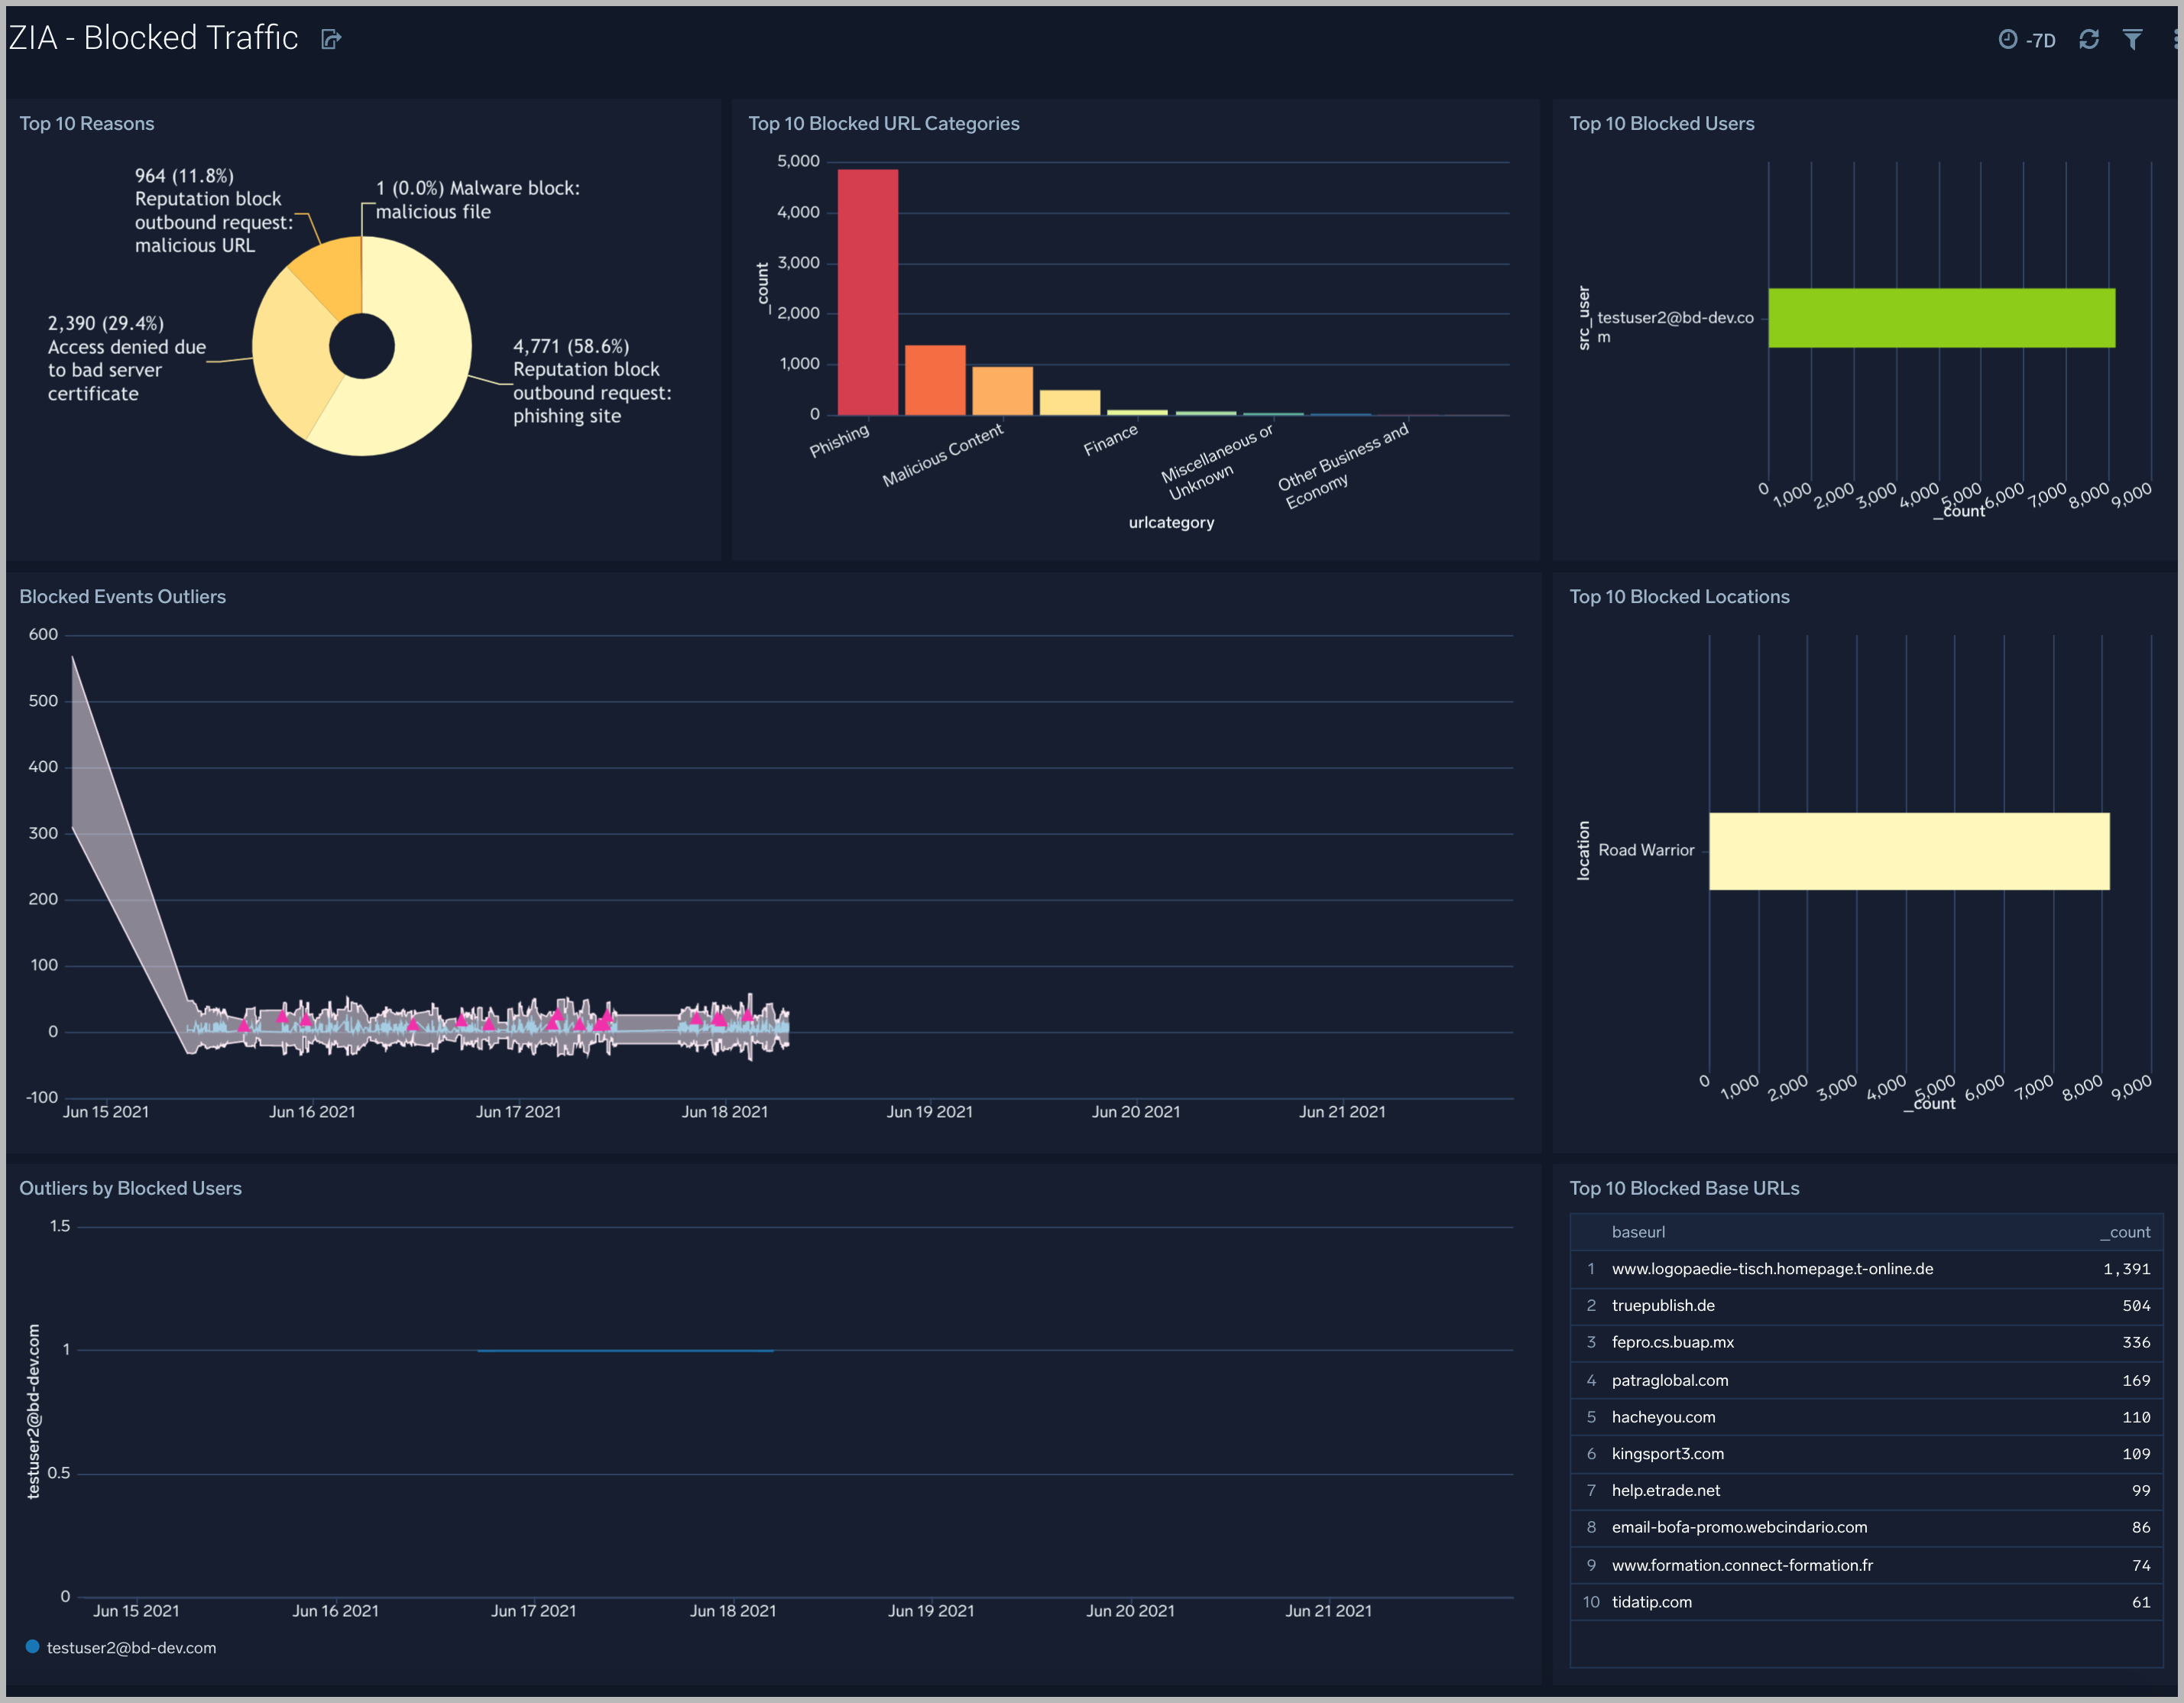
Zscaler - Blocked Traffic
The Zscaler - Blocked Traffic Dashboard illustrates outliers in both blocked traffic peaks and multi-dimensional outliers for blocked activity specific to user.
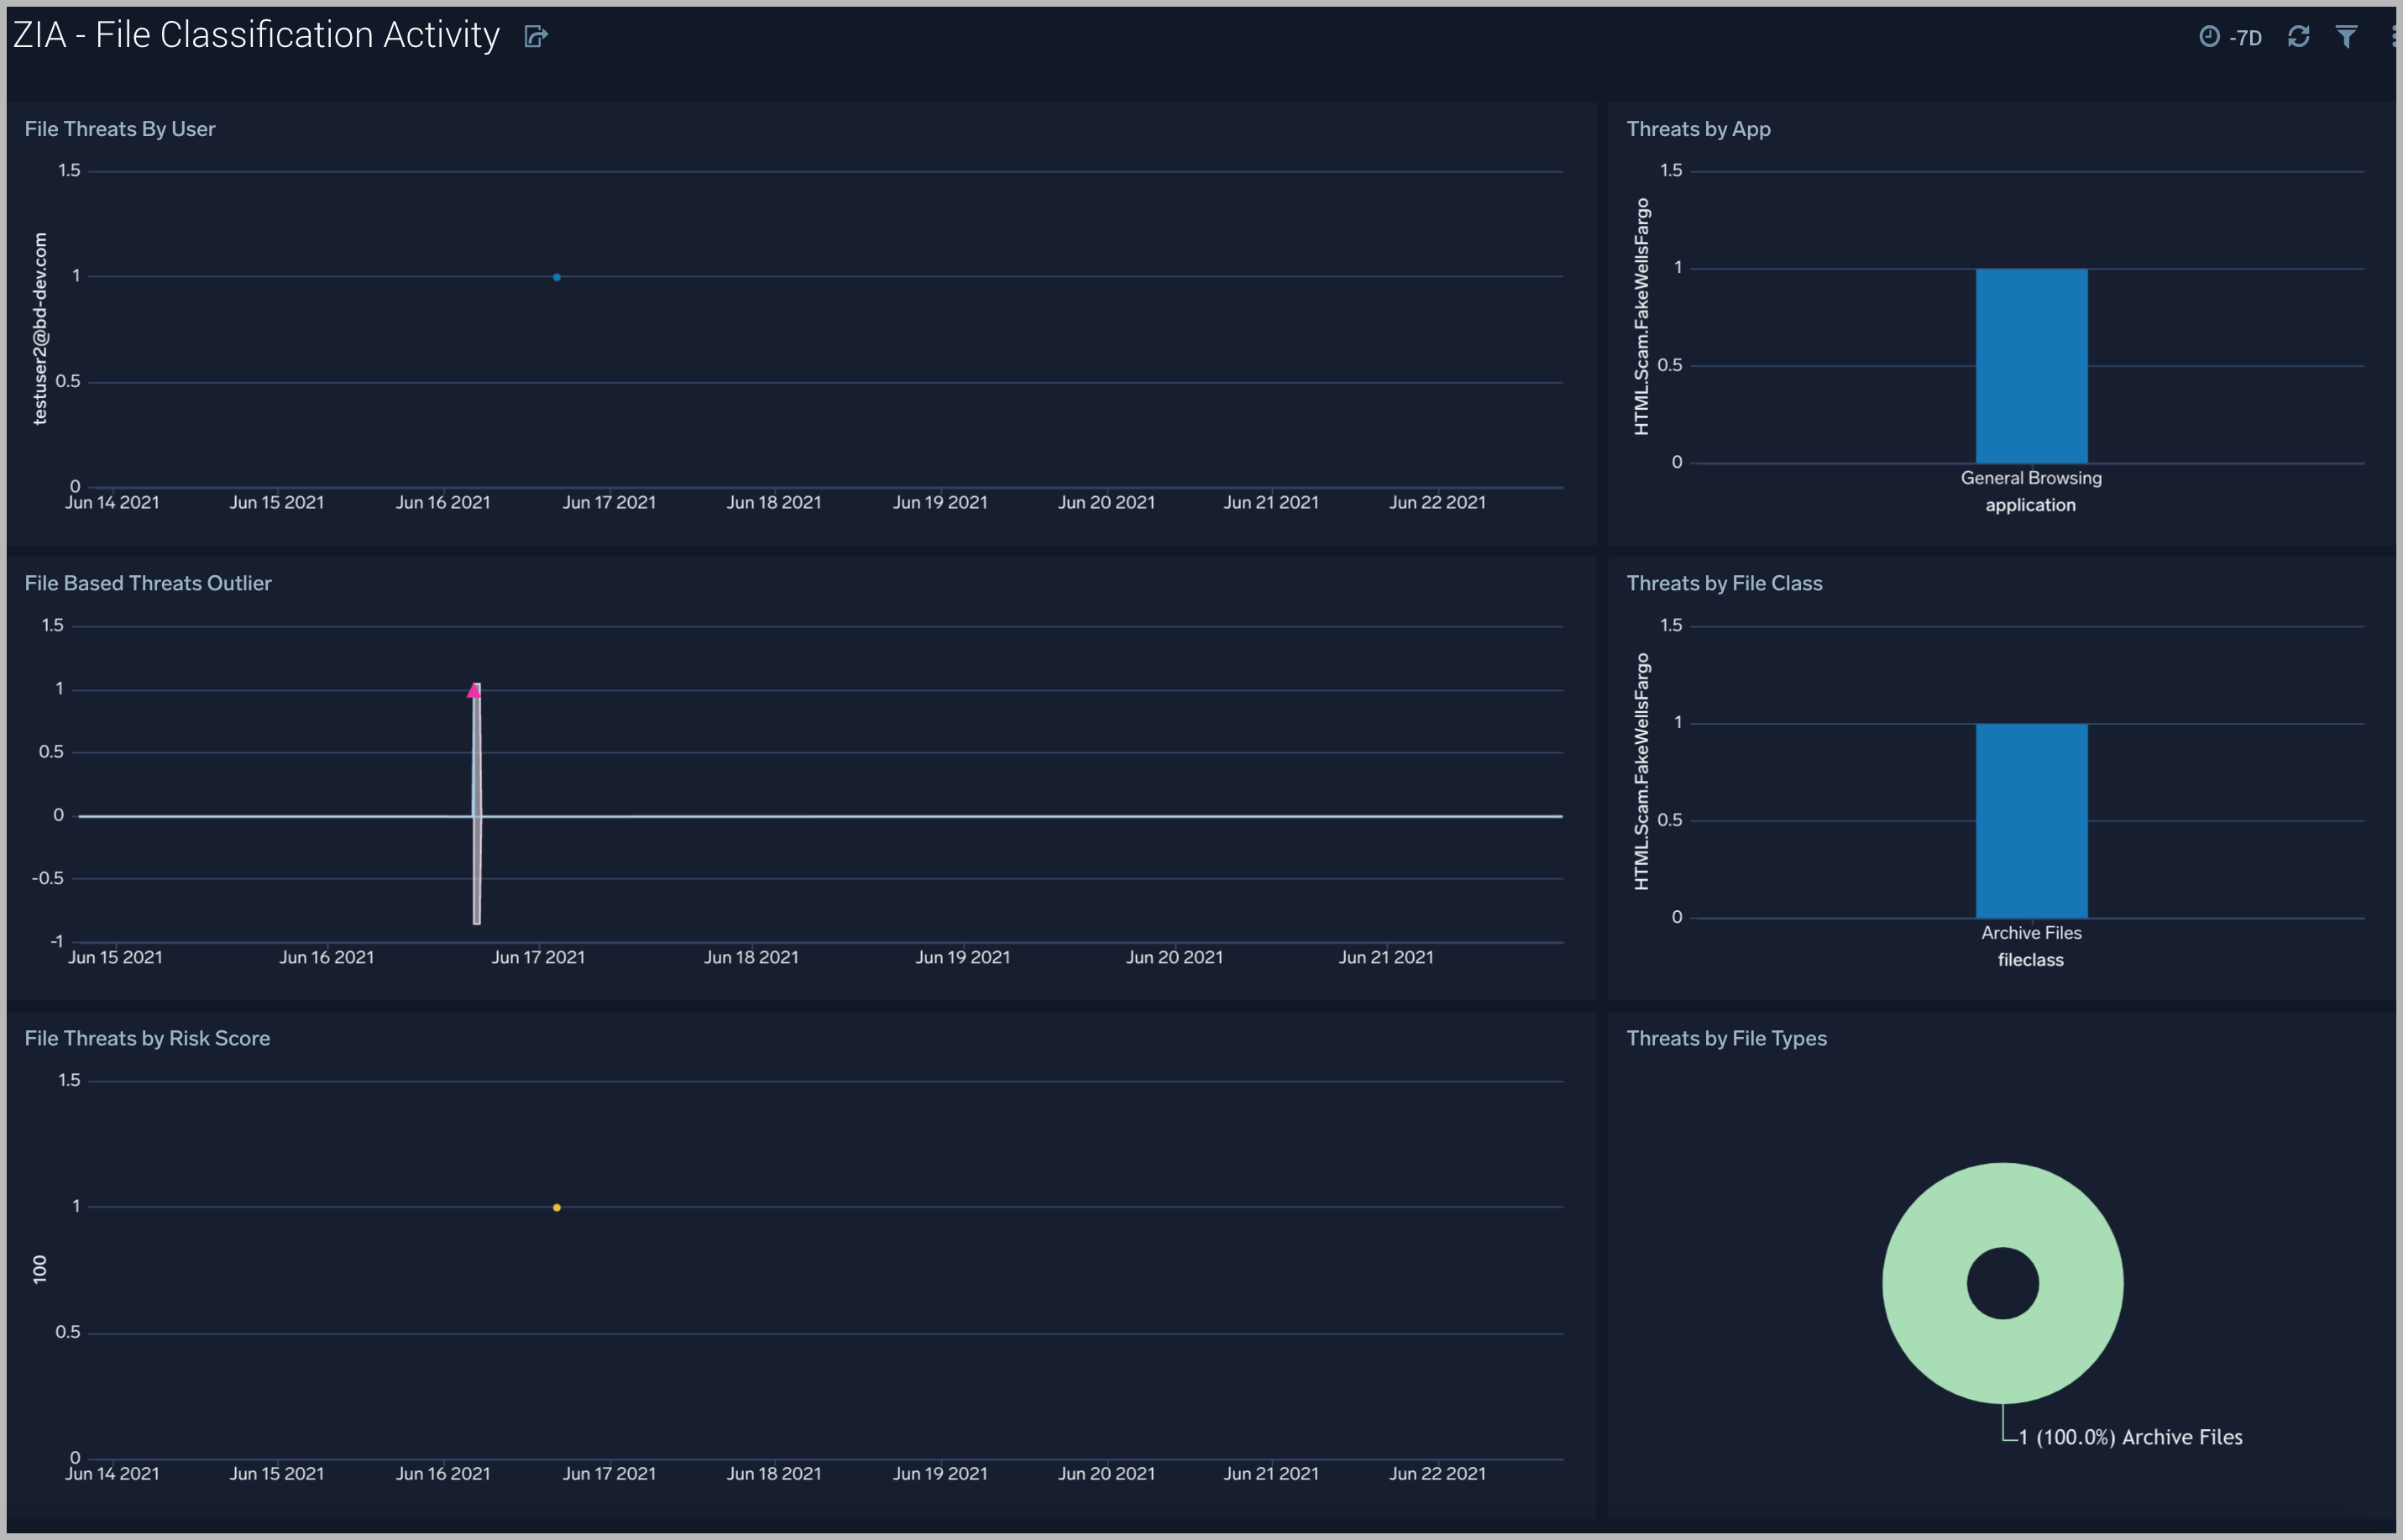
Zscaler - File Classification Activity
The Zscaler - File Classification Activity Dashboard focuses on file-based threats by users, threat name, file types, and subtypes for a overarching view of blocked files across the Zscaler environment.
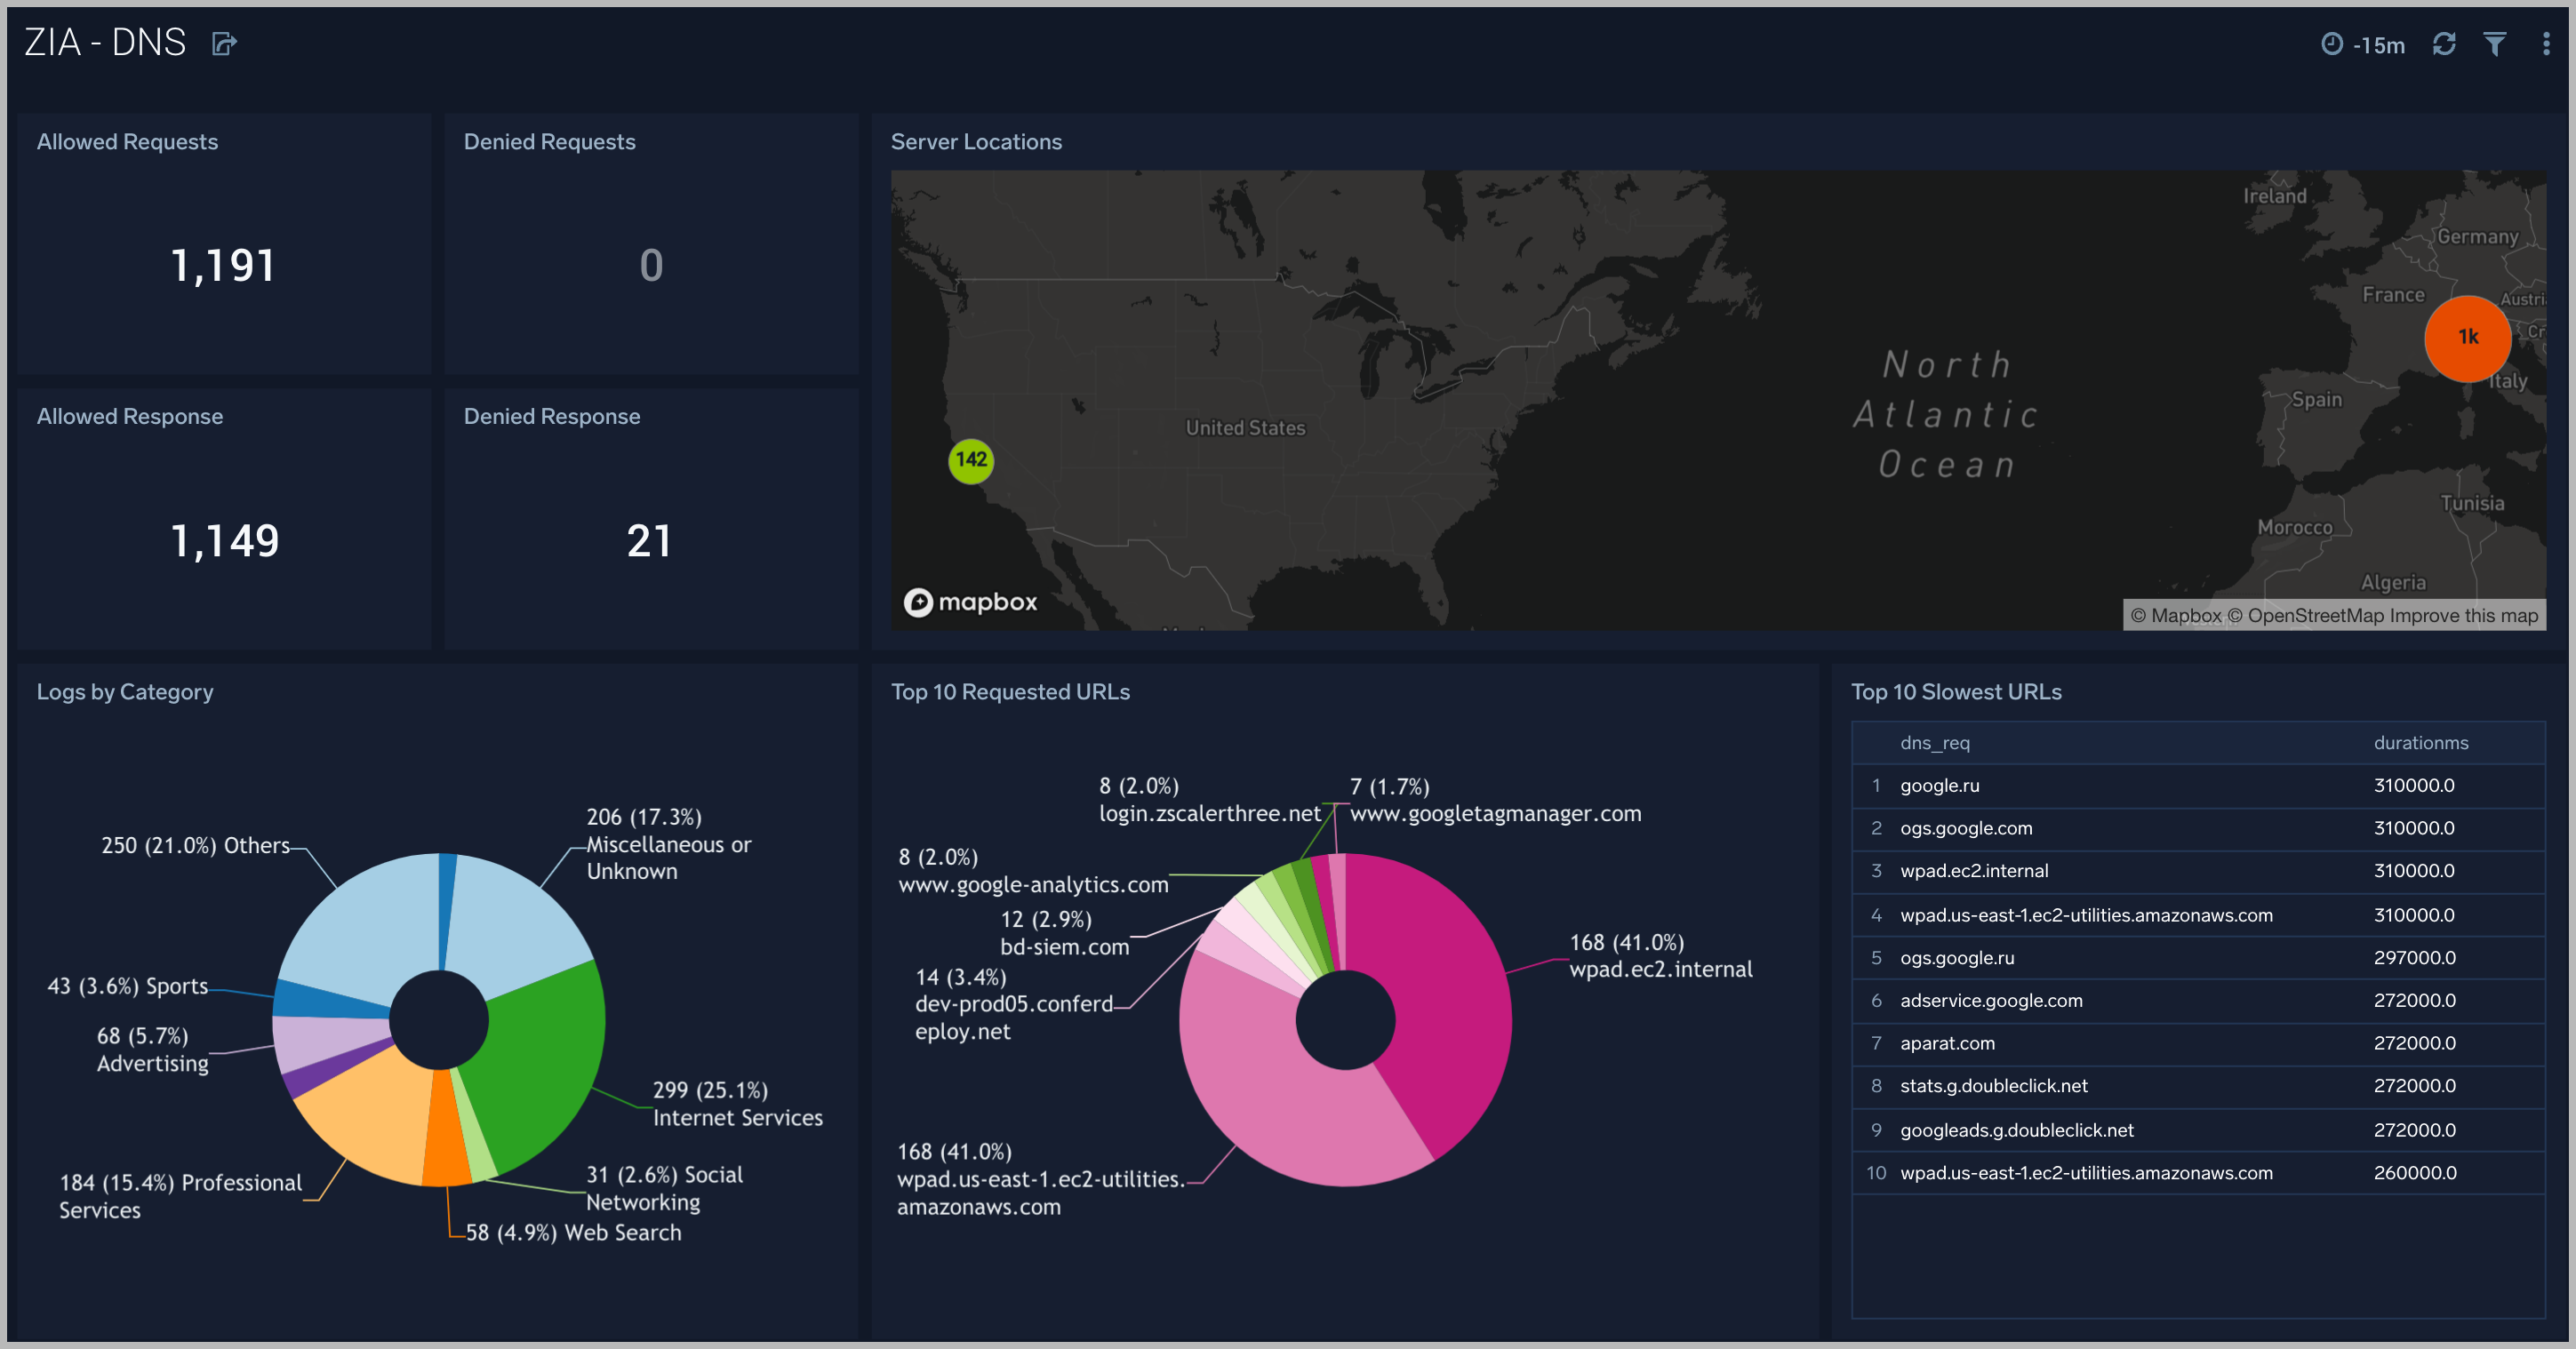
ZIA - DNS
The ZIA - DNS Dashboard focuses on DNS activity specifically around denied requests and responses, server locations across the Zscaler environment.
Use this dashboard to:
- Gain insights into DNS health and performance.
- Determine if rules need tweaking based on volume of denied/allowed requests and responses.
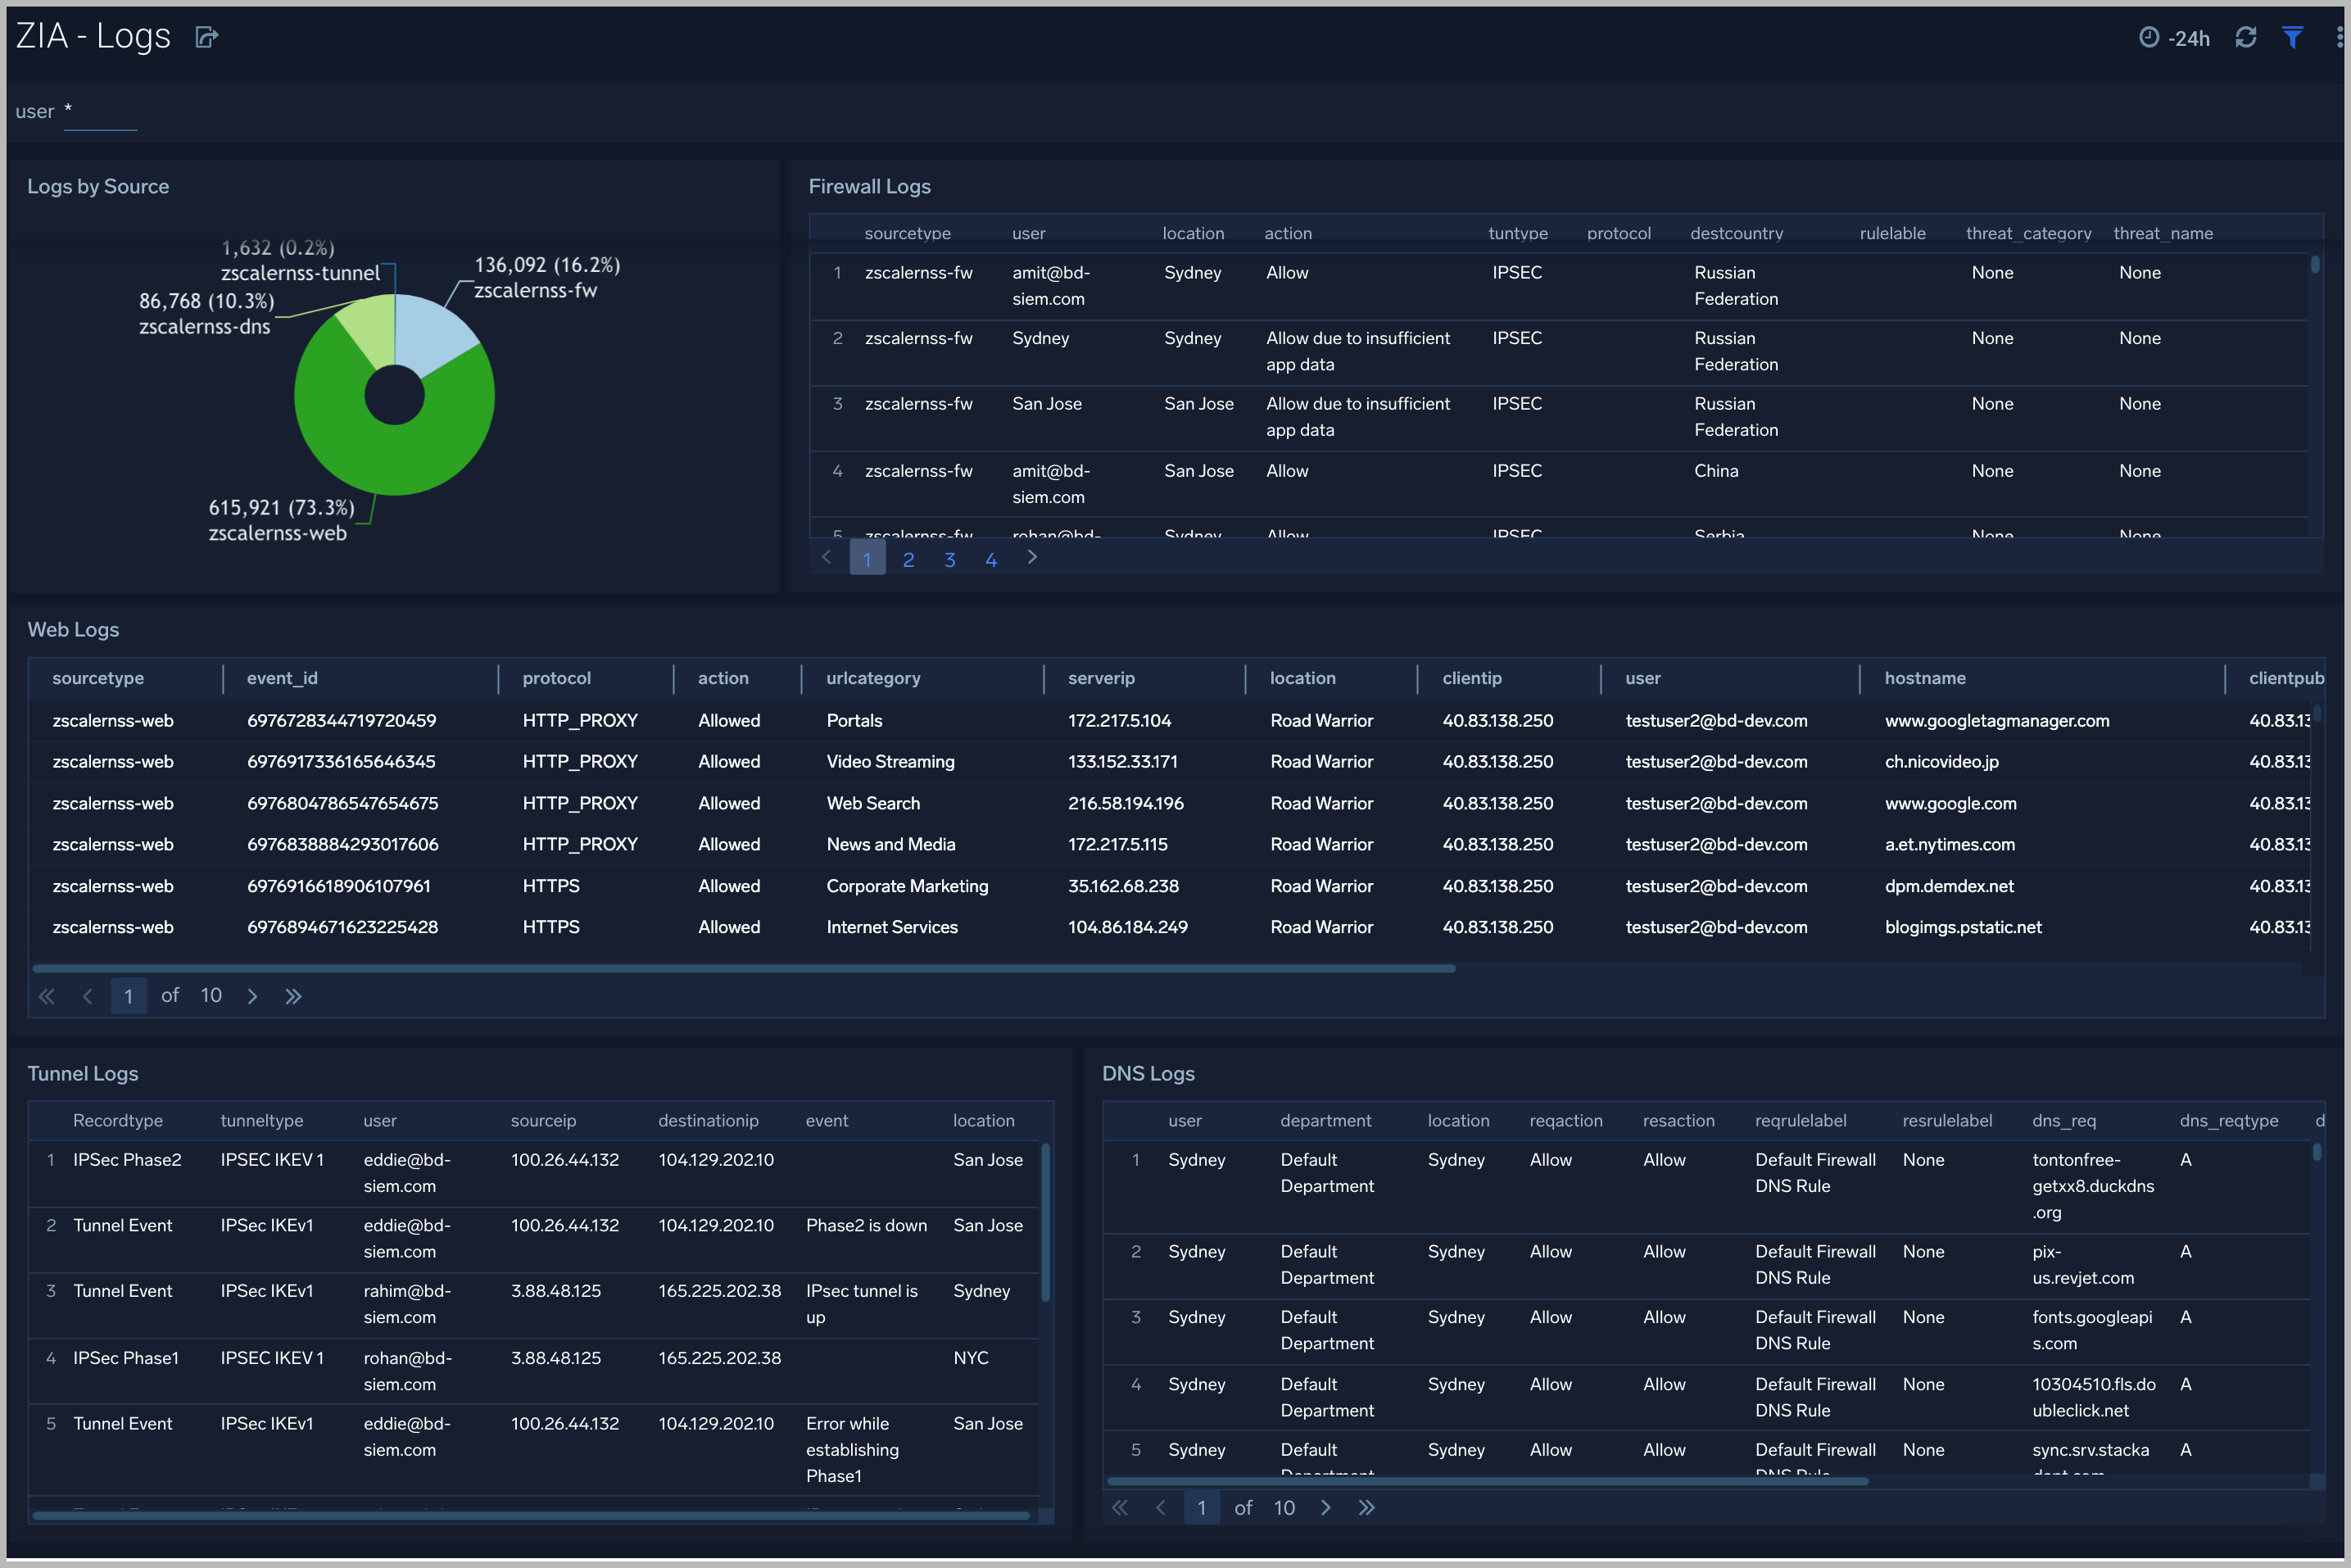
ZIA - Logs
The ZIA - Logs Dashboard gives insights into different logs being produced in the Zscaler environment.
Use this dashboard to:
- Get quick insights into logs volume by source.
- View logs filtered by type and users and determine any potential issues.
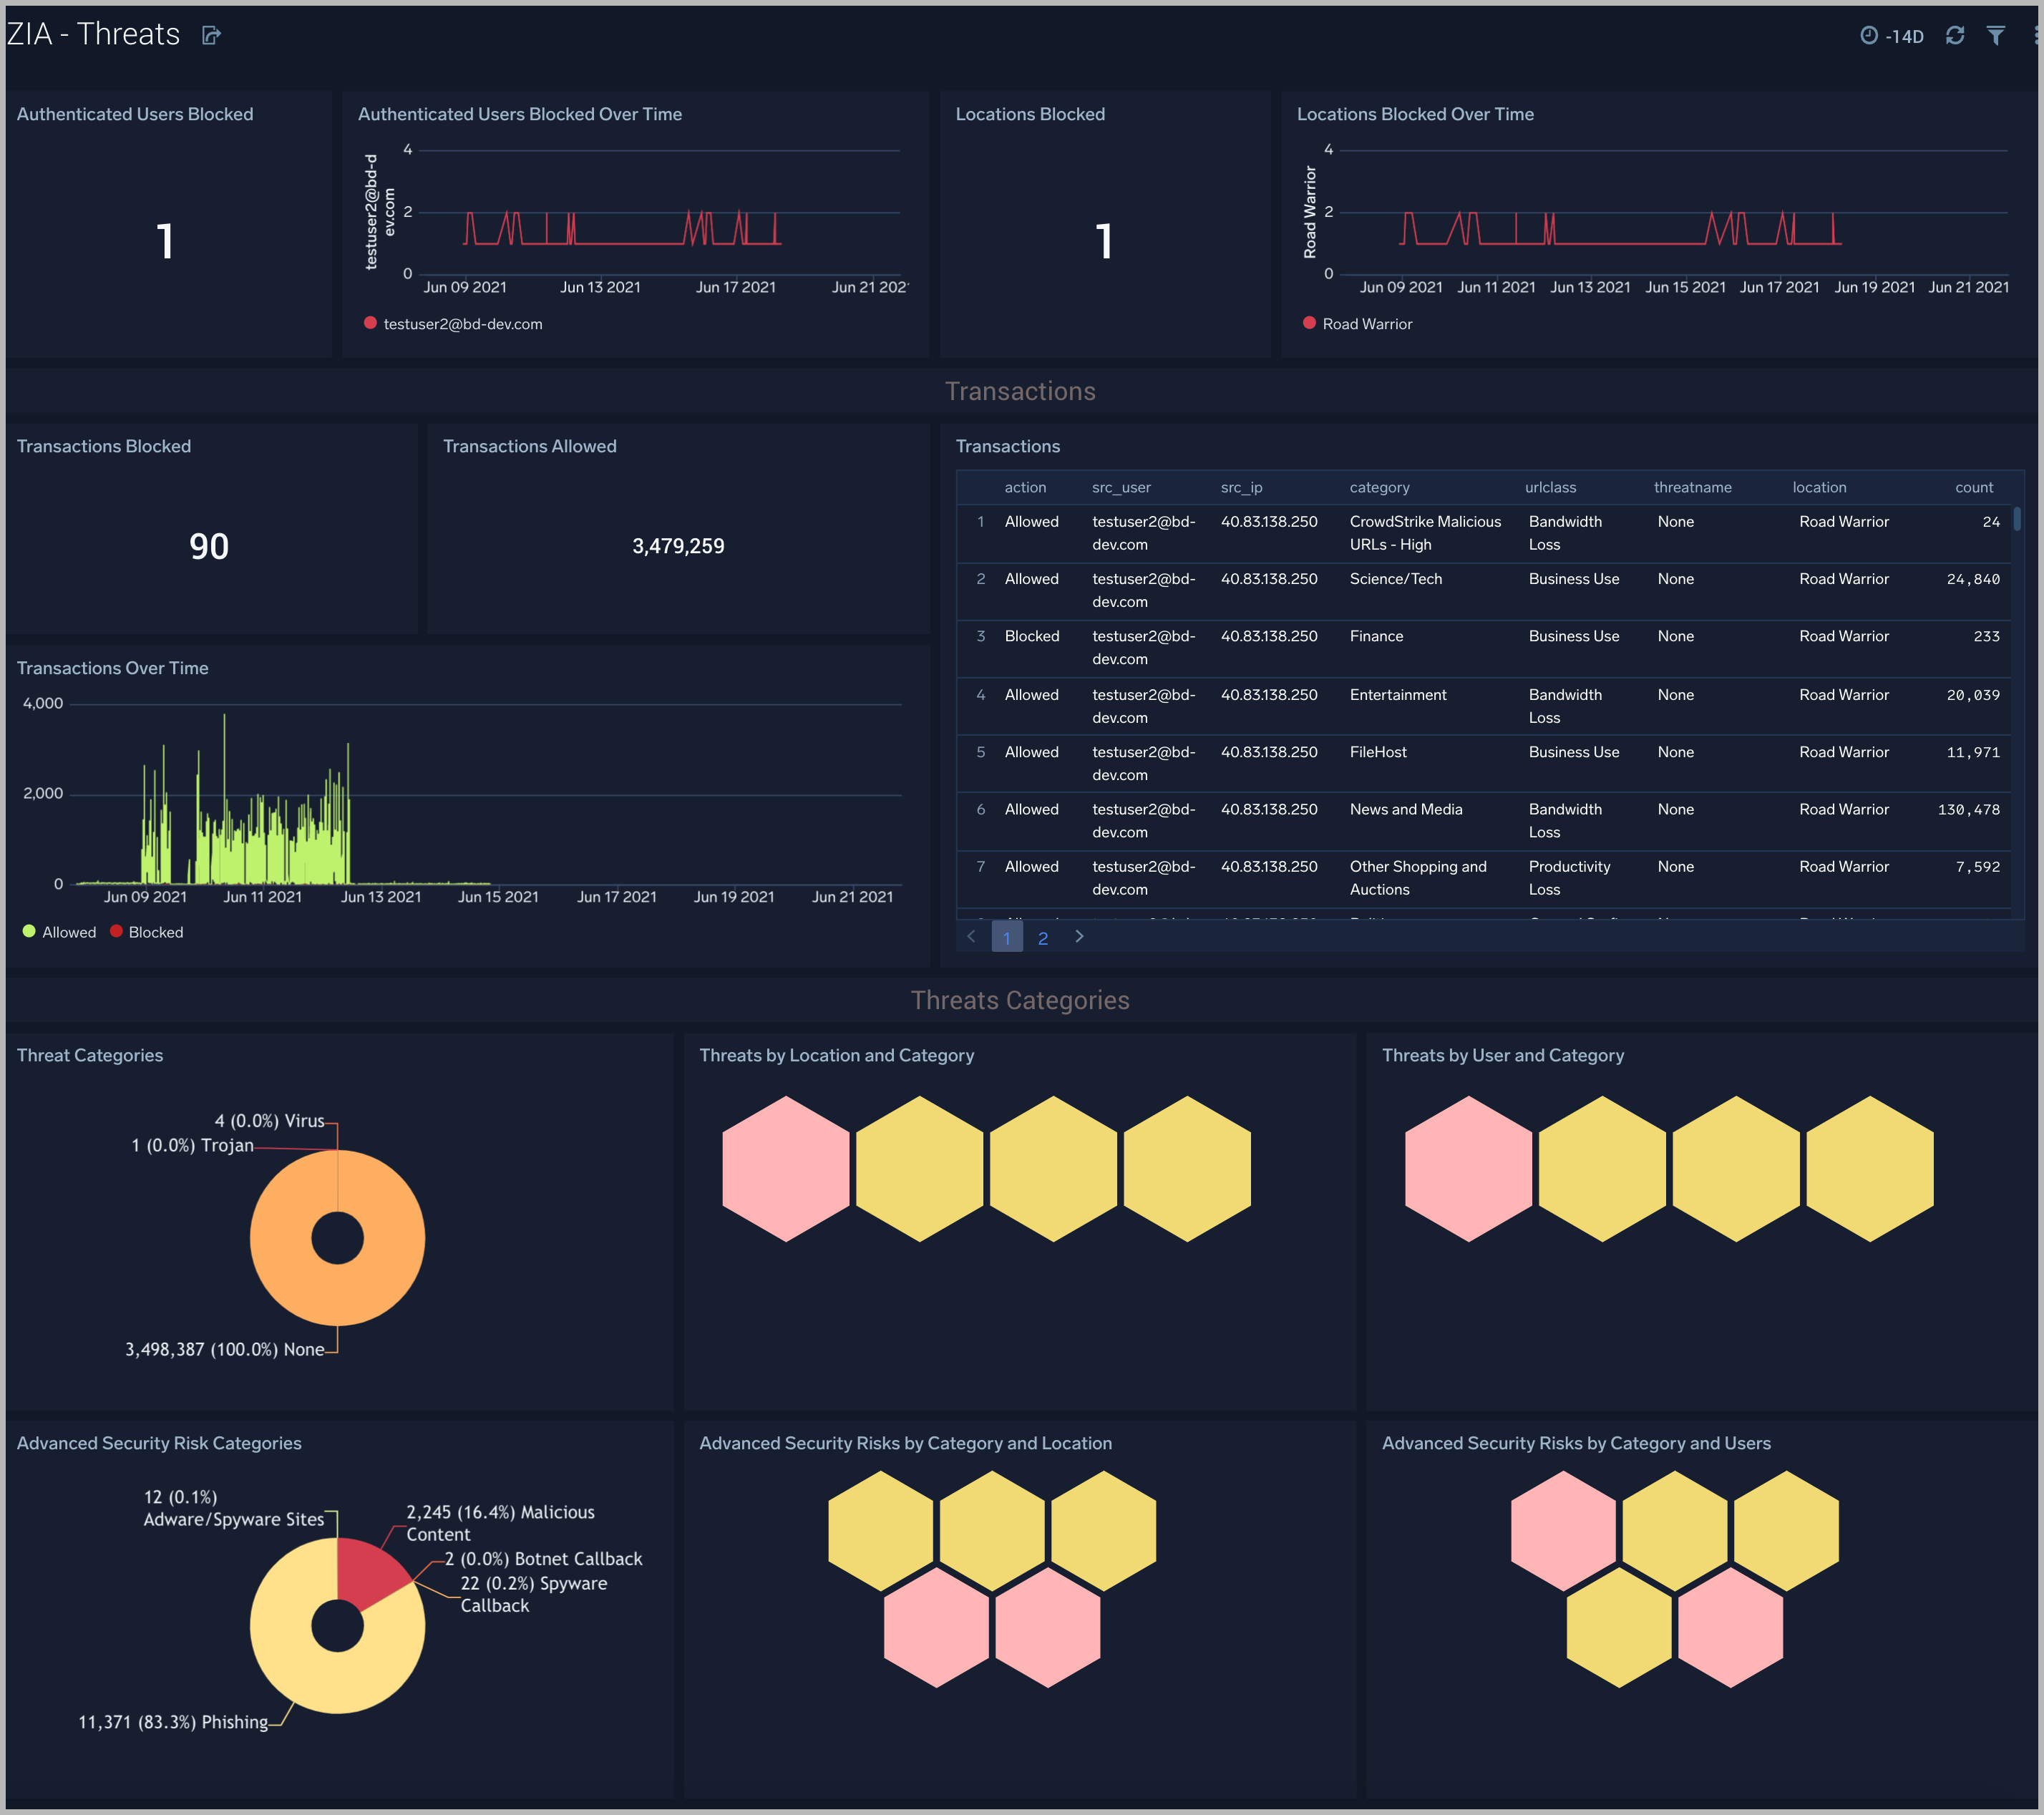
ZIA - Threats
The ZIA - Threats Dashboard focuses on threats in your Zscaler environment.
Use this dashboard to:
- Detect anomalies in blocked traffic and geographic hotspots for allowed and blocked traffic.
- Gain insights into threats by categories and transactions.
- Identify locations and users being blocked as a sign of potential suspicious or malicious activity.