Netskope

The Netskope App provides visibility into the security posture of your applications and helps you determine the overall usage of software and SaaS applications.
Netskope is a Cloud Access Security Broker (CASB) hosted in the cloud. The Netskope product is primarily used for enforcing security policies for cloud-based resources, such as Box and Microsoft Office 365. Customers purchase a CASB to address cloud service risks, enforce security policies, and comply with regulations, even when cloud services are beyond their perimeter and out of their direct control.
Log Types
The Netskope App provides a collector source for pulling all the events and alerts from Netskope in real-time via API calls and ingests them into the Sumo Logic platform through our Hosted collector.
For more information on Netskope, refer to the Netskope documentation.
Collect Logs for Netskope
To collect logs from the Netskope platform, use the new Cloud to Cloud Integration for Netskope to create the source and use the same source category while installing the app. You can view the Netskope legacy collection method here.
Sample Log message
Click to expand
{
           "dstip": "74.125.239.150",
           "dst_location": "Mountain View",
           "app": "Google Gmail",
           "_insertion_epoch_timestamp": 1547391690,
           "site": "Google Gmail",
           "src_location": "Pomerol",
           "organization_unit": "",
           "object_type": "Mail",
           "id": 3764,
           "app_session_id": 4252577042,
           "category": "Webmail",
           "dst_region": "California",
           "userkey": "Tanja.Barton@kkrlogistics.com",
           "dst_country": "US",
           "src_zipcode": "33500",
           "ur_normalized": "tanja.barton@kkrlogistics.com",
           "type": "nspolicy",
           "object": "Welcome Novak Dimitrov",
           "srcip": "77.194.46.1",
           "dst_latitude": 37.405991,
           "timestamp": 1547400222,
           "src_region": "Gironde",
           "dst_longitude": -122.078514,
           "alert": "no",
           "to_user": "ns-india@microsoft.com, hrglobal@microsoft.com",
           "user": "Tanja.Barton@kkrlogistics.com",
           "from_user": "bloomberg@bloomberg.com",
           "device": "Windows PC",
           "org": "kkrlogistics.com",
           "src_country": "FR",
           "traffic_type": "CloudApp",
           "dst_zipcode": "N/A",
           "count": 2,
           "src_latitude": 44.9333,
           "url": "https://mail.google.com/",
           "page_id": 2641483218,
           "sv": "unknown",
           "ccl": "excellent",
           "cci": 92,
           "activity": "Send",
           "userip": "127.0.0.1",
           "src_longitude": -0.2,
           "_id": "5df996d5b66a9ea963e812ce",
           "os": "Windows 8",
           "browser": "Internet Explorer",
           "appcategory": "Webmail"
       }
   ]
}
Sample Query
The following query sample was is from the Total Sessions panel of the Application Overview Dashboard.
_sourceCategory="netskope_events" "no" "nspolicy"
| json "_id", "alert", "type", "srcip", "dstip", "appcategory", "app", "os", "user", "device",
"acked", "site", "timestamp", "ccl", "activity", "browser", "object", "object_type", "from_user",
"to_user", "app_session_id" as alert_id, is_alert, type, src_ip, dest_ip, appcategory, app, os,
user, device, acked, site, timestamp, ccl, activity, browser, object, object_type, from_user,
to_user, app_session_id  nodrop
| where is_alert="no" and type="nspolicy"
| count by app_session_id
| count
Installing the Netskope App
This section demonstrates how to install the Netskope App, and provides examples and descriptions for each of the dashboards. The Netskope App has the following components:
- Application Usage: Insights into application usage; specifically by devices, users, users and traffic patterns.
- Security Alerts: Visibility into Netskope security alerts and violations and the ability to identify effects of a breach.
To install the Netskope App:
Locate and install the app you need from the App Catalog. If you want to see a preview of the dashboards included with the app before installing, click Preview Dashboards.
- From the App Catalog, search for and select the app.
- Select the version of the service you're using and click Add to Library.
Version selection is applicable only to a few apps currently. For more information, see Installing the Apps from the Library.
- To install the app, complete the following fields.
- App Name. You can retain the existing name, or enter a name of your choice for the app.
- Data Source. Select either of these options for the data source.
- Choose Source Category, and select a source category from the list.
- Choose Enter a Custom Data Filter, and enter a custom source category beginning with an underscore. Example: (
_sourceCategory=MyCategory).
- Advanced. Select the Location in Library (the default is the Personal folder in the library), or click New Folder to add a new folder.
- Click Add to Library.
Once an app is installed, it will appear in your Personal folder, or other folder that you specified. From here, you can share it with your organization.
Panels will start to fill automatically. It's important to note that each panel slowly fills with data matching the time range query and received since the panel was created. Results won't immediately be available, but with a bit of time, you'll see full graphs and maps.
Viewing Netskope Dashboards
The Netskope dashboards are grouped by their component in the following two category folders:
- Application Usage
- Security Alerts
Dashboard filters
Each dashboard has a set of filters that you can apply to the entire dashboard, as shown in the following example. Click the funnel icon in the top dashboard menu bar to display a scrollable list of filters that are applied across the entire dashboard.
You can use filters to drill down and examine the data on a granular level.
Each panel has a set of filters that are applied to the results for that panel only, as shown in the following example. Click the funnel icon in the top panel menu bar to display a list of panel-specific filters.
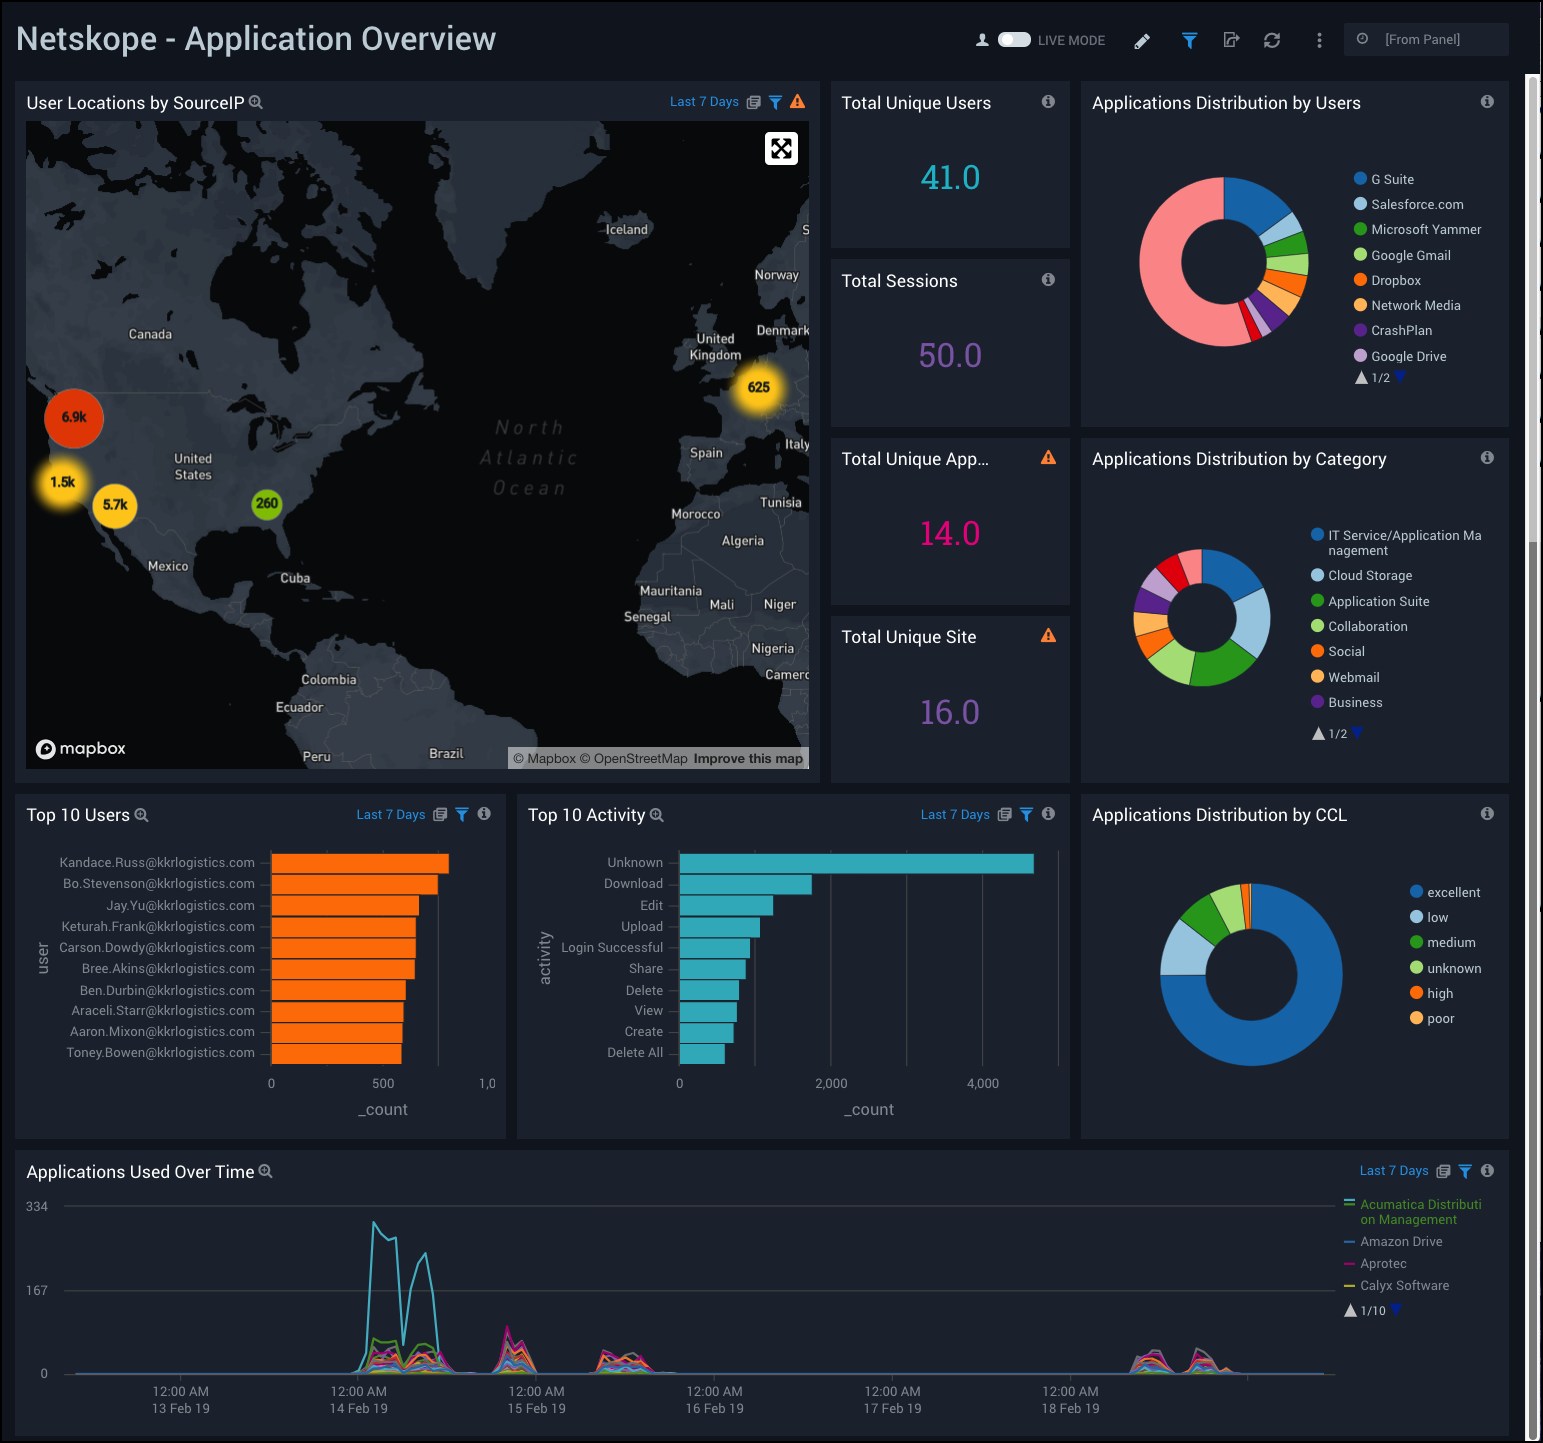
Application Overview
Netskope - Application Overview Dashboard provides a high-level view of user activity, user geographic location by source IP, total sessions, applications used, distribution and activity of applications, and application trends over time.
Use this dashboard to:
- Monitor number of users, sessions, and sites using the applications, and find out the popular apps by user and app category.
- Track spikes in application usage over time.
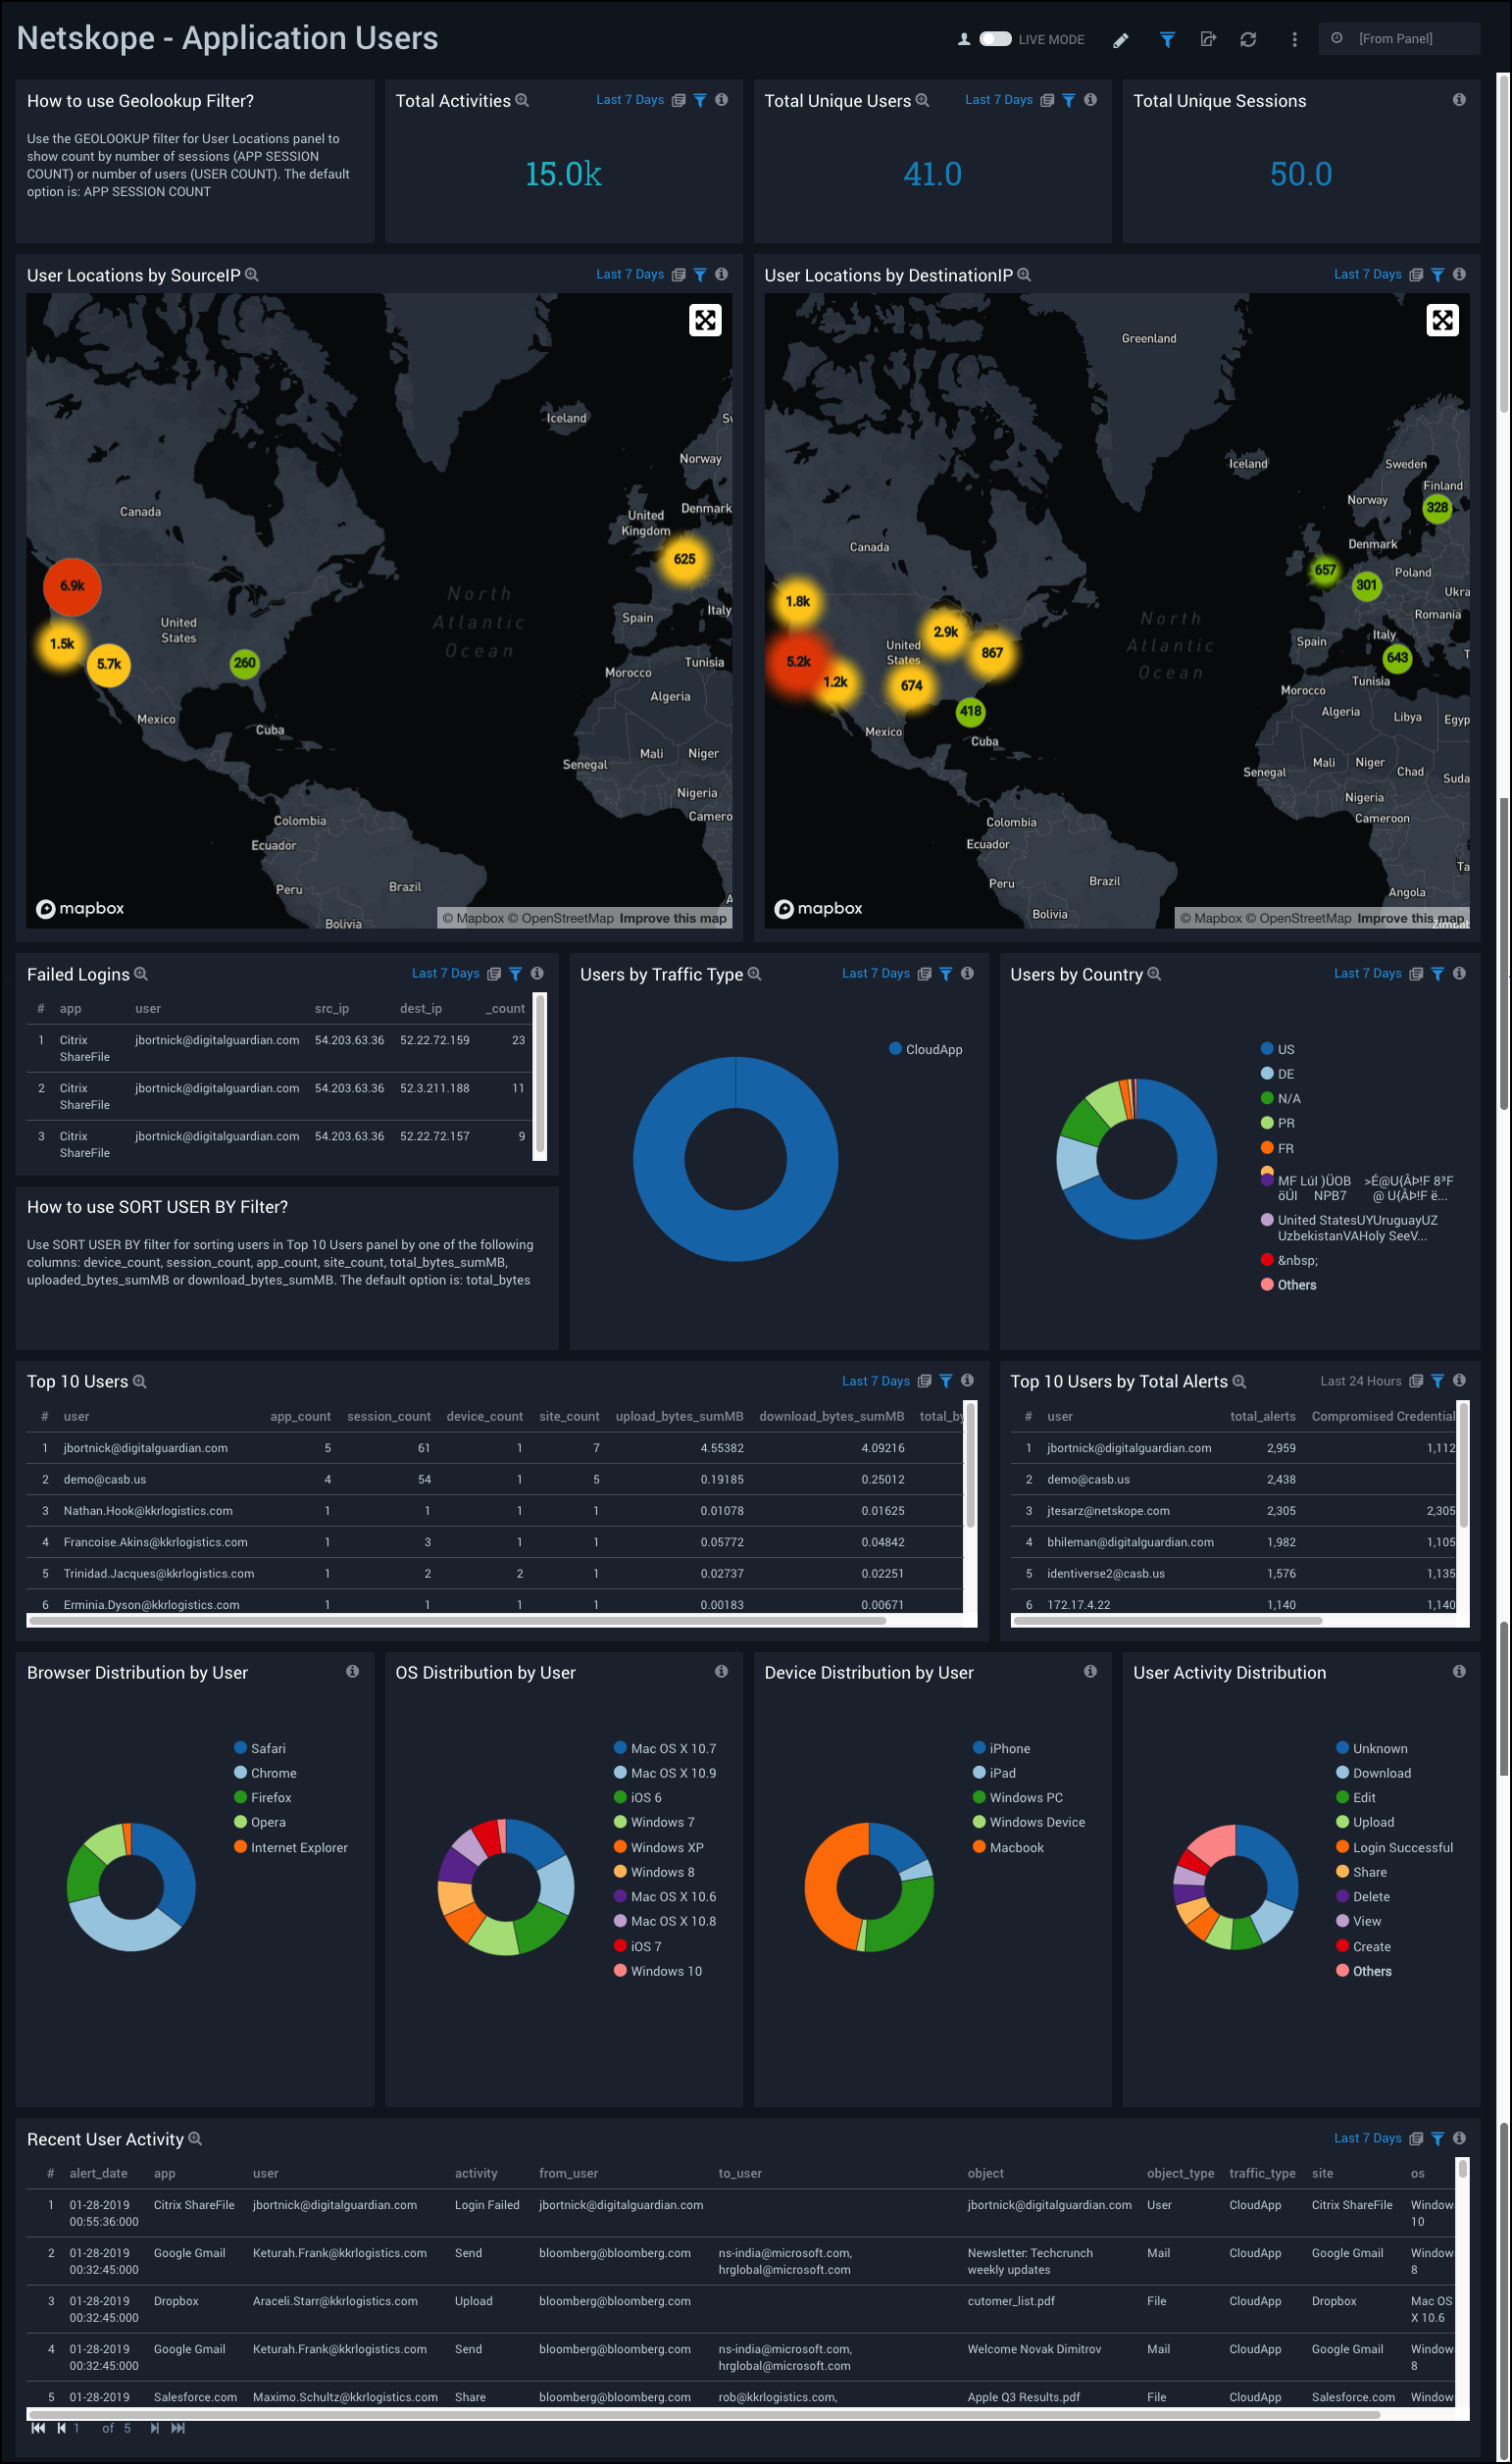
Application Users
Netskope - Application Users Dashboard provides a high-level view of application events, total sessions, user activity and geographic location by source IP and destination IP. This dashboard also shows visual breakdowns of distributions by operating system, browser, device, and user activity.
Use this dashboard to:
- Monitor recent user activities, track user locations, and find out the top users affected by alerts.
- Determine user classifications by browsers, devices, operating system (OS).
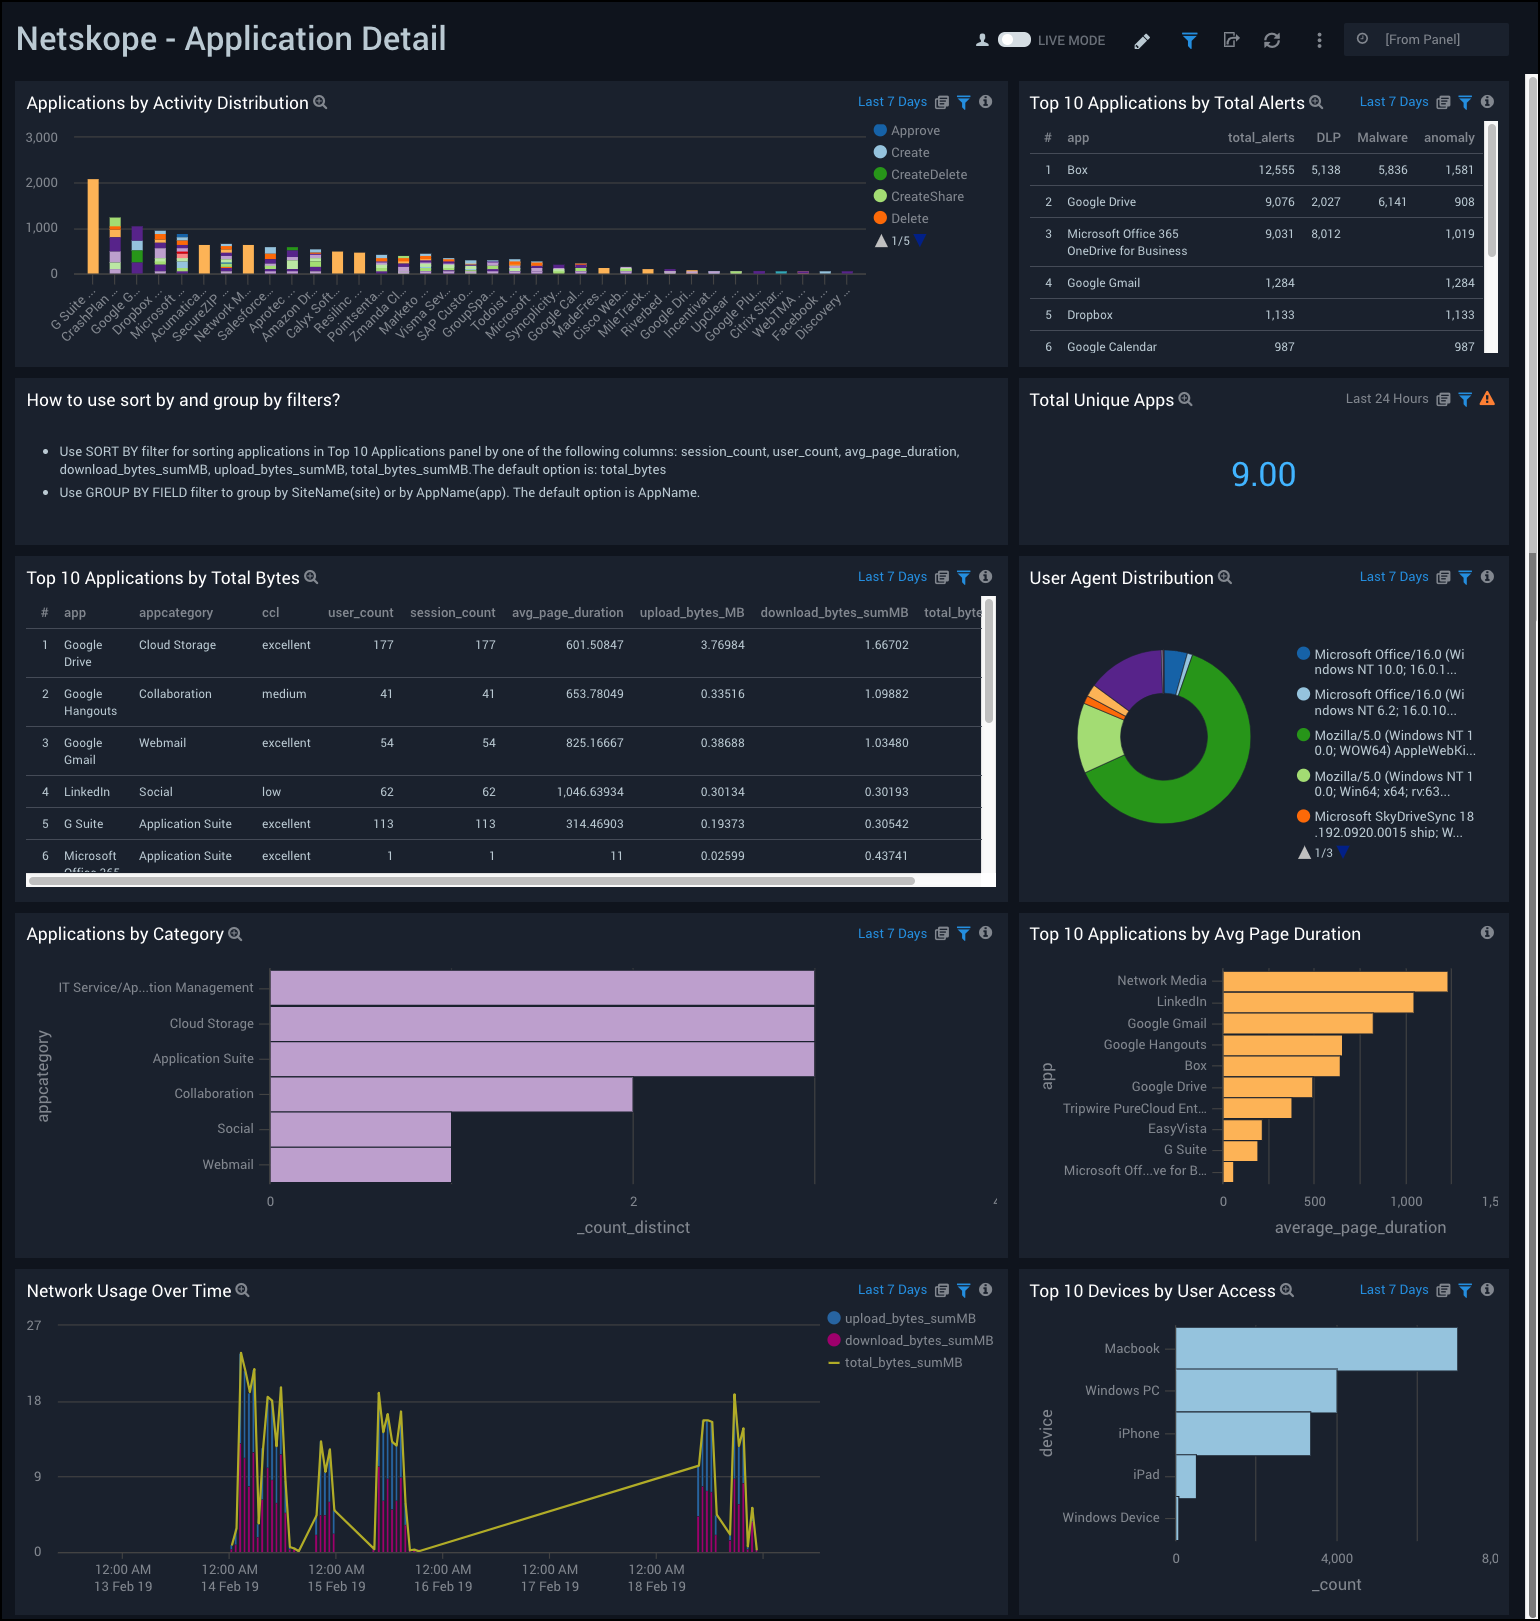
Application Details
Netskope - Application Details Dashboard provides a high-level view of data for unique applications used, as well as top applications by alerts, bytes, and average page duration. This dashboard also provides a visual breakdown of applications by category, devices by user access, and network usage over time.
Use this dashboard to:
- Monitor the top applications generating alerts.
- Find out detailed information about application usage in terms of page duration, user counts, upload and download bytes.
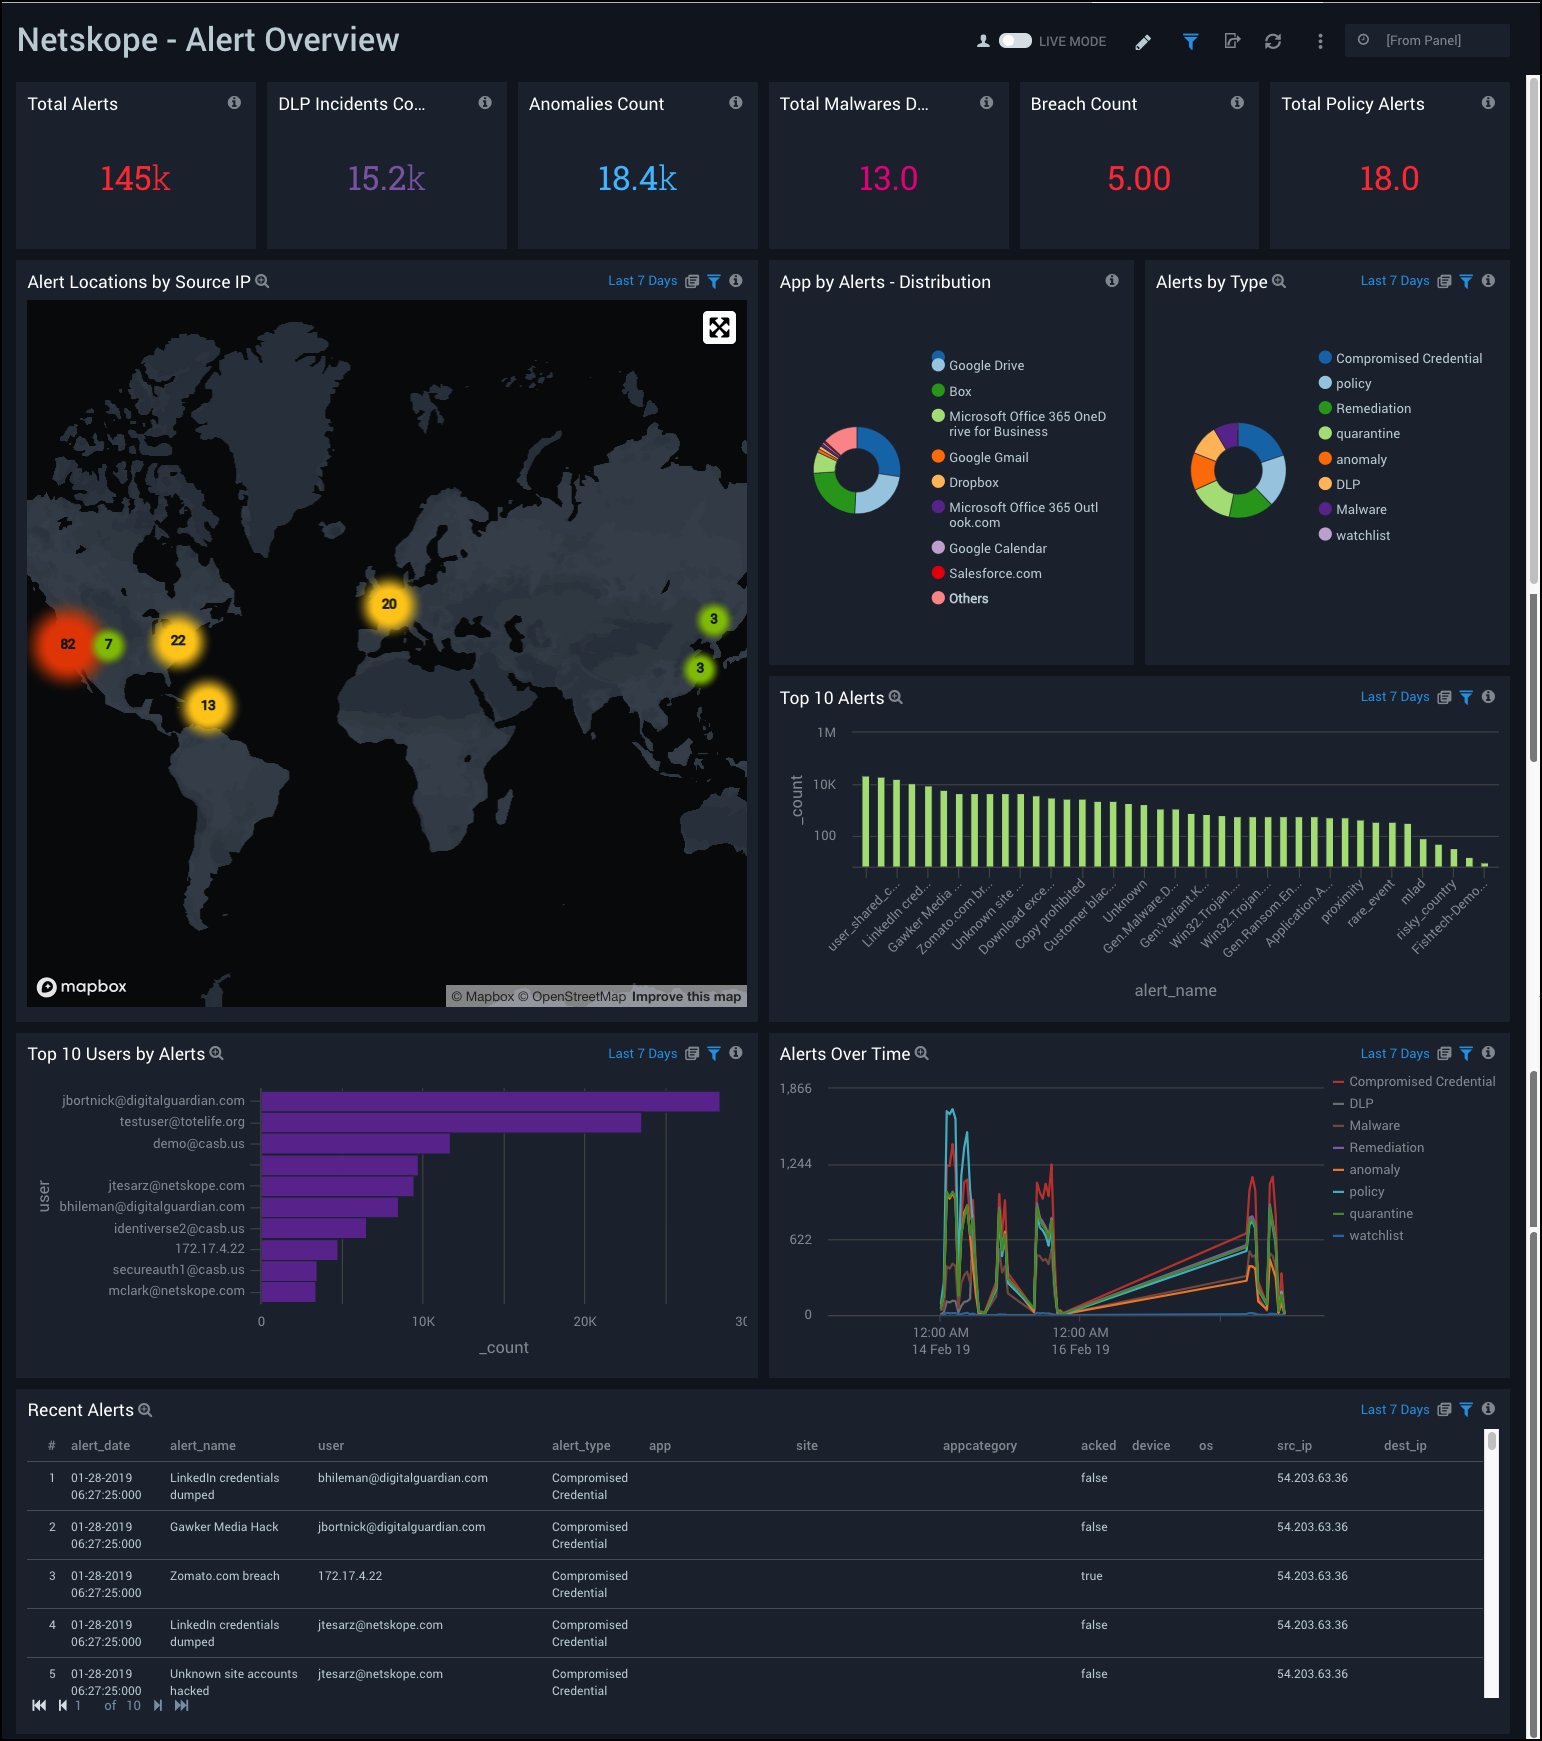
Alert Overview
Netskope - Alert Overview Dashboard provides a high-level view of your alert data by type, geographic location of source IPs, total and top alerts, alerts by user, recent alerts, and alert trends over time.
Use this dashboard to:
- Track users affected by alerts.
- Monitor abnormal spikes, alert locations, and recent alerts.
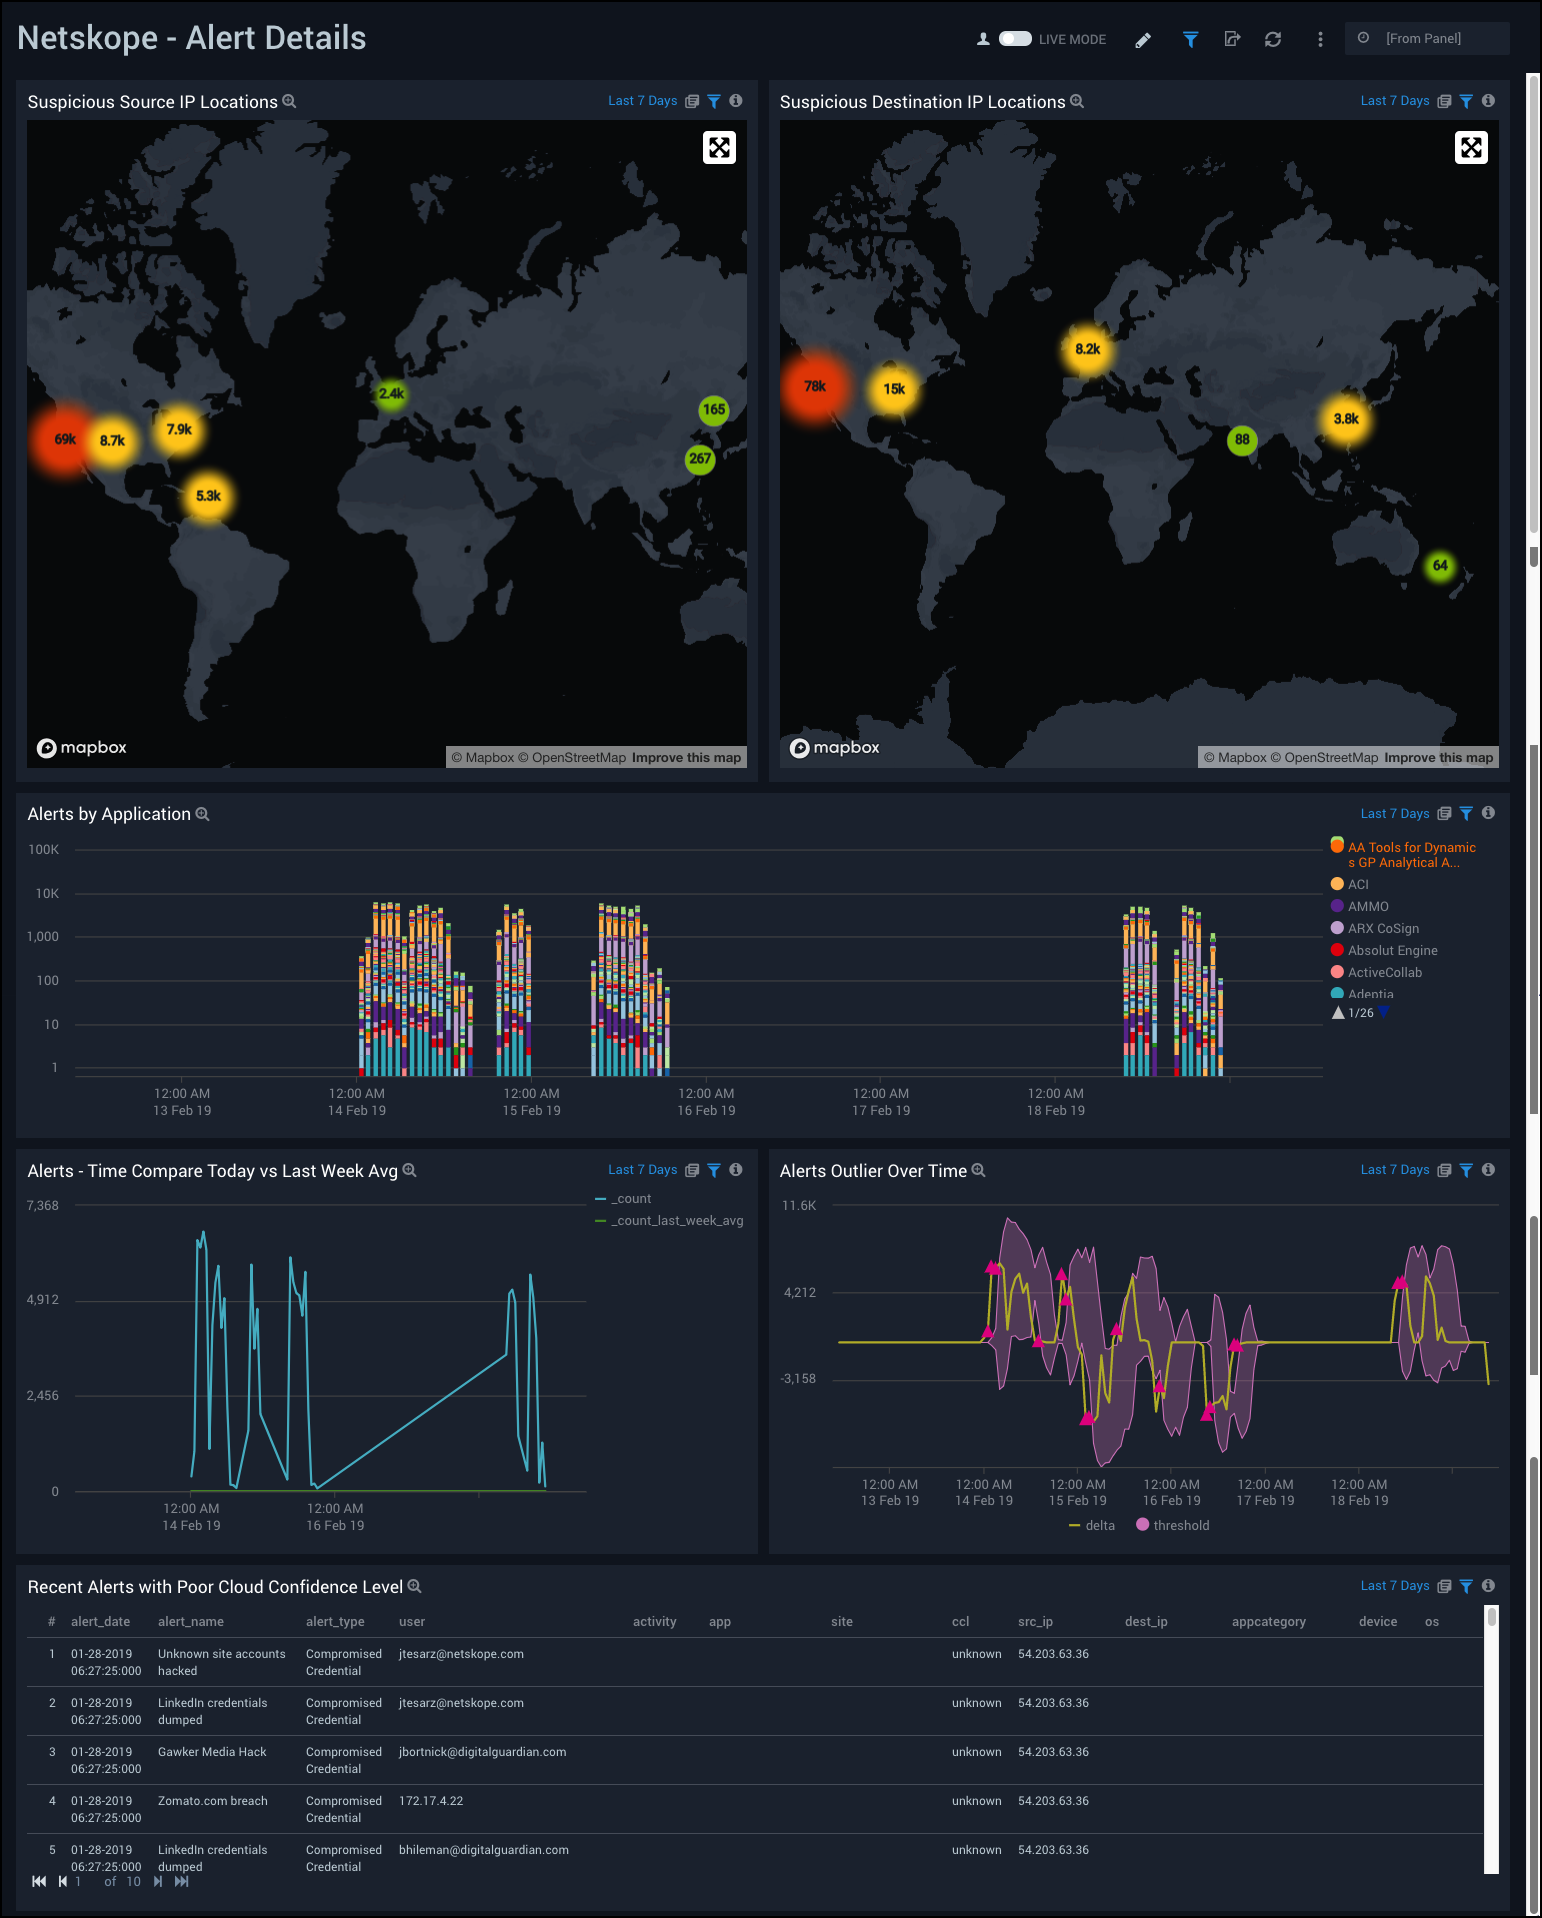
Alert Details
Netskope - Alert Details Dashboard provides a visual presentation of alert analytics, including the geographic locations of suspicious source and destination IPs, a time compare of alters, alert outlier trends over time, alerts by application, and recent alerts with a poor cloud confidence level.
Use this dashboard to:
- Compare alerts over time and anomalies in alert rates.
- Track which applications are producing the most alerts over time.
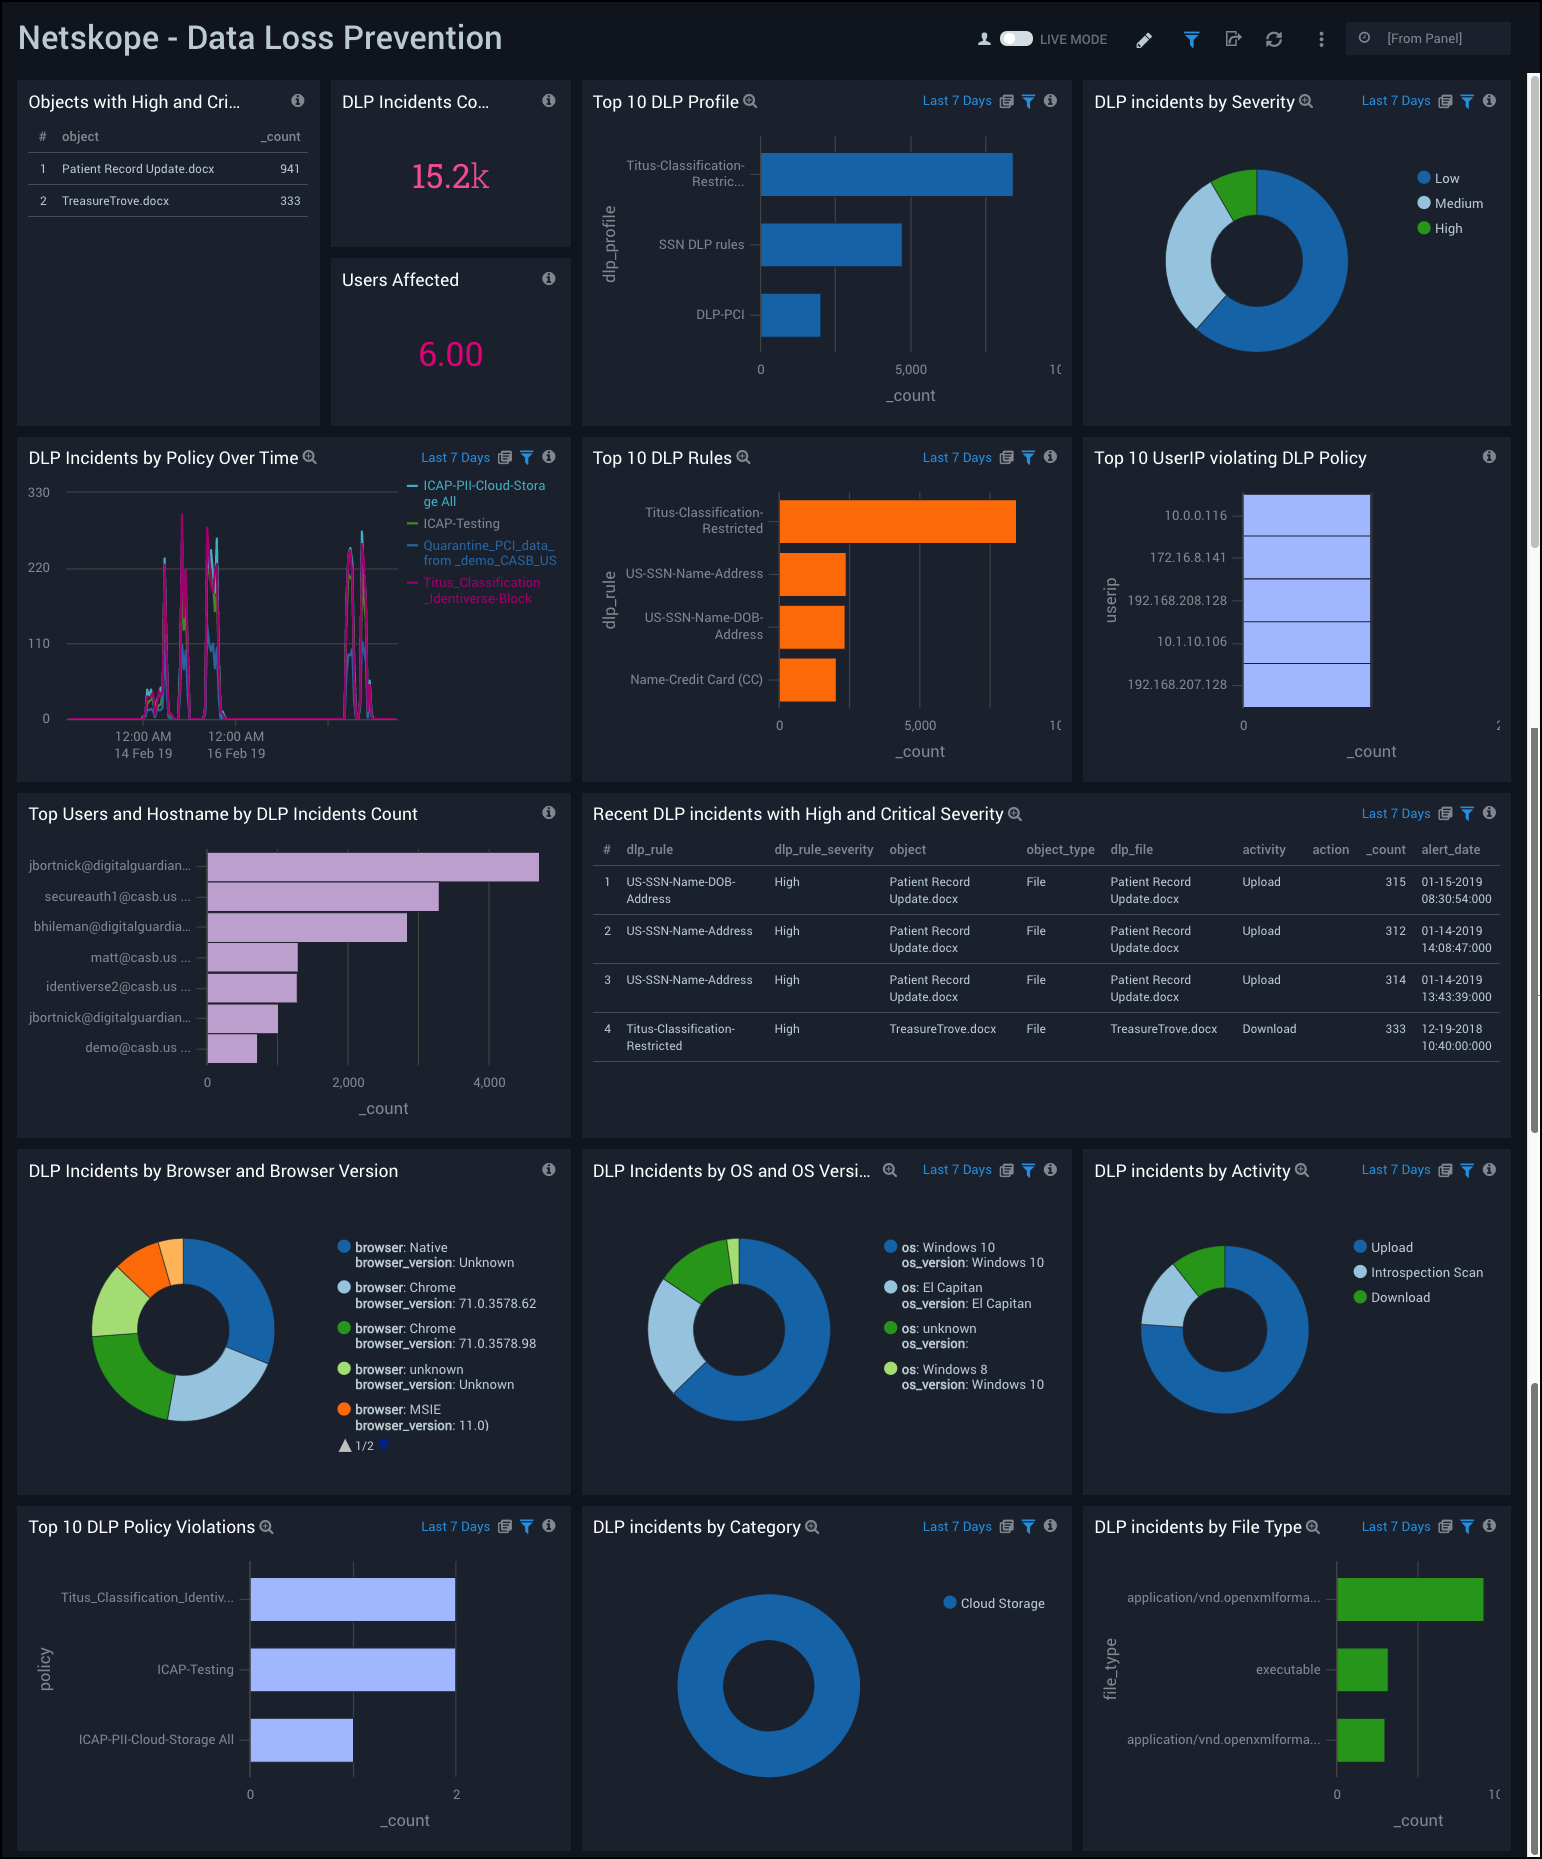
Data Loss Prevention
Netskope - Data Loss Prevention Dashboard provides a high-level view of data loss prevention (DLP) analytics, including incidents by policy over time, incidents by severity and application, incidents by operating system (OS) and browser. This dashboard also shows data on DLP rules, top profiles, incident count, and users affected.
Use this dashboard to:
- Track users and applications affected by DLP incidents.
- Monitor High Severity DLP incidents.
- Determine objects with critical severity.
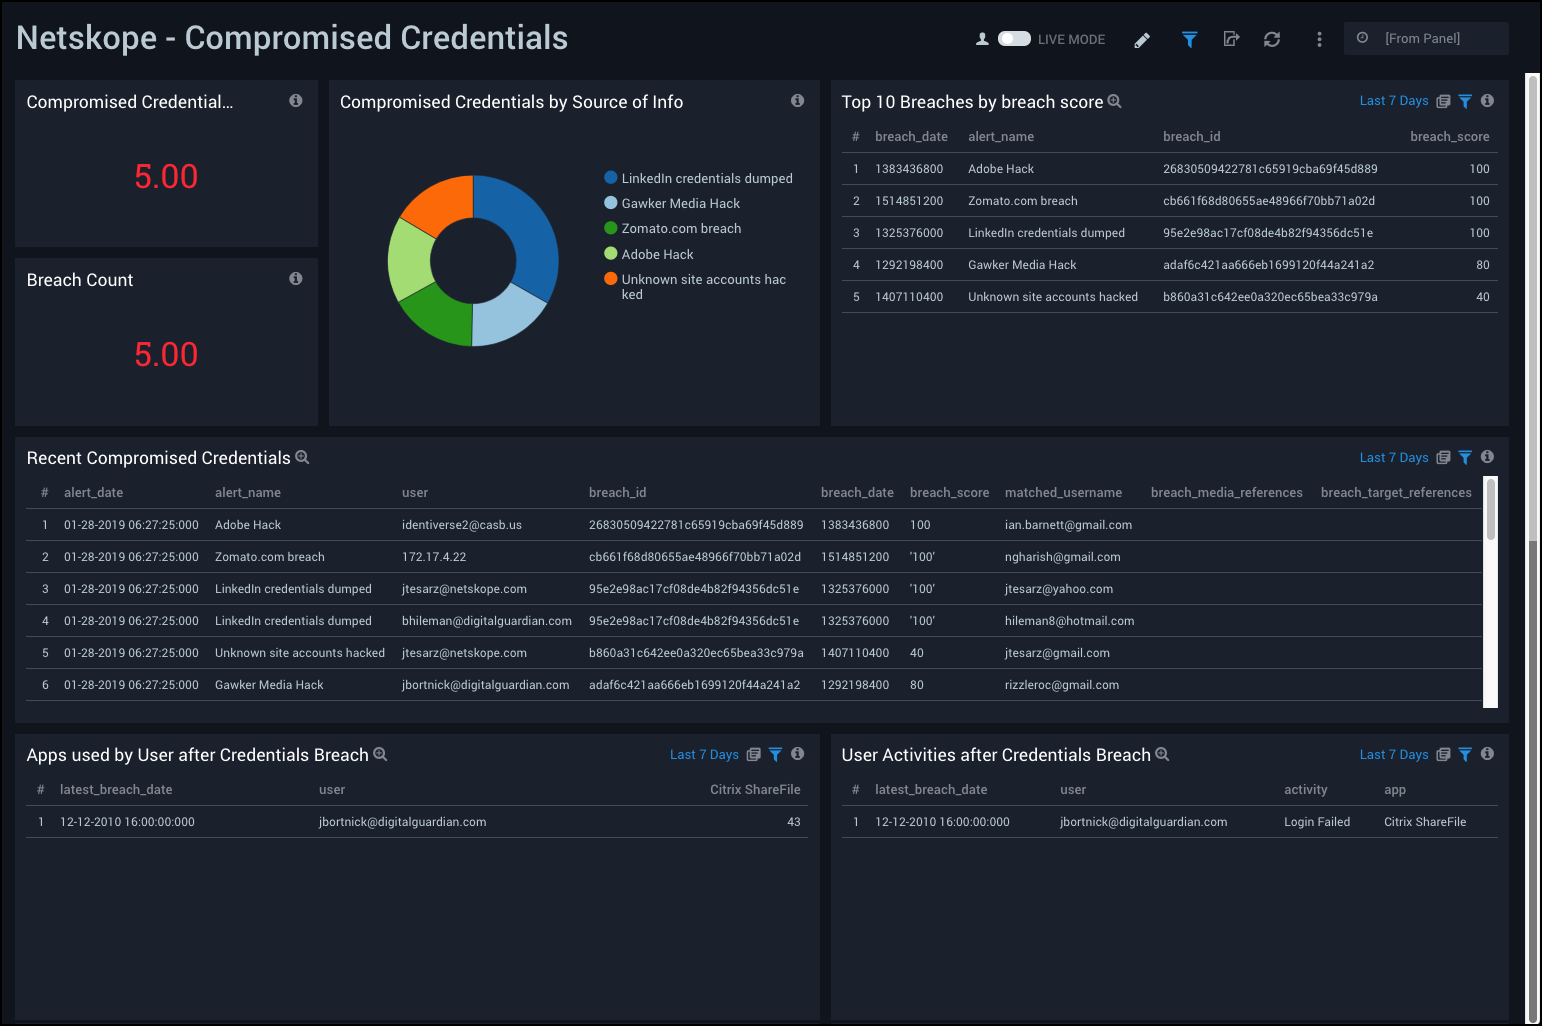
Compromised Credentials
Netskope - Compromised Credentials Dashboard provides easily accessible analytics on compromised credentials, including the number of users with compromised credentials, a breach count and top breaches, and source info. This dashboard also provides data on recent compromised credentials, apps used by users after a credentials breach, and user activities after a credentials breach.
Use this dashboard to:
- Track credential breaches along with their source.
- Monitor user activities.
- Monitor application usage after credentials have been breached.
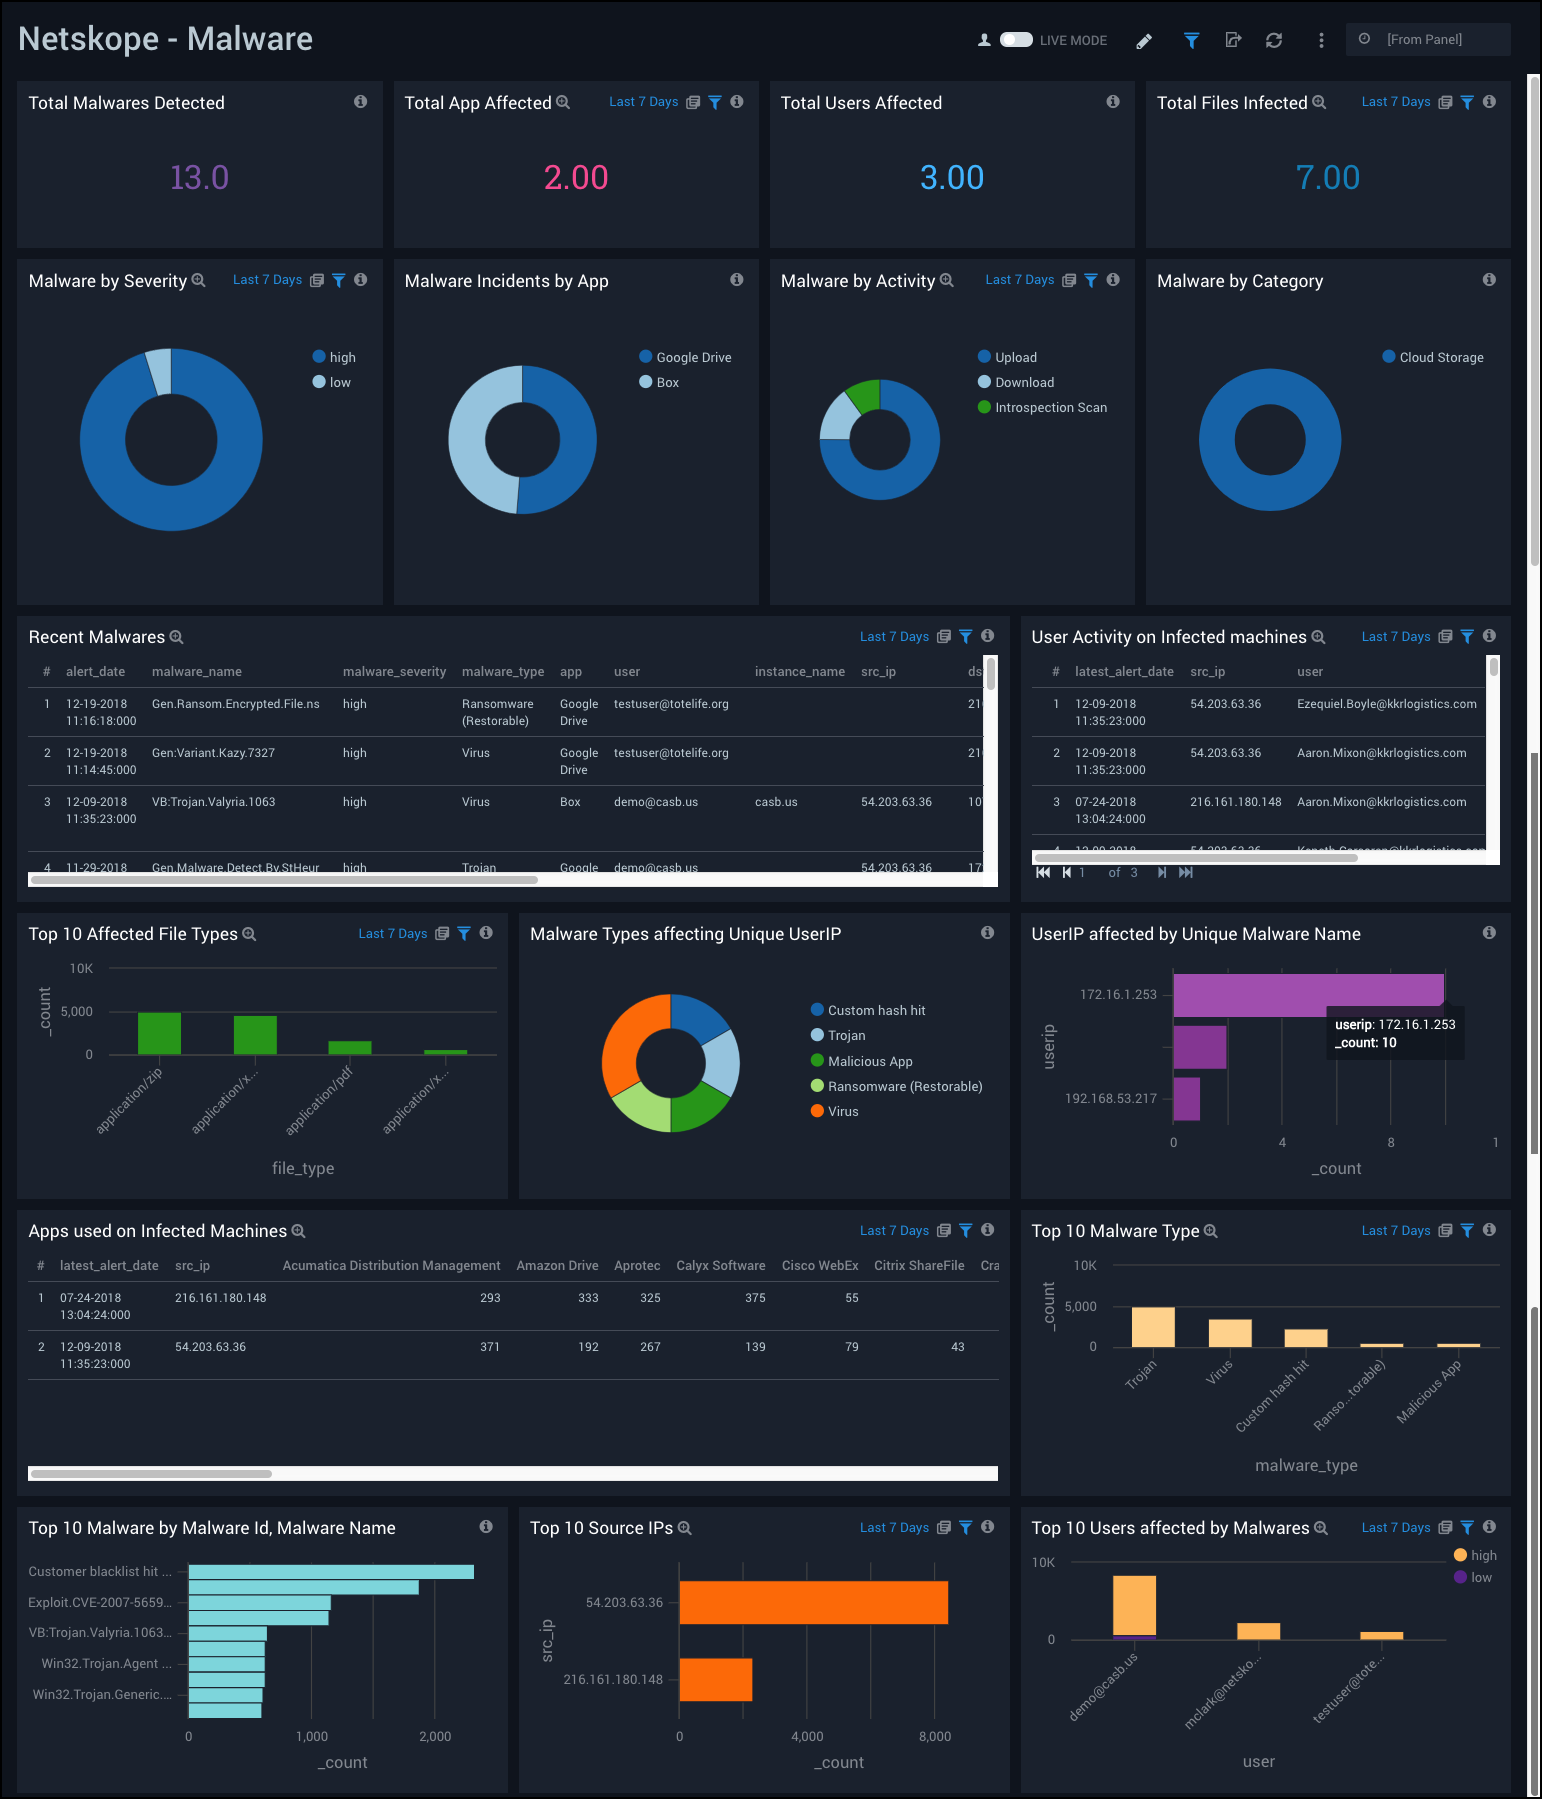
Malware
Netskope - Malware Dashboard provides a high-level view of total malwares detected, total apps and users affected, total files infected, top source IPs and malware types, and the top users affected. This dashboard also provides data malware incidents by app and severity, affected file types, apps used on infected machines, and the user activity on infected machines.
Use this dashboard to:
- Determine applications and users affected by malware.
- Monitor user activity on affected machines.
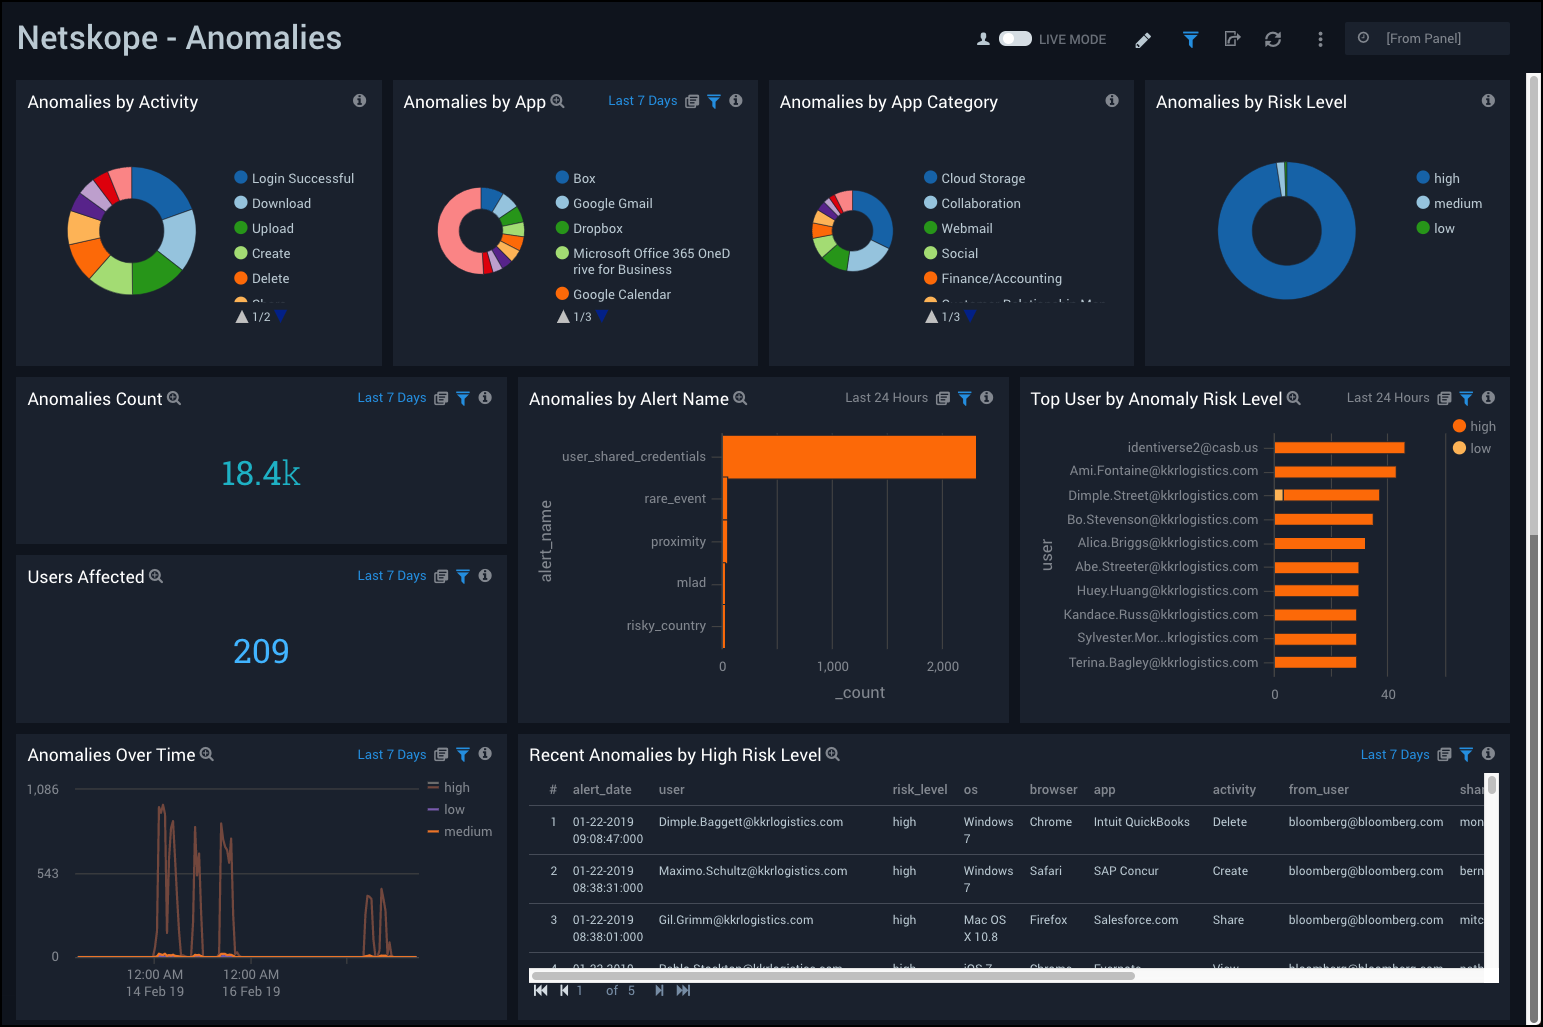
Anomalies
Netskope - Anomalies Dashboard provides an at-a-glance view of anomalies on your environment, including the number of anomalies, users affected, anomalies over time, anomalies by app, alert name, and risk level. It also includes data on top users by anomaly risk level and recent anomalies by high risk level.
Use this dashboard to:
- Monitor anomalies in users activities.
- Track anomalies with high risk levels.