Carbon Black Cloud
The Carbon Black Cloud App analyzes alert and event data from Endpoint Standard and Enterprise EDR products and provides comprehensive visibility into the security posture of your endpoints, enabling you to determine the effects of breaches in your environment. The app provides visibility into key endpoint security data with preconfigured dashboards for alerts, threats intelligence, feeds, sensors, alerts, users, hosts, processes, IOCs, devices and network status.
Log Types
The Carbon Black Cloud App uses the following Carbon Black Cloud log types, which are set to the AWS S3 bucket sent by the Carbon Black Cloud Forwarder.
- Alert Data
- Event Data
Sample Log Messages
For sample log messages, see Data Samples section in VMware help.
Sample Queries
Endpoint Standard
_sourceCategory = Labs/CarbonBlackCloudAlerts
| json field=_raw "id", "alert_url" , "severity","category", "device_name","device_username", "target_value", "device_group", "threat_id", "device_os", "type", "status", "sensor_action", "process_name", "reason", "create_time" as alert_id, alert_url ,severity, category ,device_name, user,target_priority, device_group, incident_id, device_os, type, status, sensor_action, process_name, reason, create_time nodrop //s3
| where type ="CB_ANALYTICS"
| json "threat_indicators[*].ttps" as threatInfo_indicators nodrop
| extract field=threatInfo_indicators "\"(?<indicators>.*?)\"(,|\])" multi nodrop
| json field=_raw "threat_cause_actor_name", "threat_cause_threat_category", "threat_cause_reputation" as threat_actor, threat_category, threat_reputation nodrop
_sourceCategory = Labs/CarbonBlackCloudEvents
|json field=_raw "event_origin", "event_id", "event_description", "alert_id", "process_cmdline" as event_origin, event_id, event_description, alert_id, process_cmdline
| where event_origin="NGAV"
Enterprise EDR
_sourceCategory = Labs/CarbonBlackCloudEvents
|json field=_raw "event_origin",  "process_guid", "process_cmdline", "parent_cmdline", "process_username" as event_origin, process_guid, process_cmdline, parent_cmdline, process_username nodrop
| where event_origin="EDR"
_sourceCategory = Labs/CarbonBlackCloudAlerts
| json field=_raw "id", "alert_url" , "severity","category", "device_name","device_username", "target_value", "threat_id", "device_os", "type", "status", "process_name", "reason", "create_time" as alert_id, alert_url ,severity, category ,device_name, user,target_priority, incident_id, device_os, type, status, process_name, reason, create_time nodrop //s3
| where type ="WATCHLIST"
| json "threat_indicators[*].ttps" as threatInfo_indicators nodrop
| extract field=threatInfo_indicators "\"(?<indicators>.*?)\"(,|\])" multi nodrop
| json field=_raw "threat_cause_actor_name", "threat_cause_threat_category", "threat_cause_reputation", "ioc_hit" as threat_actor, threat_category, threat_reputation, ioc_hit nodrop
Collecting Logs for Carbon Black Cloud
This section has instructions for configuring collection of Carbon Black Cloud event and alert logs. In the steps that follow, you'll set up two Sumo Logic S3 Sources, each of which will collect logs from an S3 bucket, and configure Carbon Black Cloud to send alert and event data to the S3 buckets.
Step 1: Create S3 bucket
In this step, use the AWS Console to create an S3 bucket. Make a note of the name of the bucket name. Later in this procedure, you'll configure Carbon Black Data Forwarders to send logs to the bucket.
Step 2: Create Sumo Logic S3 Sources
In this step, you create two S3 Sources to collect logs from the S3 bucket you created in the previous step. One source will collect event logs from the bucket, the other source will collect alert logs.
As a prerequisite, Grant Sumo Logic access to the S3 bucket.
S3 Source for event logs
Follow these steps to set up an S3 Source to collect event logs from your S3 bucket. (For detailed instruction on S3 Source configuration options, see AWS S3 Source.
In Sumo Logic select Manage Data > Collection > Collection.
On the Collectors page, click Add Source next to a Hosted** **Collector, either an existing Hosted Collector, or one you have created for this purpose.
Select Amazon S3.
Enter a name for the new Source. A description is optional.
Select an S3 region or keep the default value of Others. The S3 region must match the appropriate S3 bucket created in your Amazon account.
Use AWS versioned APIs? Select No
Bucket Name. Enter the exact name of the S3 bucket you created above.
Path Expression. Enter:
events/*Collection should begin. Choose or enter how far back you'd like to begin collecting historical logs.
For Source Category, enter any string to tag the output collected from this Source. (Category metadata is stored in a searchable field called _sourceCategory.) Make a note of the Source Category you assign; you will need it when you install the the Carbon Black Cloud App.
For AWS Access you have two Access Method options. Select Role-based access or Key access based on the AWS authentication you are providing. Role-based access is preferred, this was completed in the prerequisite step Grant Sumo Logic access to an AWS Product.
For Role-based access, enter the Role ARN that was provided by AWS after creating the role.
For Key access enter the Access Key ID and Secret Access Key. See AWS Access Key ID and AWS Secret Access Key for details.
S3 Source for alert logs
Follow the steps in S3 Source for event logs above to create another S3 source that will collect alert logs from the S3 bucket. When creating the source, assign it its own source category value, and set the Path Expression to: alerts/*
Step 3: Configure Carbon Black Cloud to send alert and event logs to S3
In this step you configure two Carbon Black Data Forwarders to push event and alert logs to S3.
To configure the Data Forwarders, follow the instructions in VMware help.
When you configure a Data Forwarder, you supply an S3 bucket name and an S3 prefix. For both the forwarders specify the same S3 bucket—the one you created above. The value for the S3 prefix is different for each forwarder:
- For the event forwarder, set S3 prefix to
events/ - For the alert forwarder, set S3 prefix to
alerts/
Please carefully evaluate this information to assure that your configuration reflects the data set you would like to send to Sumo Logic.
Installing the Carbon Black Cloud App
Now that you have set up collection for Carbon Black Cloud, install the Sumo Logic App.
- From the App Catalog, search for and select the app.
- To install the app, click Add Integration.
- On the Select Data Source for your App page:
- Carbon Black Cloud Alert Data Source. Enter the Source Category you assigned to the S3 source that collects alert logs.
- Carbon Black Cloud Event Data Source. Enter the Source Category you assigned to the S3 source that collects event logs.
- Folder Name. This field displays the name of the folder where the app will be installed. If desired, you can change the name of the folder. You can also browse to and select a parent folder where the app folder will be created.
- Click Next to install the app in the selected location.
Once the app is installed, it will appear in the folder that you specified. From here, you can share it with your organization. See Welcome to the New Library for information on working with the library in the new UI.
Panels will start to fill automatically. It's important to note that each panel slowly fills with data matching the time range query and received since the panel was created. Results won't immediately be available, but with a bit of time, you'll see full graphs and maps.
Viewing Carbon Black Cloud Dashboards
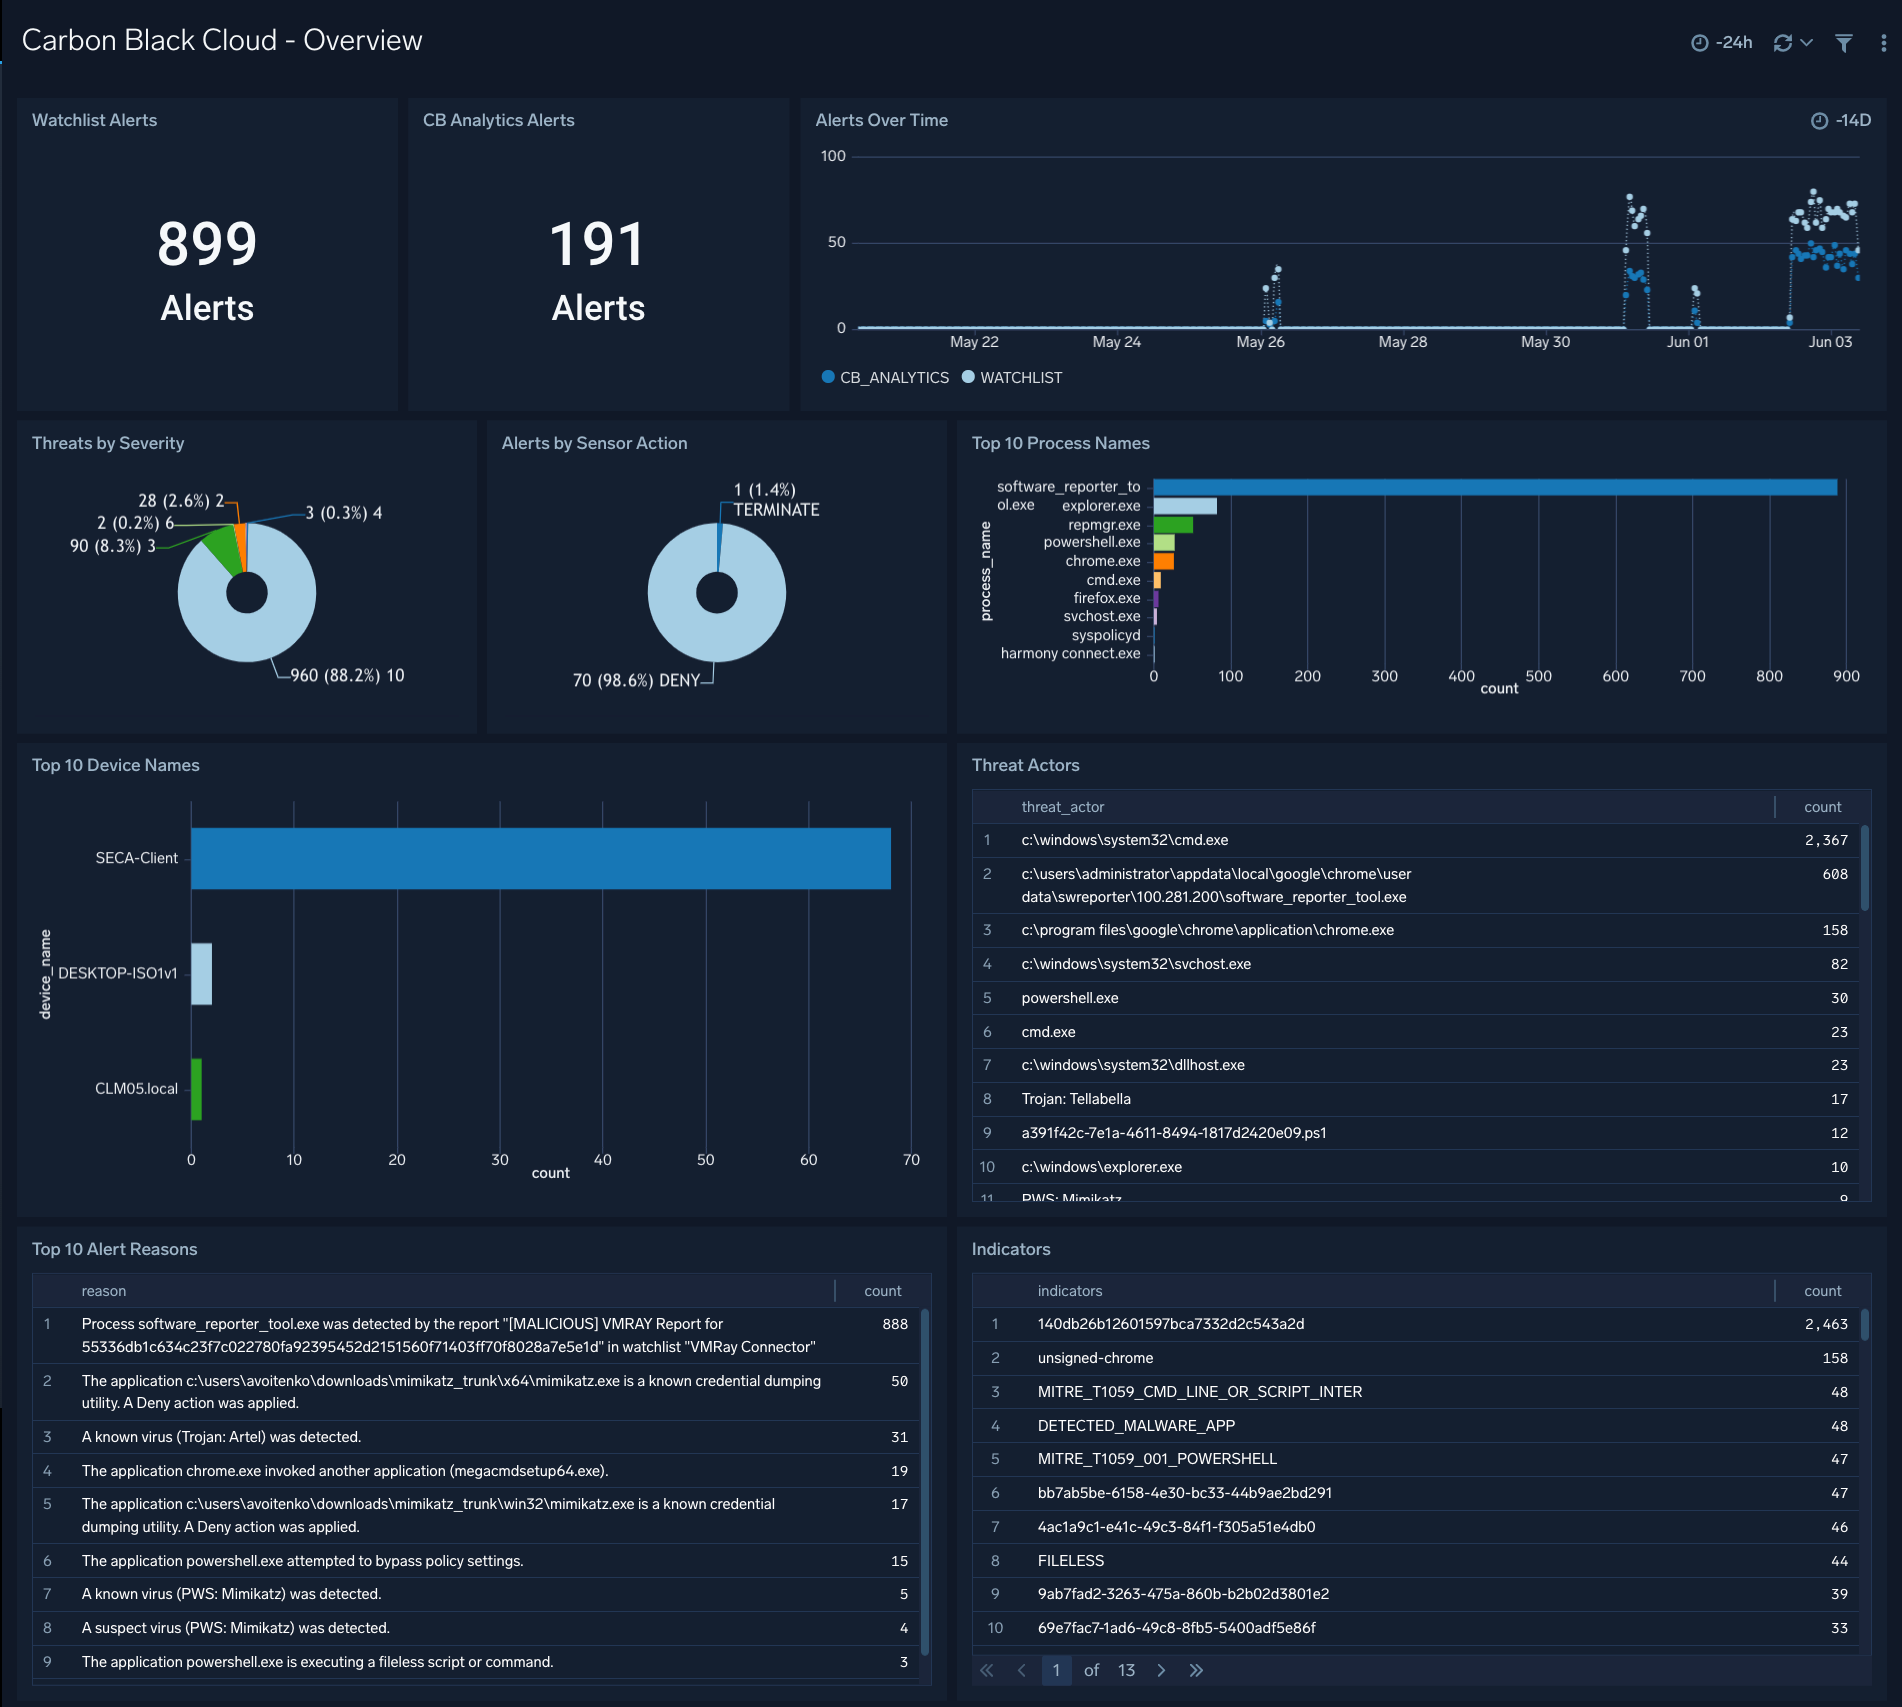
Overview
The Carbon Black Cloud - Overview dashboard provides a high-level view of the state of your network infrastructure and systems. The panels highlight detected threats, hosts, top feeds and IOC’s, top processes, top watchlists, and alert trends.
Use this dashboard to:
- Monitor potential threats.
- Determine the top processes and threat indicators.
- Track alerts.
- Monitor hosts, users, watchlists and feeds.
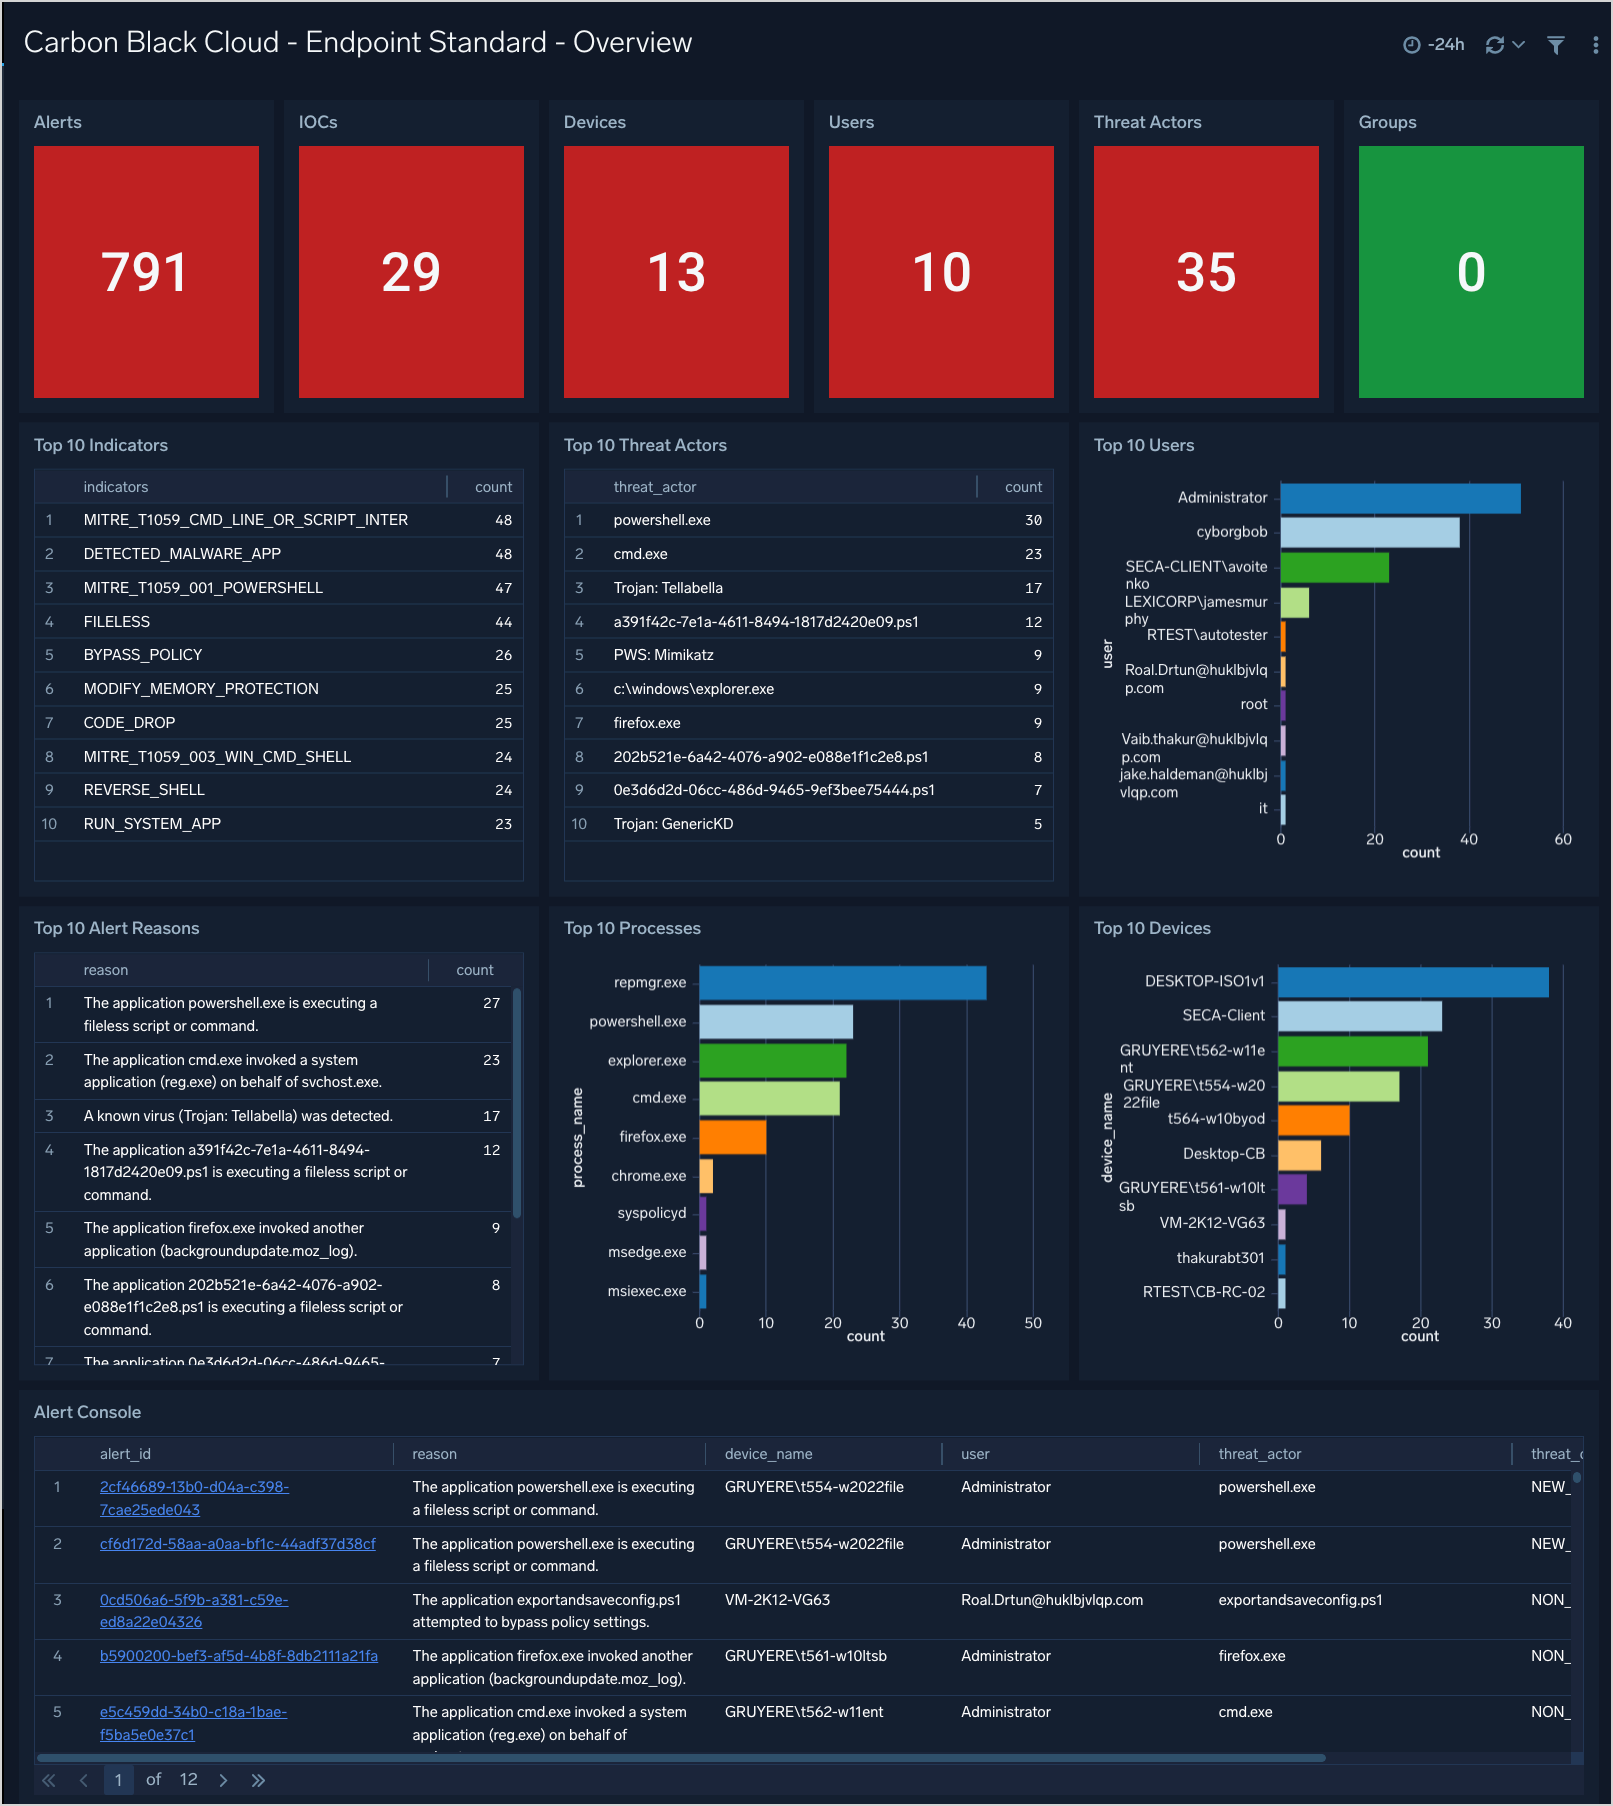
Endpoint Standard - Overview
The Carbon Black Cloud - Endpoint Standard - Overview dashboard gives a quick overview of the Alerts, devices and TTPs.
Use this dashboard to:
- See a count of items of interest (Devices, Alerts, TTPs, etc.)
- An overview of top users, processes, and devices
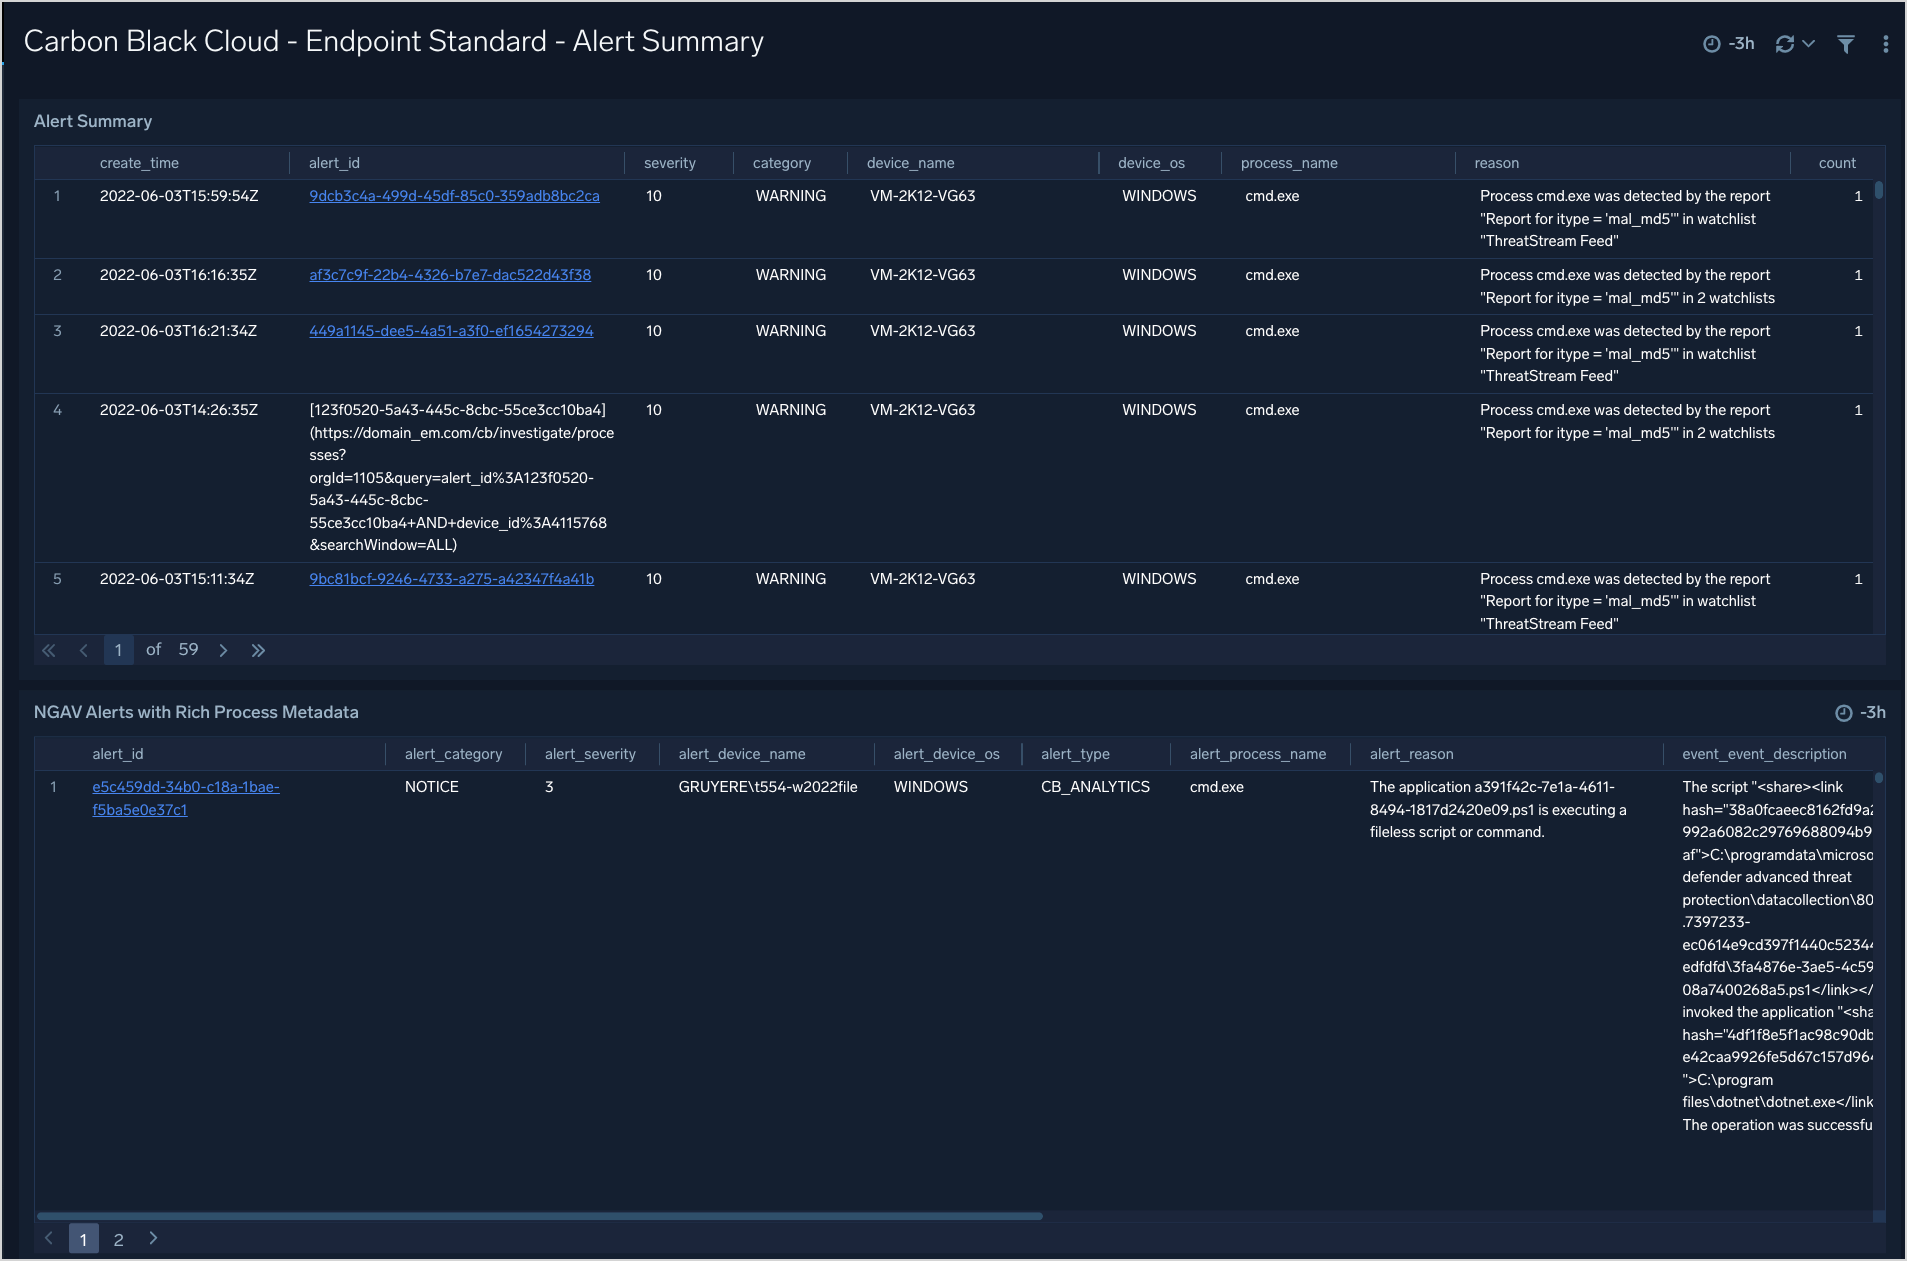
Endpoint Standard - Alert Summary
The Carbon Black Cloud - Endpoint Standard - Alert Summary gives you summary of alerts in table format, and provides enriched data by correlating alerts with events metadata.
Endpoint Standard - Alerts
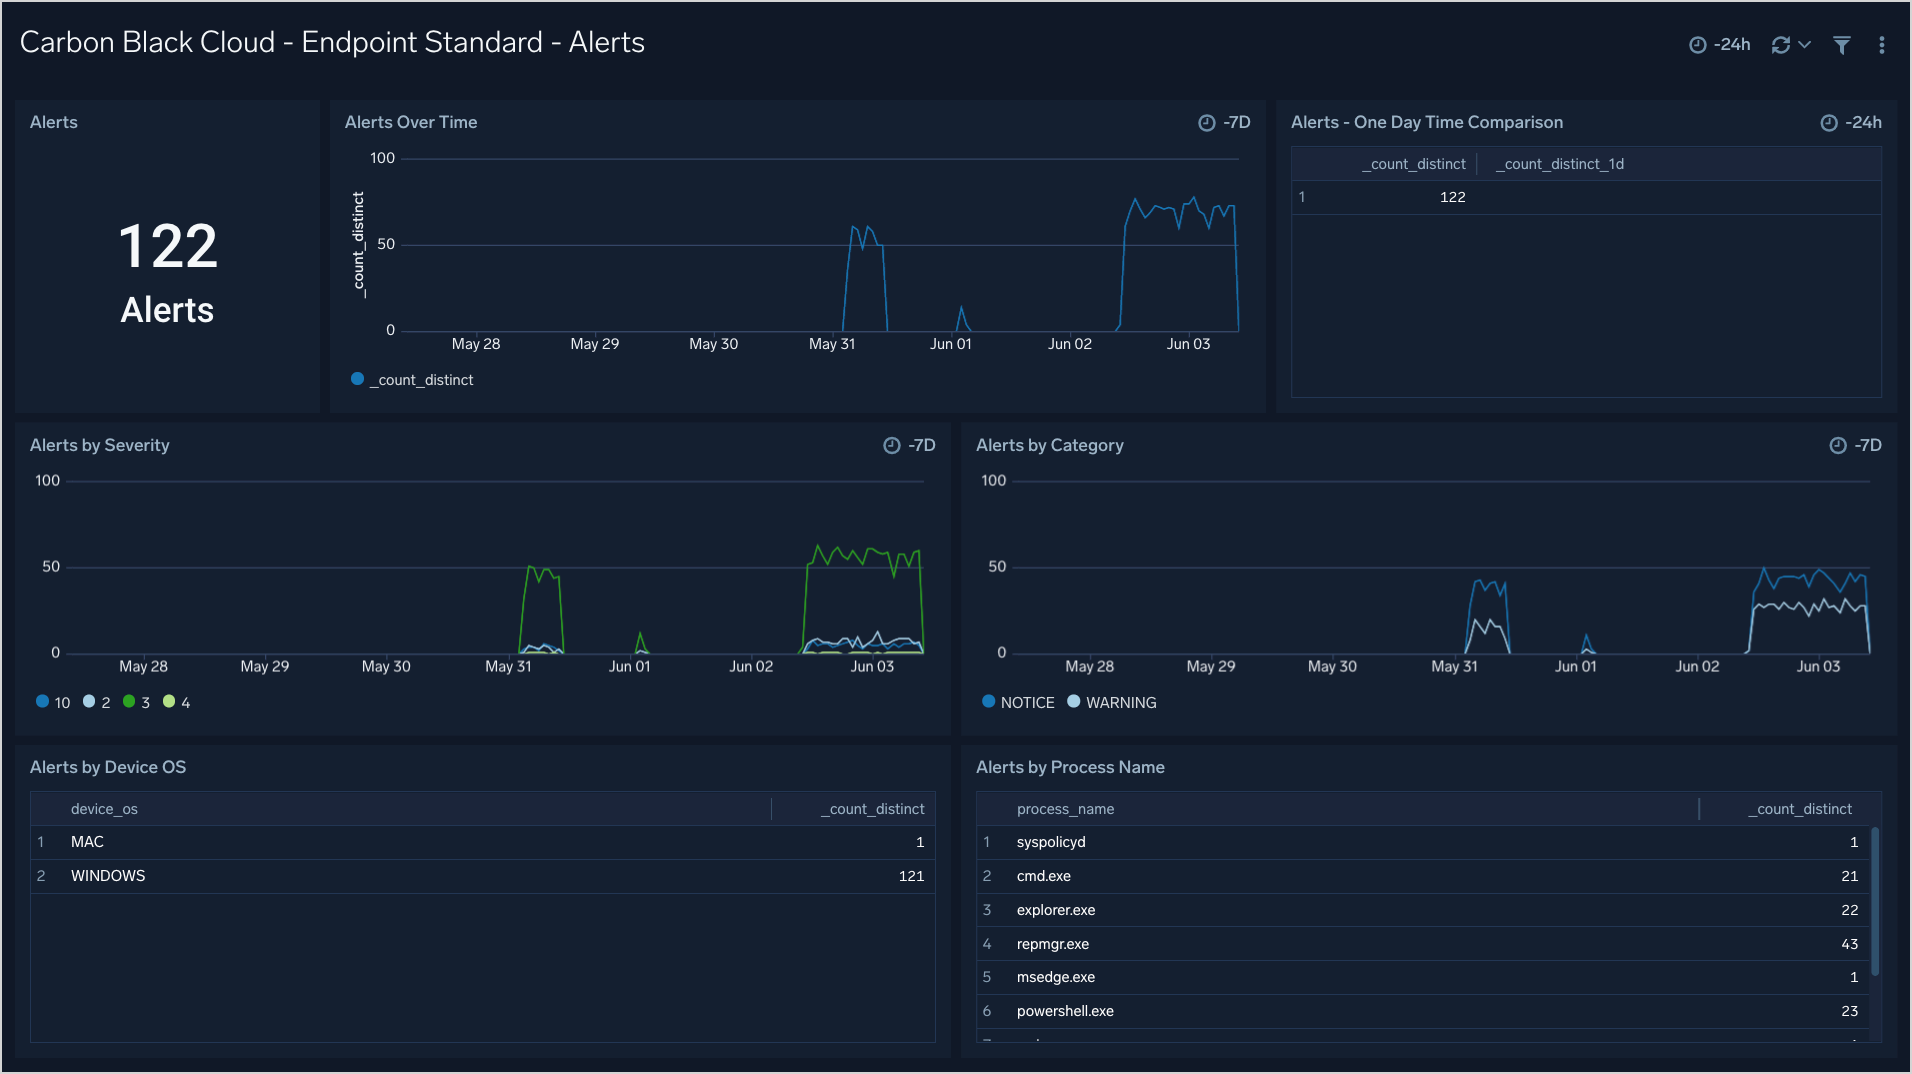
The Carbon Black Cloud - Endpoint Standard - Alerts dashboard provides insight into the Alert trends over time.
Use this dashboard to:
- See Alert trends over time by severity and category
- Top Alerted processes
- Alerts by OS

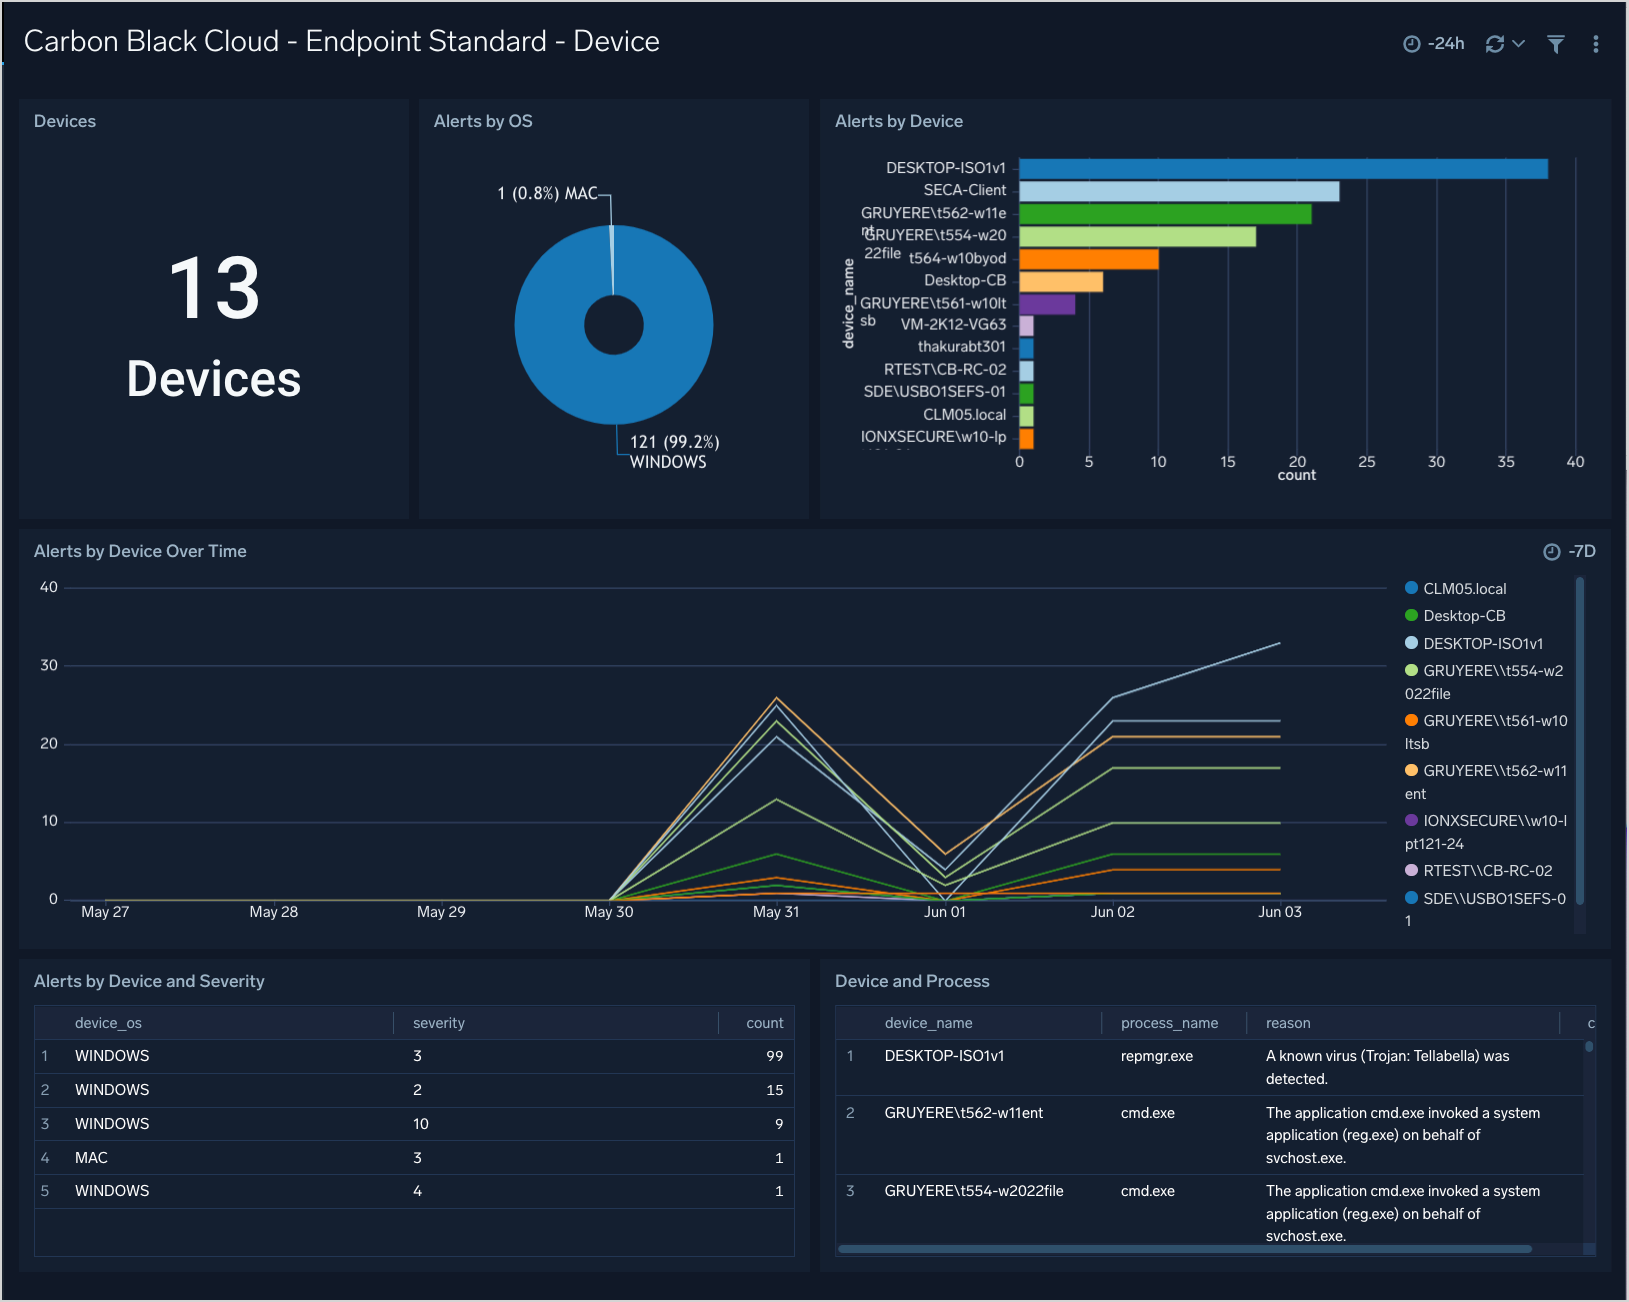
Endpoint Standard - Device
The Carbon Black Cloud - Endpoint Standard - Device dashboard gives an overview of the top alerting devices with breakdowns by OS and process.
Use this dashboard to:
- See top devices by Alerts
- See Alerts by device over time
- See a breakdown of devices by OS and Process counts
Endpoint Standard - TTPs
The Carbon Black Cloud - Endpoint Standard - TTPs dashboard provides a high level overview of the TTPs with breakdowns by TTP, Severity, Device, Process, and Threat Actors.
Use this dashboard to:
- See which TTPs are the most prevalent
- Identify any spikes in malicious activity
- Help tune new policies and reduce false positives
Enterprise EDR - Overview
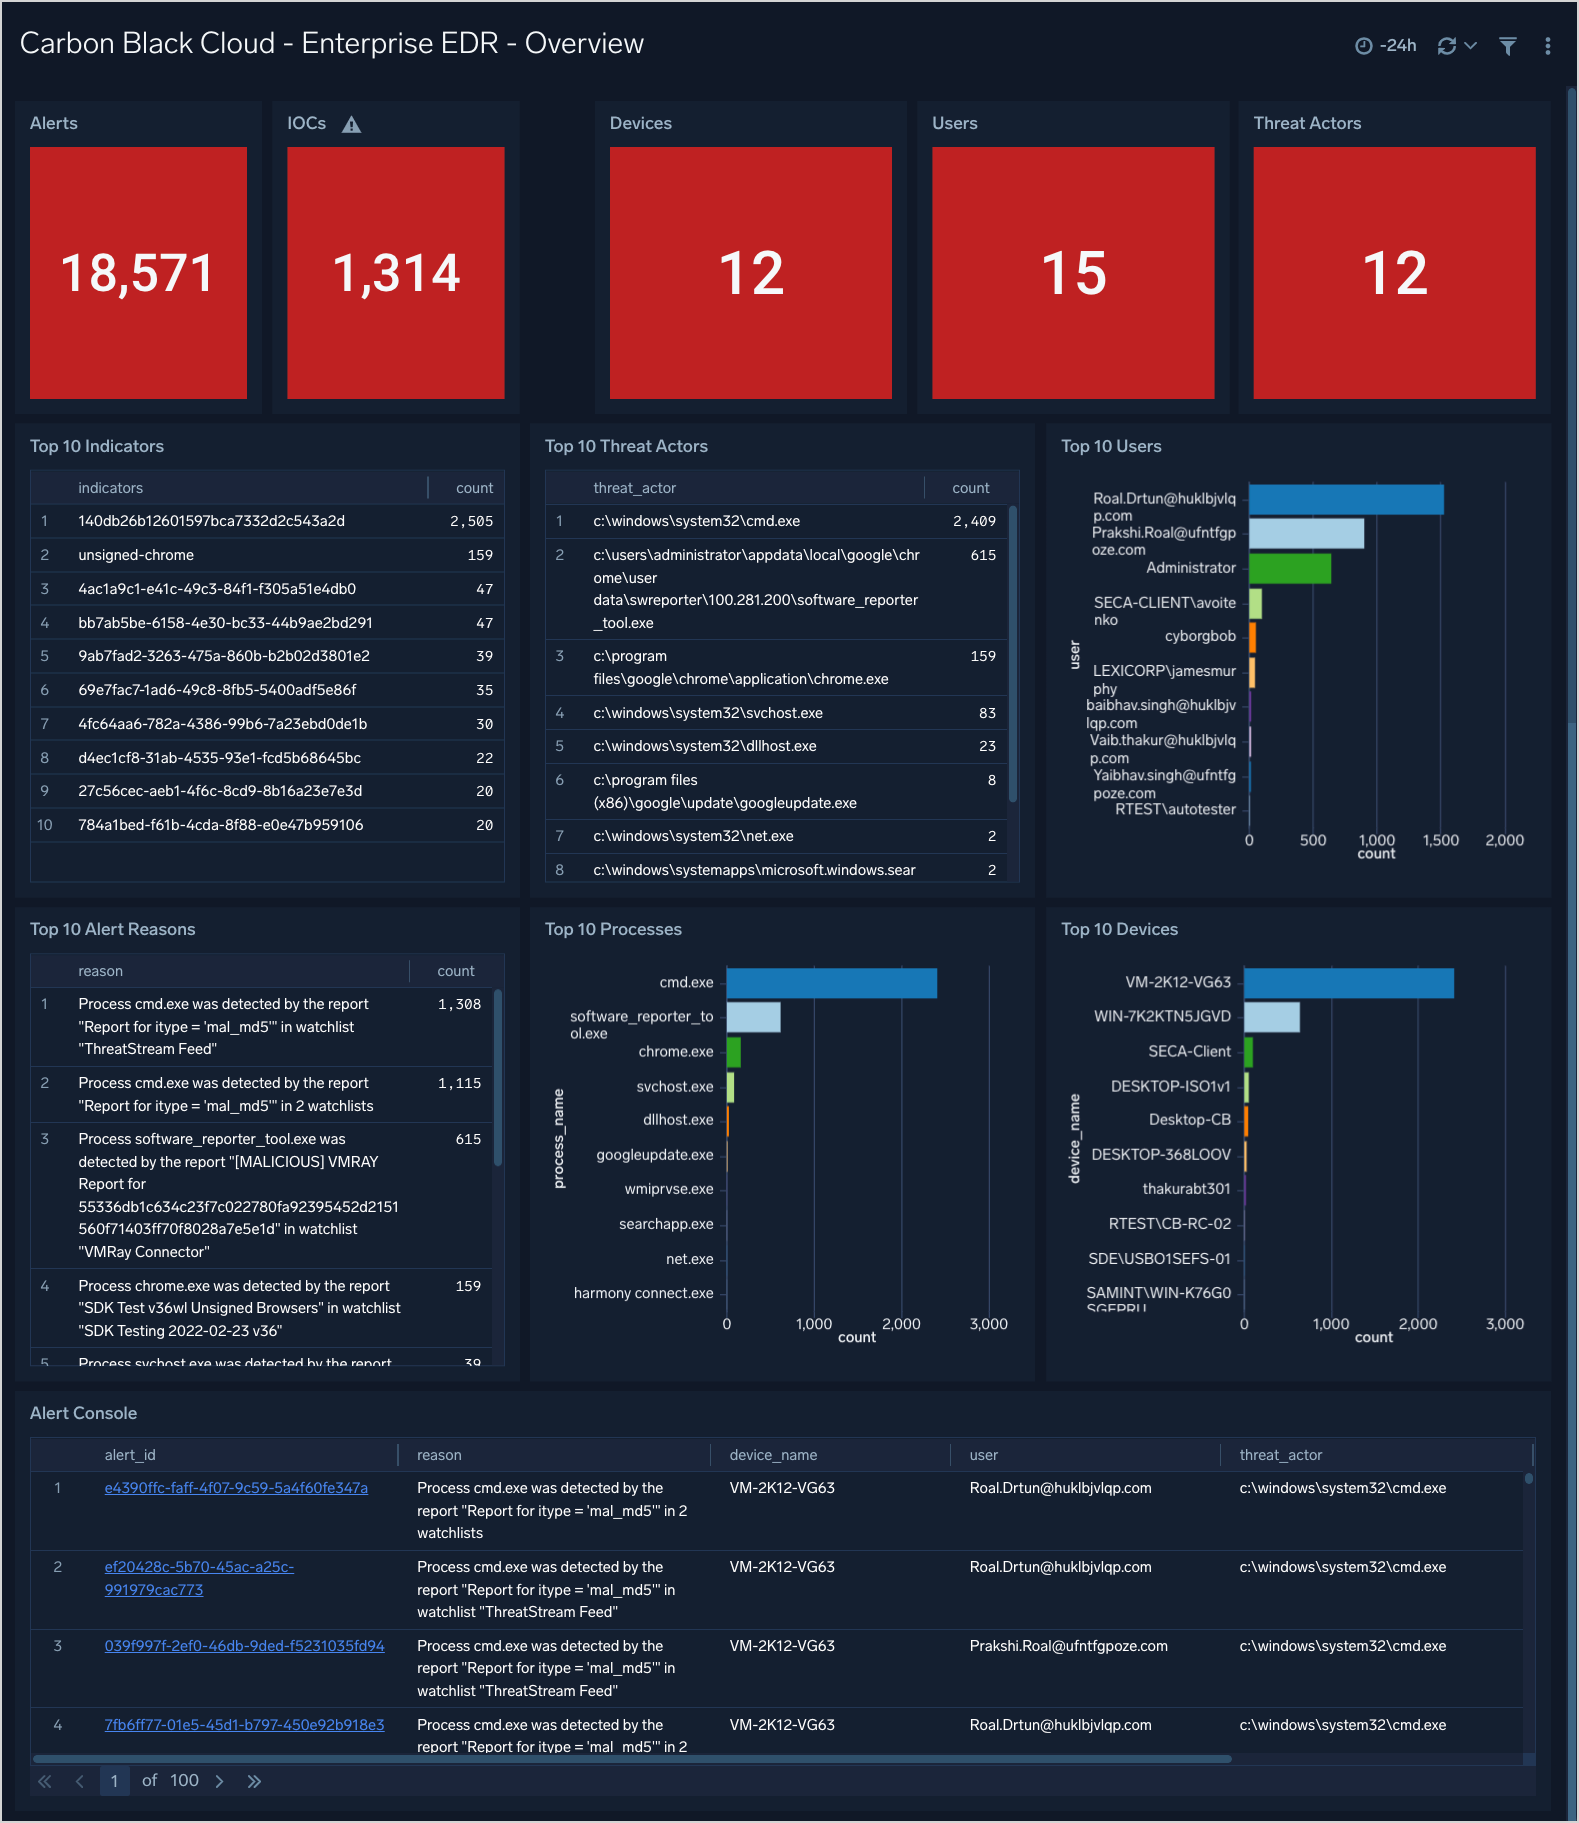
The Carbon Black Cloud - Enterprise EDR - Overview dashboard gives a quick overview of the Alerts, devices and IOCs.
Use this dashboard to:
- See a count of items of interest (Devices, Alerts, IOCs, etc.)
- An overview of top users, processes, and devices
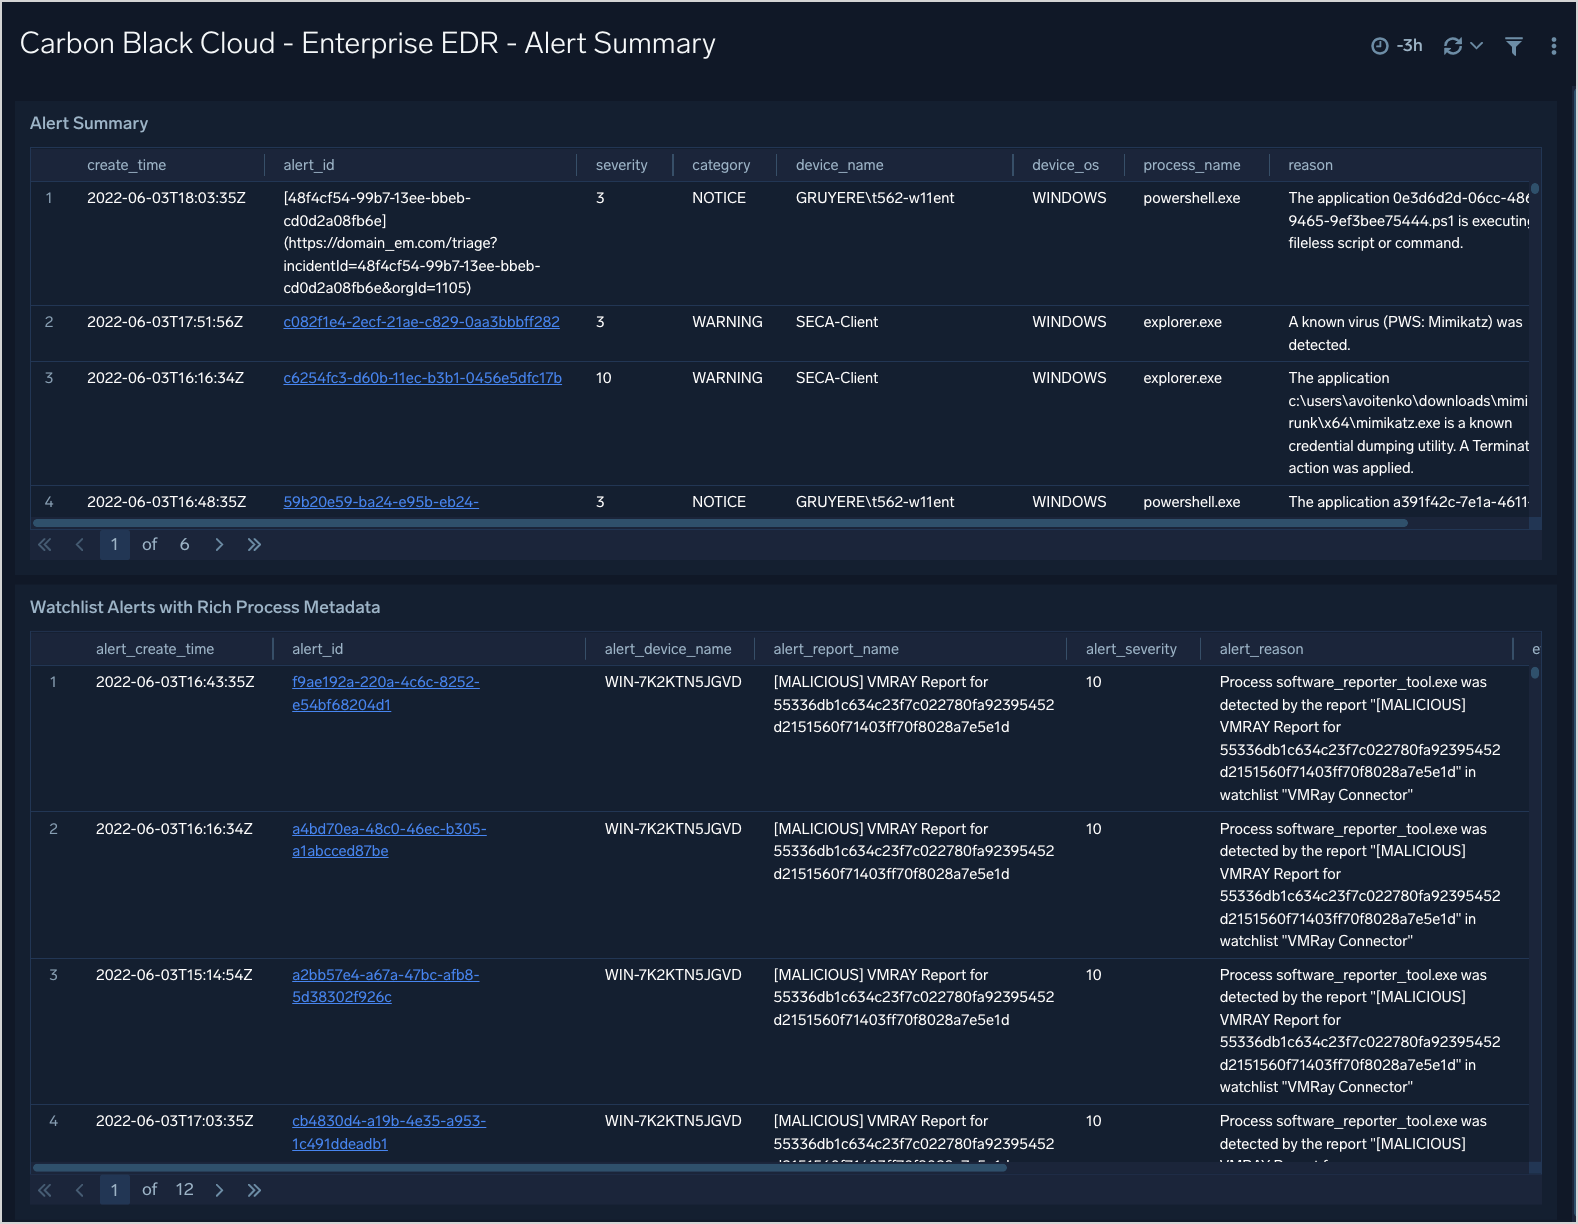
Enterprise EDR - Alert Summary
The Carbon Black - EDR - Alert Summary dashboard provides detailed information on the alerts in your environment, including alerts by mode, OS, report, and groups. The panels also show alert trends, recent alerts, and top users.
Use this dashboard to:
- Monitor alert activity and identify spikes.
- Monitor alerts triggered after a critical issue.
- Track users who trigger a high number of alerts.
Enterprise EDR - Alerts
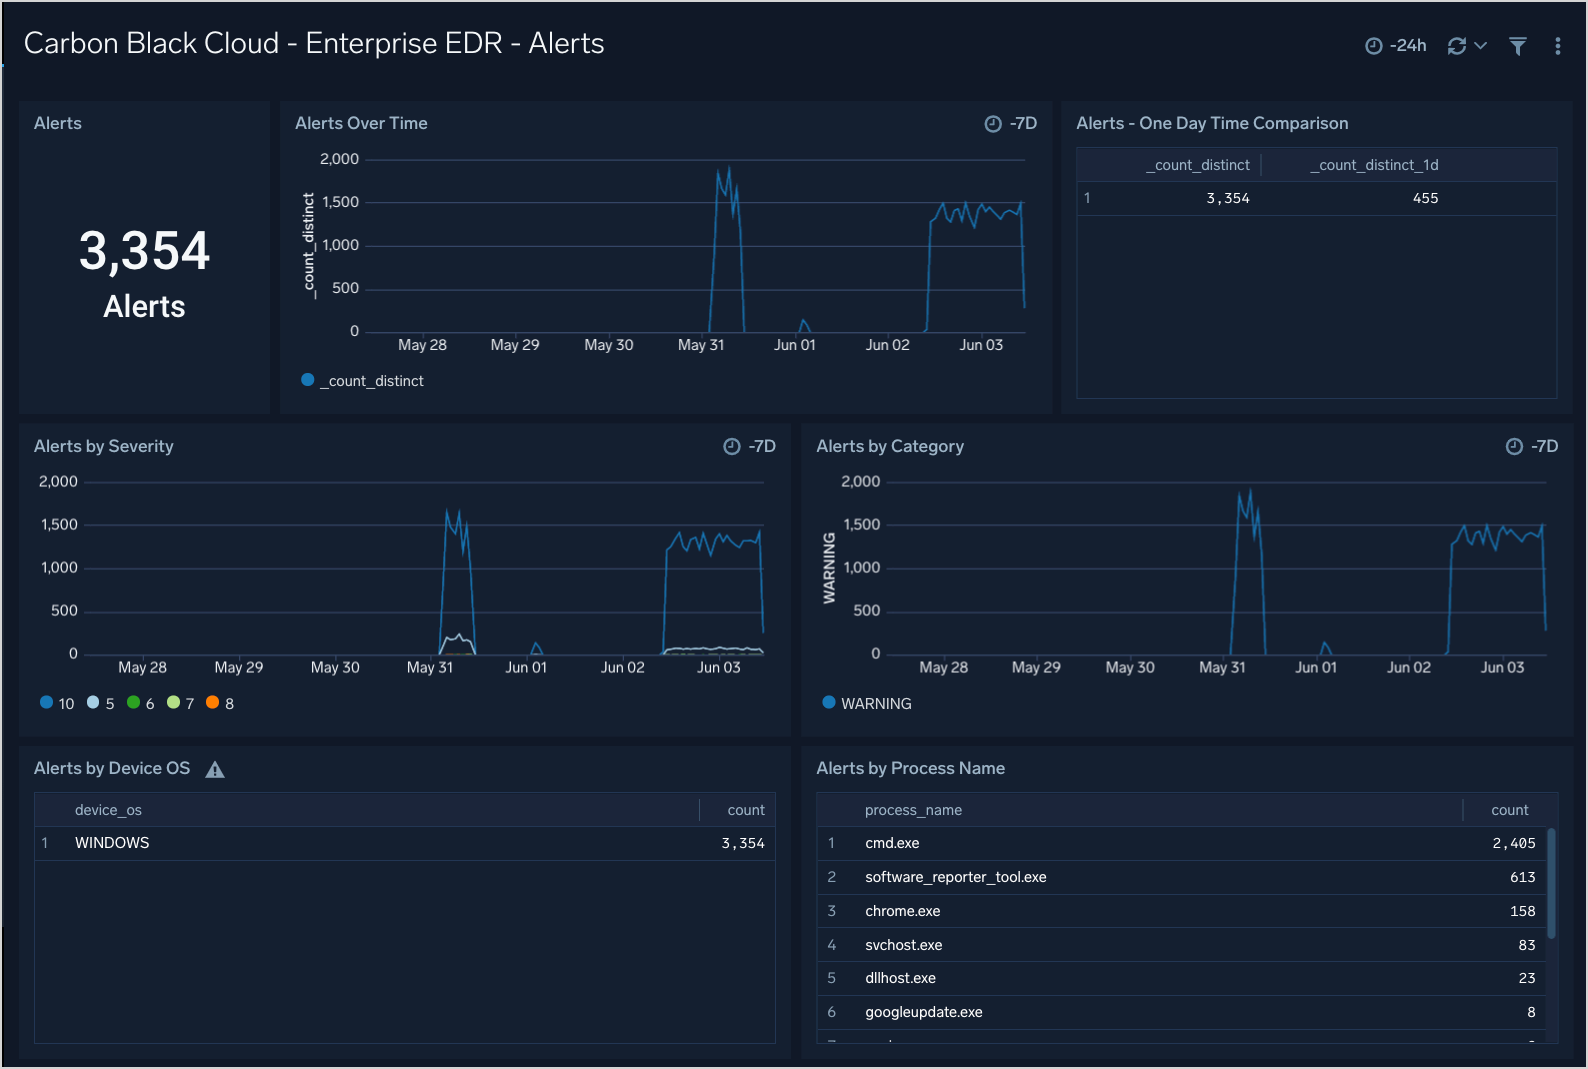
The Carbon Black Cloud - Enterprise EDR - Alerts dashboard provides insight into the Alert trends over time.
Use this dashboard to:
- See Alert trends over time by severity and category
- Top Alerted processes
- Alerts by OS
Enterprise EDR - Device
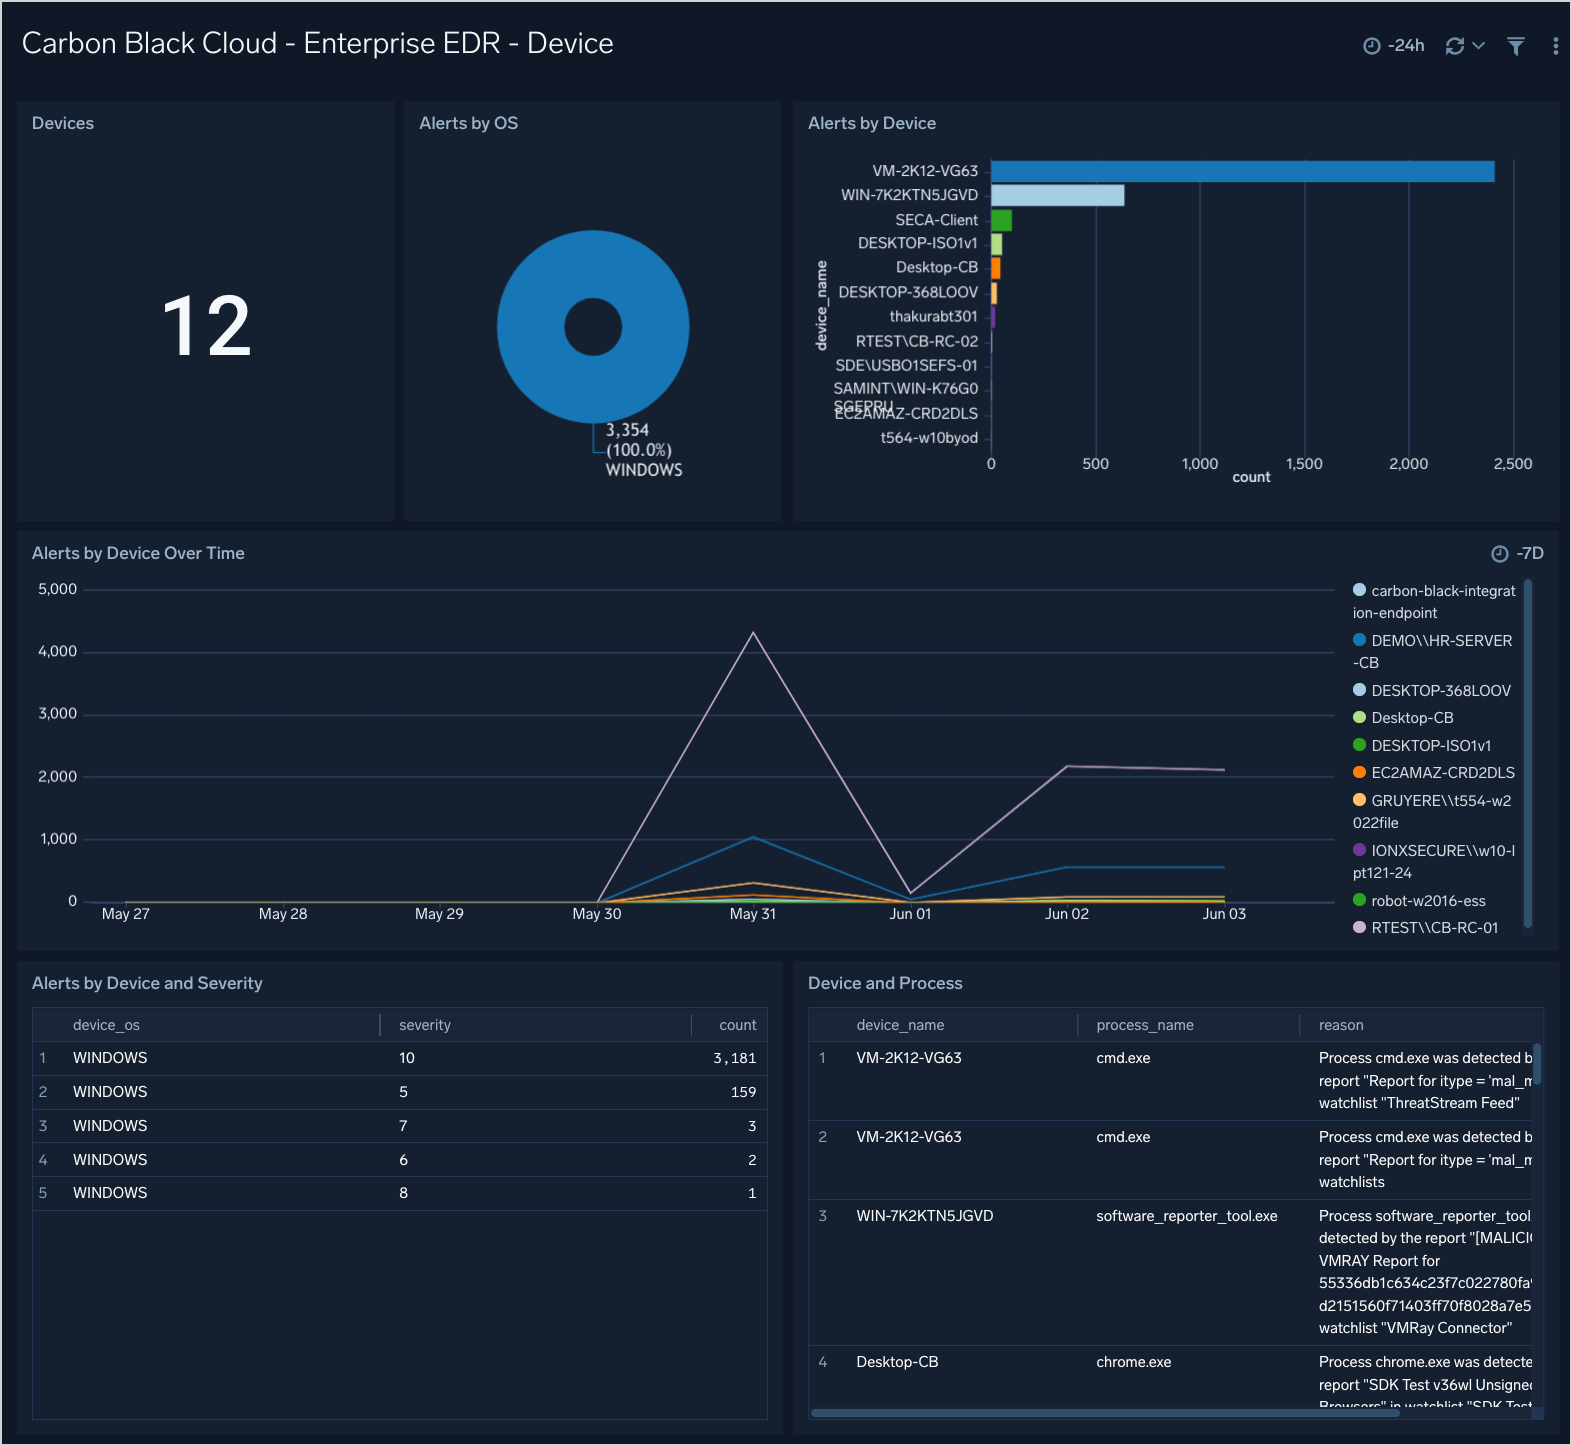
The Carbon Black Cloud - Enterprise EDR - Device dashboard gives an overview of the top alerting devices with breakdowns by OS and process.
Use this dashboard to:
- See top devices by Alerts
- See Alerts by device over time
- See a breakdown of devices by OS and Process counts
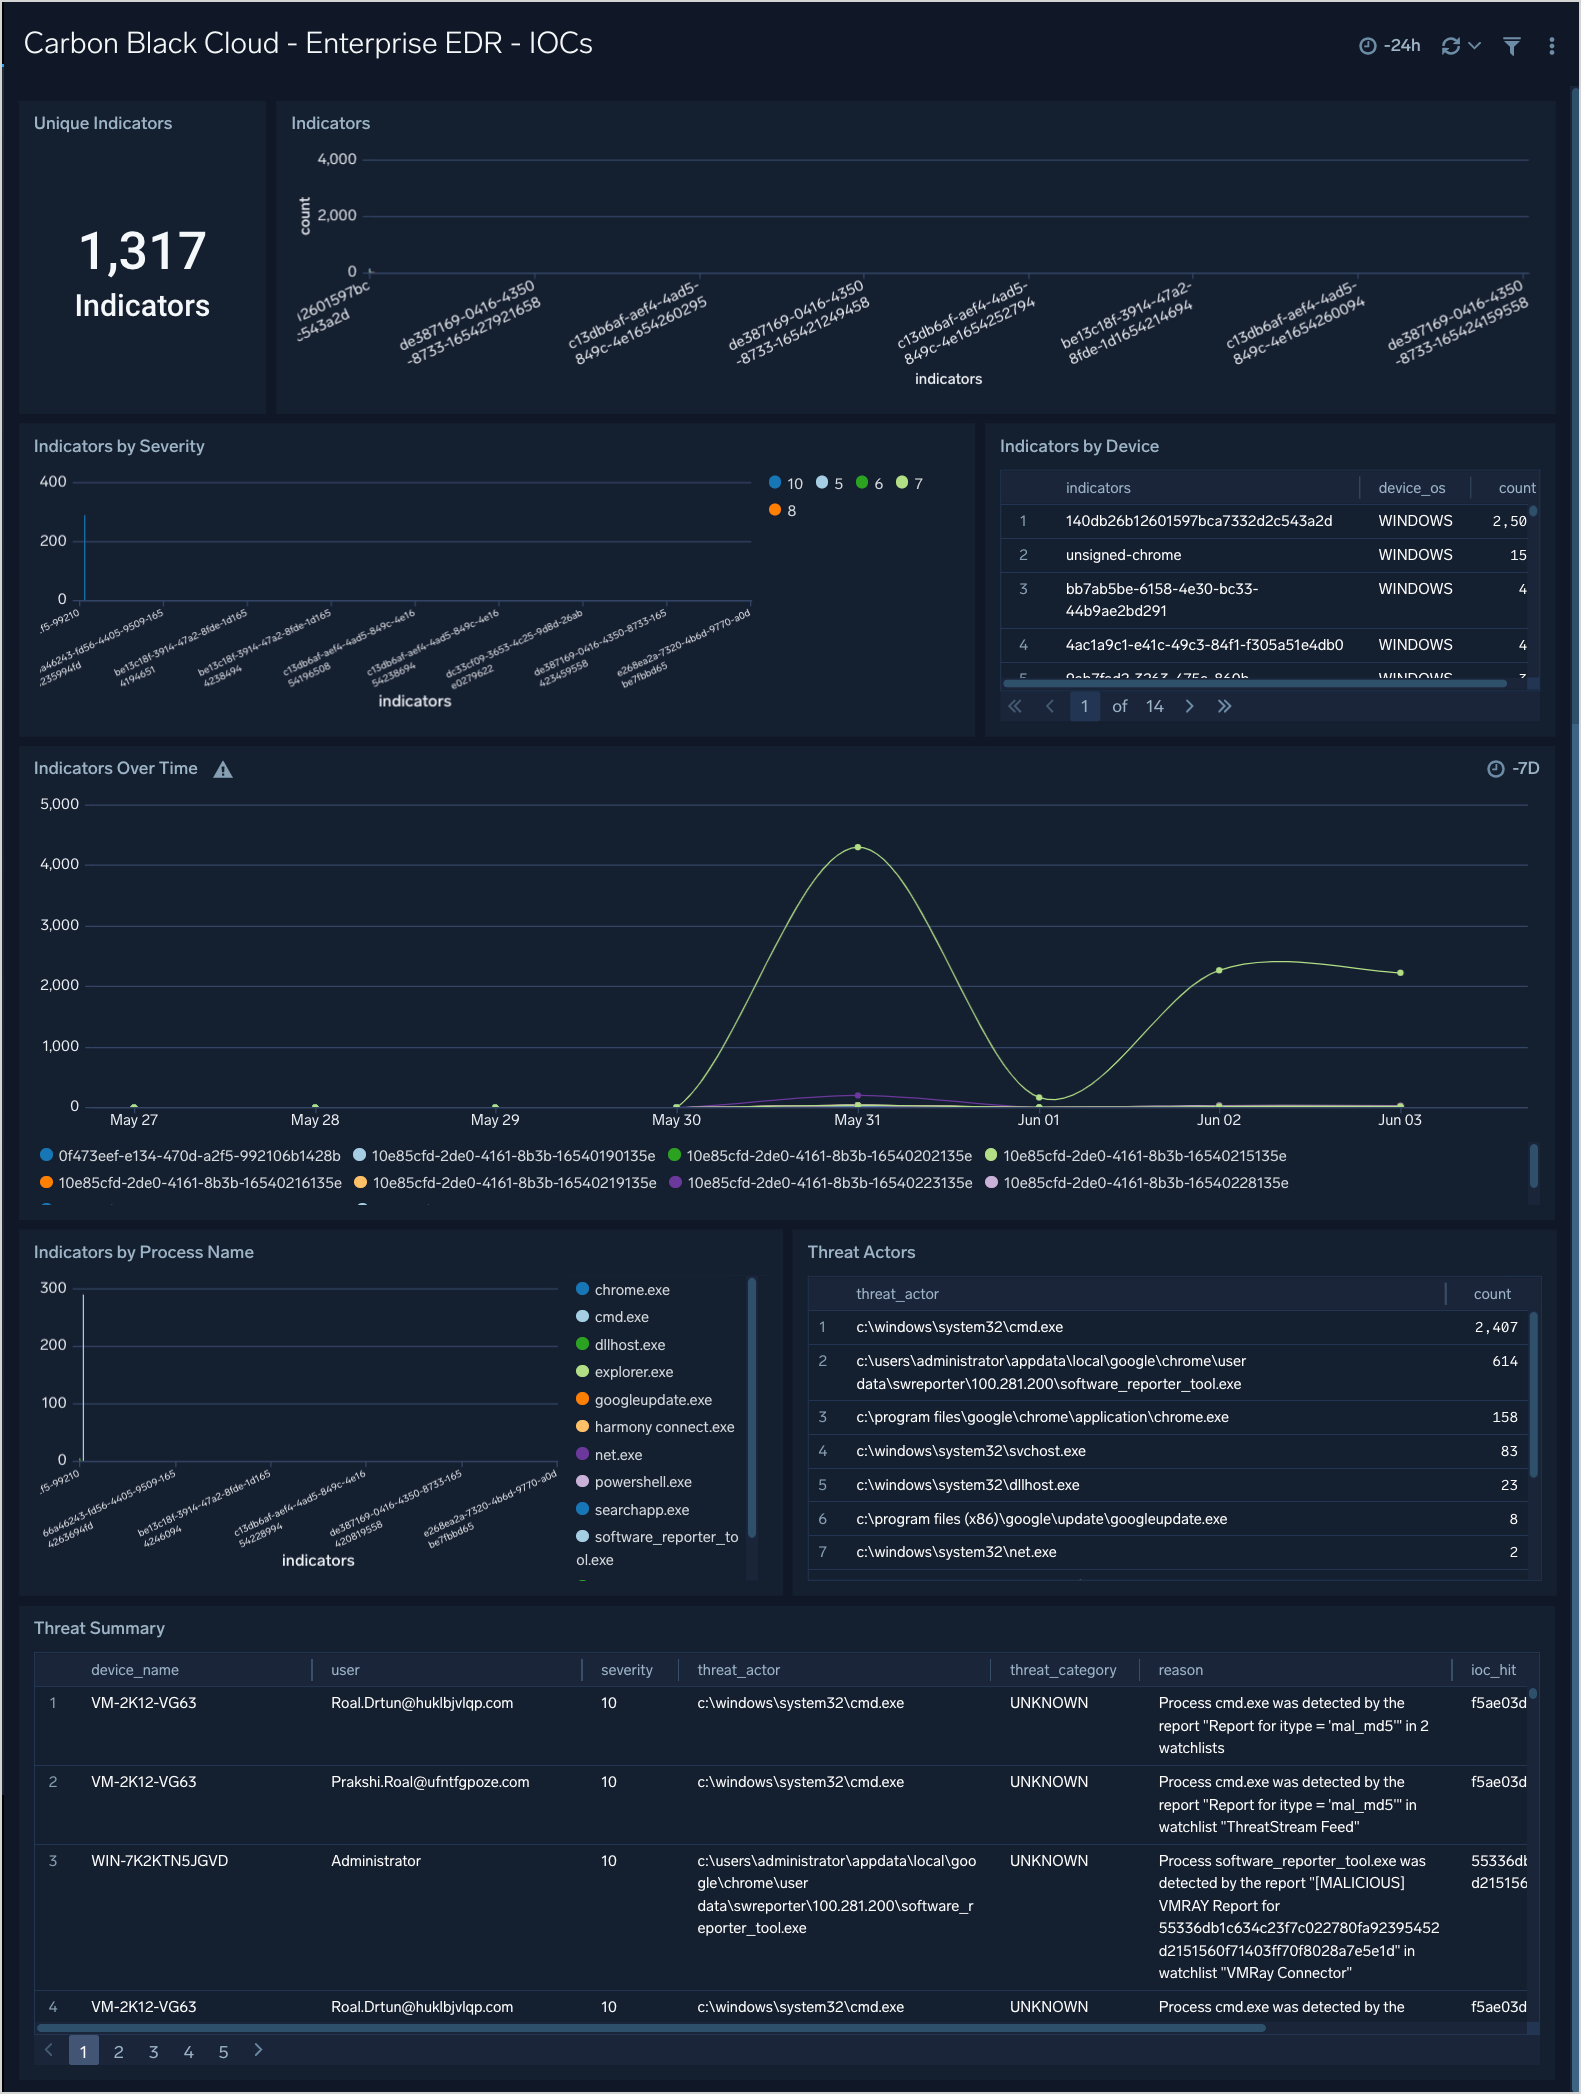
Enterprise EDR - IOCs
The Carbon Black Cloud - Enterprise EDR - IOCs dashboard provides a high level overview of the IOCs with breakdowns by IOC, Severity, Device, Process, and Threat Actors.
Use this dashboard to:
- See which indicators are the most prevalent
- Identify any spikes in malicious activity
- Help tune new policies and reduce false positives
