PagerDuty V2

The Sumo Logic App for PagerDuty V2 collects incident messages from your PagerDuty account via a webhook, and displays incident data in pre-configured Dashboards that allow you to monitor and analyze the activity of your PagerDuty account and Services. The Sumo Logic App for PagerDuty V2 uses Webhooks V2, to provide enhanced context for alert object models.
Event Types
The Sumo Logic App for PagerDuty V2 ingests PagerDuty incident Webhooks V2 messages, that are triggered by events that occur in your PagerDuty account and Services.
For more information on the incident messages supported in Webhooks V2, see the PagerDuty documentation: https://v2.developer.pagerduty.com/docs/webhooks-v2-overview
Sample Logs
For examples of incident.trigger, incident.acknowledge, incident.resolve, and incident.assign log messages, see the PagerDuty Webhooks V2 Examples page.
Sample Query
The following Top Altering Services query is shown on the PagerDuty V2 - Overview dashboard.
_sourceCategory=Labs/pagerduty_v2 "incident.trigger"
| parse regex "(?<event>\{\"event\":\"incident\..+?\}(?=,\{\"event\":\"incident\..+|\]\}$))" multi
| json  field=event "event","log_entries", "created_on", "incident", "webhook"
| json field=incident "id", "incident_number", "escalation_policy.summary", "service.name" , "impacted_services[*].summary", "status", "summary", "description", "title", "urgency", "teams[0].summary", "assignments[0].assignee.summary" as incident_id, incident_number, escalation_policy_name, alertedBy_service, impacted_service, incident_status, incident_summary, incident_description, incident_tittle, incident_urgency,  incident_team_involved, assigned_user
| where event = "incident.trigger"
| count by alertedBy_service
| order by _count
Collecting Logs for PagerDuty V2
This section provides instructions for configuring a Sumo Logic Hosted Collector and HTTP Source to create a PagerDuty Webhook V2, to collect PagerDuty events.
Configure a Sumo Logic Collector and Source
A Hosted Collector is not installed on a local system in your deployment. Instead, Sumo Logic hosts the Collector and its Sources in AWS. With a Hosted Collector, you can create Sources to collect data from various services. A single Hosted Collector can be configured with any number of Sources.
An HTTP Source is an endpoint for receiving log and metric data uploaded to a unique URL generated for the Source. The URL securely encodes the Collector and Source information. You can add as many HTTP Logs and Metrics Sources as you'd like to a single Hosted Collector.
To configure Hosted Collector and HTTP Source, do the following:
- Log in to Sumo Logic.
- Follow the instruction for configuring a Hosted Collector.
- Follow the instruction for configuring an HTTP Source.
Make sure to save the HTTP Source Address URL. You will be asked for this Endpoint URL when you configure the PagerDuty Webhook in the following procedure.
Create a PagerDuty V2 Webhook
Using PagerDuty with Webhooks V2, you receive HTTP callbacks when incident events occur in your PagerDuty account. Details about the events are then sent via HTTP to a URL that you specify.
To create a PagerDuty V2 Webhook, do the following:
- Log in to your PagerDuty account.
- Use the following instructions to create a Webhook V2: https://support.pagerduty.com/hc/en-us/articles/202830320-Webhooks-, entering the HTTP Source Address URL as the Endpoint URL in Step 6.
- Continue with installing the Sumo Logic App for PagerDuty V2.
Installing the PagerDuty V2 App
This section provides instructions for installing the Sumo App for PagerDuty V2, as well as the descriptions of each of the app dashboards.
Now that you have set up a log and metric collection, you can install the Sumo Logic App for PagerDuty V2, and use its pre-configured searches and dashboards.
Locate and install the app you need from the App Catalog. If you want to see a preview of the dashboards included with the app before installing, click Preview Dashboards.
- From the App Catalog, search for and select the app.
- Select the version of the service you're using and click Add to Library. Version selection is applicable only to a few apps currently. For more information, see the Install the Apps from the Library.
- To install the app, complete the following fields.
- App Name. You can retain the existing name, or enter a name of your choice for the app.
- Data Source. Select either of these options for the data source.
- Choose Source Category, and select a source category from the list.
- Choose Enter a Custom Data Filter, and enter a custom source category beginning with an underscore. Example: (
_sourceCategory=MyCategory).
- Advanced. Select the Location in Library (the default is the Personal folder in the library), or click New Folder to add a new folder.
- Click Add to Library.
Once an app is installed, it will appear in your Personal folder, or other folder that you specified. From here, you can share it with your organization.
Panels will start to fill automatically. It's important to note that each panel slowly fills with data matching the time range query and received since the panel was created. Results won't immediately be available, but with a bit of time, you'll see full graphs and maps.
Viewing PagerDuty v2 Dashboards
Template variables provide dynamic dashboards that can rescope data on the fly. As you apply variables to troubleshoot through your dashboard, you view dynamic changes to the data for a quicker resolution to the root cause. You can use template variables to drill down and examine the data on a granular level. For more information, see Filter with template variables.
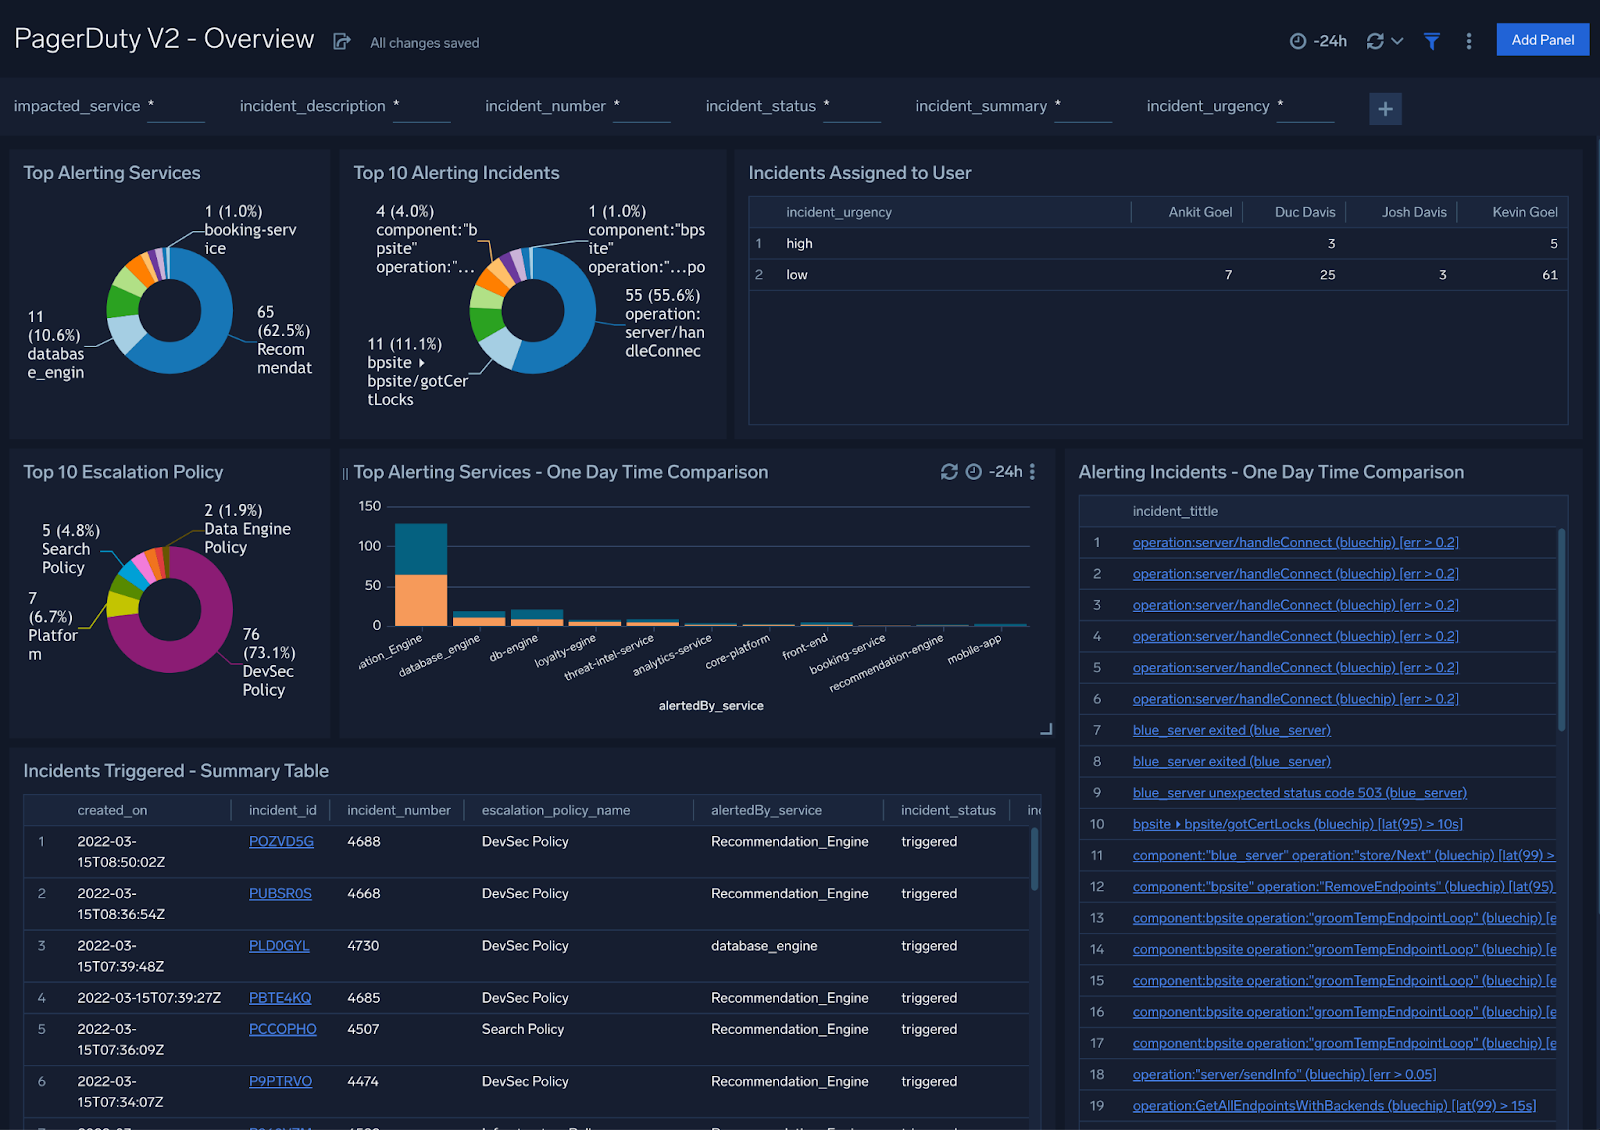
Overview
PagerDuty V2 - Overview Dashboard provides a high-level view of top alerts, triggered incidents summary, as well as a breakdown of per-user incident assignments and comparisons over a specified time interval.
Use this dashboard to:
- Review the services, incidents and policies that are causing the most alerts.
- Analyze detailed information on incidents using the Incident Summary panel.
- Drill down to examine data on a granular level with filters.
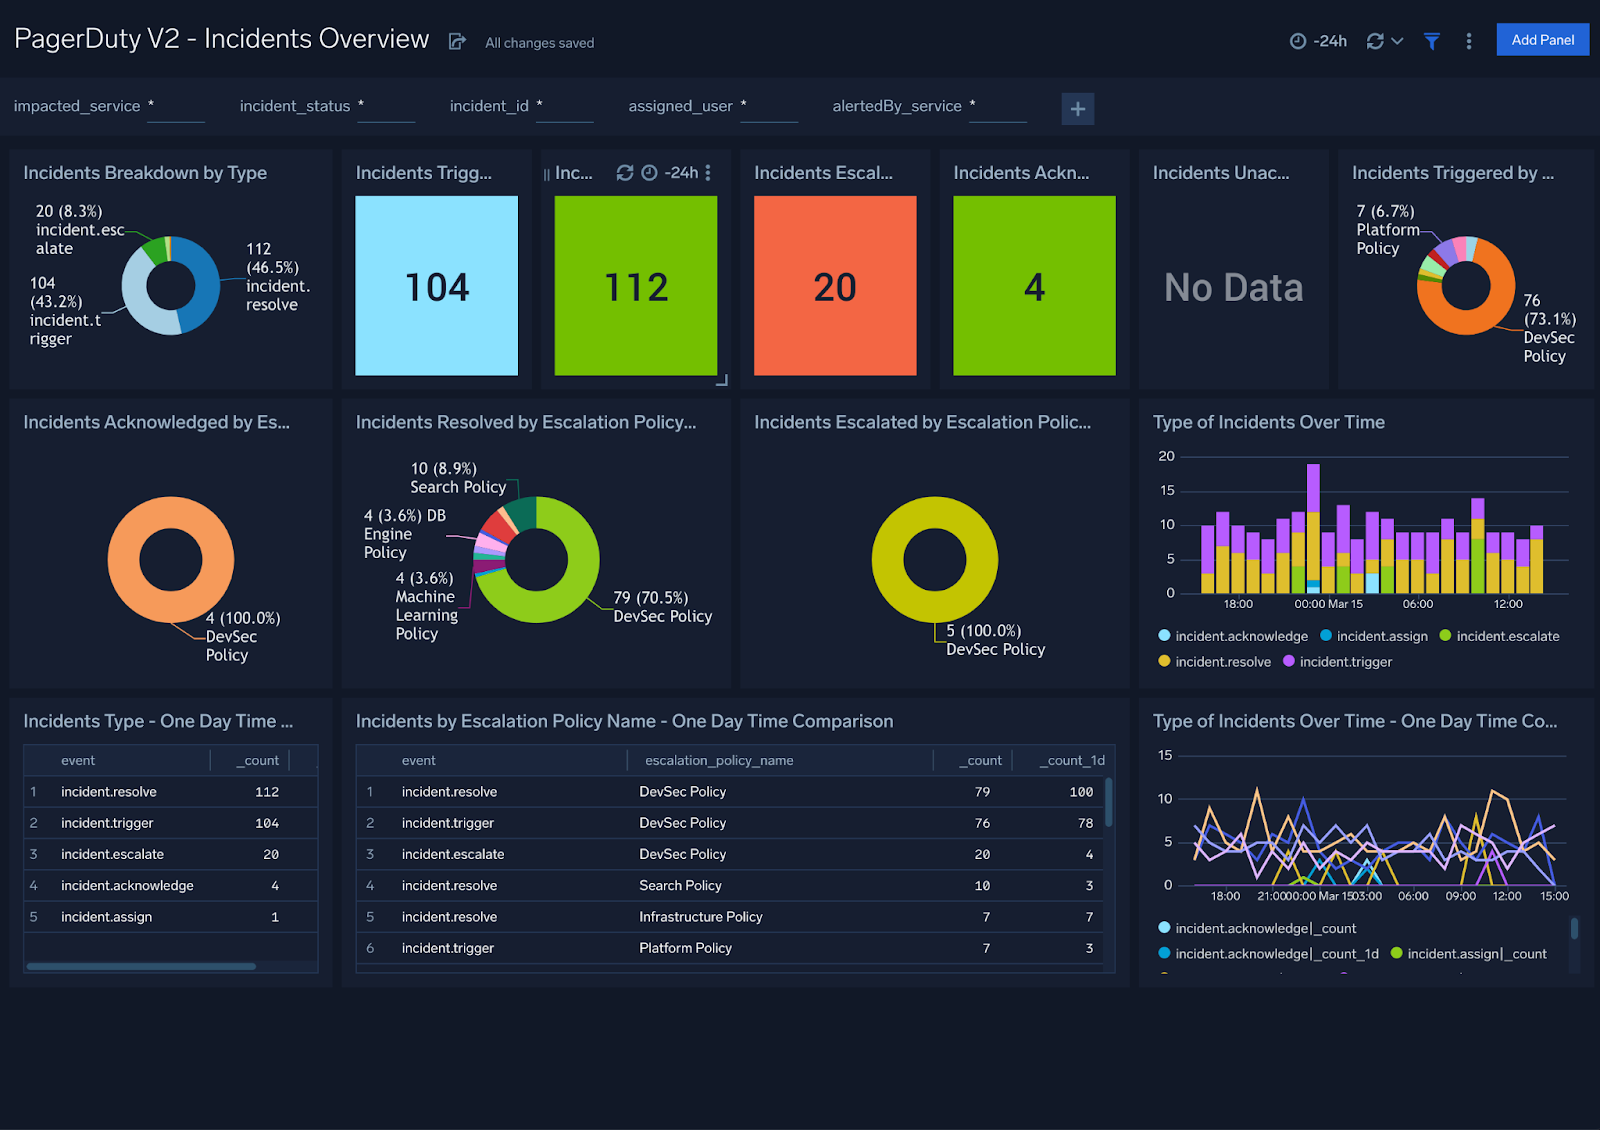
Incidents Overview
PagerDuty V2 - Incidents Overview Dashboard provides an at-a-glance analysis of triggered, acknowledged, escalated, assigned, and resolved incidents. This dashboard also provides a high-level view of incident trends and comparisons over specified time intervals.
Use this dashboard to:
- Review a high-level view of incidents summaries.
- Compare the state of incidents with that of a previous time
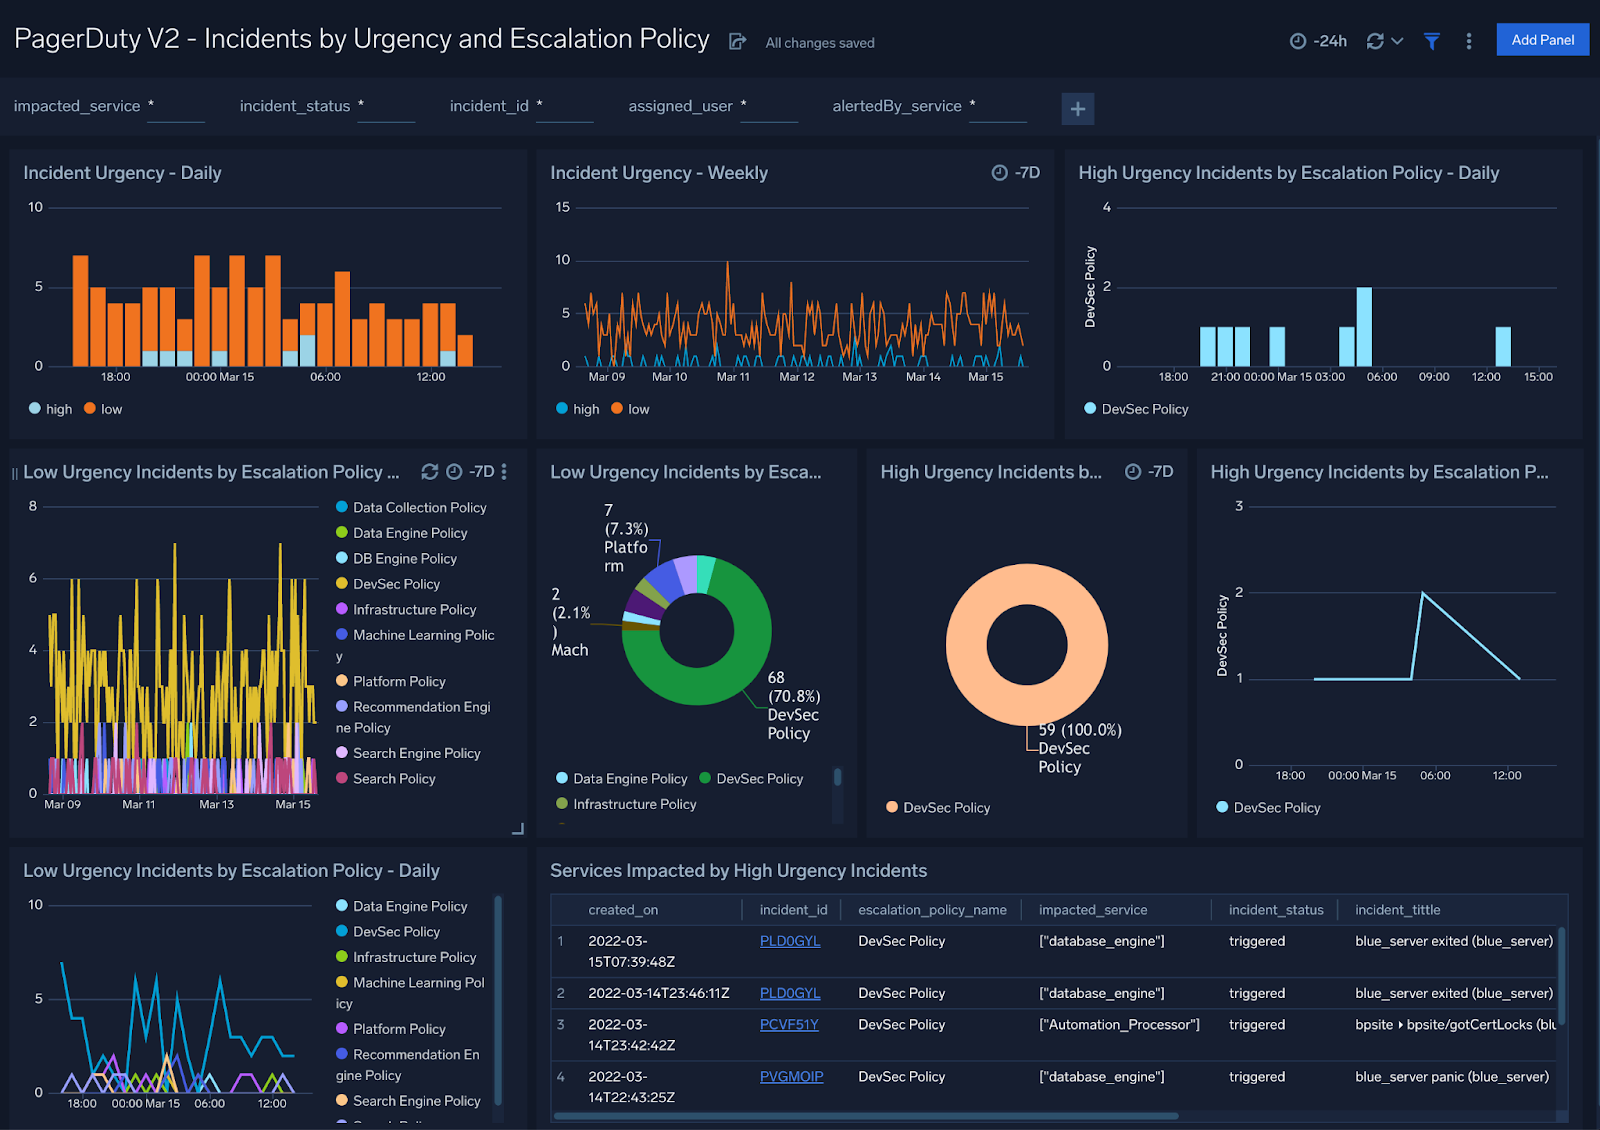
Incidents by Urgency and Escalation Policy
PagerDuty V2 - Incidents by Urgency and Escalation Policy Dashboard provides an overview analysis of urgency events, from low to high, as well as a breakdown of the services impacted by high urgency events.
Use this dashboard to:
- Review see weekly incident summaries.
- Analyze incidents by severity and escalation policy.