cloudflare
This application has been developed and is supported by Cloudflare. In case of technical questions, please review the technical documentation for Cloudflare logs or email analytics@cloudflare.com.
The Cloudflare App provides a set of dashboards that make analyzing Cloudflare logs easy, helping you to understand events and trends from your websites and applications on the Cloudflare network. Logs are gathered from all 160+ Cloudflare data centers in near real-time and can be combined with other data sources, such as your origin data, to provide unique insights and help you improve the performance and security of your websites and applications.
Log Types
The Cloudflare App uses HTTP request logs in JSON format gathered from all of the 160+ Cloudflare data centers. By default, timestamps are returned as Unix nanosecond integers. We recommend using the RFC 3339 format for sending logs to Sumo Logic. For a description of the fields available in the logs see link here.
Sample Log Message
{
"ClientIP": "89.163.242.206",
"ClientRequestHost": "www.theburritobot.com",
"ClientRequestMethod": "GET",
"ClientRequestURI": "/static/img/testimonial-hipster.png",
"EdgeEndTimestamp": 2018-12-15T02:20:57Z,
"EdgeResponseBytes": 69045,
"EdgeResponseStatus": 200,
"EdgeStartTimestamp": 2018-12-15T02:20:57Z,
"RayID": "3a6050bcbe121a87"
}
Sample Query
The following log query is from the ‘Total Number of Requests’ panel in the ‘Cloudflare - Snapshot’ dashboard.
ClientCountry*
| json "EdgePathingSrc", "EdgePathingOp","EdgePathingStatus", "ClientCountry",
"ClientIP", "ClientDeviceType", "ClientRequestHost", "ClientRequestUserAgent",
"ClientRequestURI", "OriginResponseStatus", "EdgeResponseStatus", "OriginIP",
"ClientIPClass" as edge_pathing_src, edge_pathing_op, edge_pathing_status, client_country,
client_ip, client_device_type, client_request_host, client_request_user_agent,
client_request_uri, origin_response_status, edge_response_status, origin_ip, client_ip_class
| count
Collecting Logs for Cloudflare
This section shows you how to set up a Hosted Collector and specify a Sumo Logic Source.
Set up a Hosted Collector and Specify a Sumo Logic Source
Prerequisites
To send Cloudflare logs to Sumo Logic, you must first configure Cloudflare Logs to send logs to AWS S3 using Logpush or Logpull.
To set up a Hosted Collector and specify a Sumo Logic Source, do the following:
- Follow the instructions for Configuring a Hosted Collector in Sumo Logic to start collecting logs.
- Follow the instructions for Configure an Amazon S3 Source in Sumo Logic. When setting up an S3 Source, it's important to specify the correct timestamp field. Follow the next steps to do so.
- To forward logs to Cloud SIEM Enterprise, click +Add Field with the key
_parserand value/Parsers/System/Cloudflare/Cloudflare Logpush - Click Advanced, if the settings are not already shown.
- For Timestamp Format, select Specify a format and enter the following:
- Format:
yyyy-MM-dd'T'HH:mm:ss'Z' - Timestamp Locator:
\"EdgeStartTimestamp\"\s*:\s*\"(.*)\"
- Format:
- Click Test. A Test Timestamp Parsing dialog appears.
- Enter a sample log message in the Test Timestamp Parsing dialog, such as the following, and then click Test: "EdgeStartTimestamp":"2018-12-19T23:38:10Z". A dialog confirming that your timestamp format matched should appear.
- Click Done and then click Save to save the timestamp parsing to the source.
Installing the Cloudflare App
This section has instructions for installing the Cloudflare App for Sumo and descriptions of each of the dashboards.
Now that you've set up log and metric collection, you can install the Cloudflare App, and use its pre-configured searches and dashboards.
To install the app, do the following:
Locate and install the app you need from the App Catalog. If you want to see a preview of the dashboards included with the app before installing, click Preview Dashboards.
- From the App Catalog, search for and select the app.
- Select the version of the service you're using and click Add to Library. Version selection is applicable only to a few apps currently. For more information, see Installing the Apps from the Library.
- To install the app, complete the following fields.
- App Name. You can retain the existing name, or enter a name of your choice for the app.
- Data Source. Select either of these options for the data source.
- Choose Source Category, and select a source category from the list.
- Choose Enter a Custom Data Filter, and enter a custom source category beginning with an underscore. Example: (_sourceCategory=MyCategory).
- Advanced. Select the Location in Library (the default is the Personal folder in the library), or click New Folder to add a new folder.
- Click Add to Library.
Once an app is installed, it will appear in your Personal folder, or other folder that you specified. From here, you can share it with your organization.
Panels will start to fill automatically. It's important to note that each panel slowly fills with data matching the time range query and received since the panel was created. Results won't immediately be available, but with a bit of time, you'll see full graphs and maps.
Viewing the Cloudflare Dashboards
All dashboard have a set of filters that you can apply to the entire dashboard, as shown in the following example. Click the funnel icon in the top dashboard menu bar to display a scrollable list of filters that are applied across the entire dashboard.
You can use filters to drill down and examine the data on a granular level. Filters include client country, client device type, client IP, client request host, client request URI, client request user agent, edge response status, origin IP, and origin response status.
Each panel has a set of filters that are applied to the results for that panel only, as shown in the following example. Click the funnel icon in the top panel menu bar to display a list of panel-specific filters.
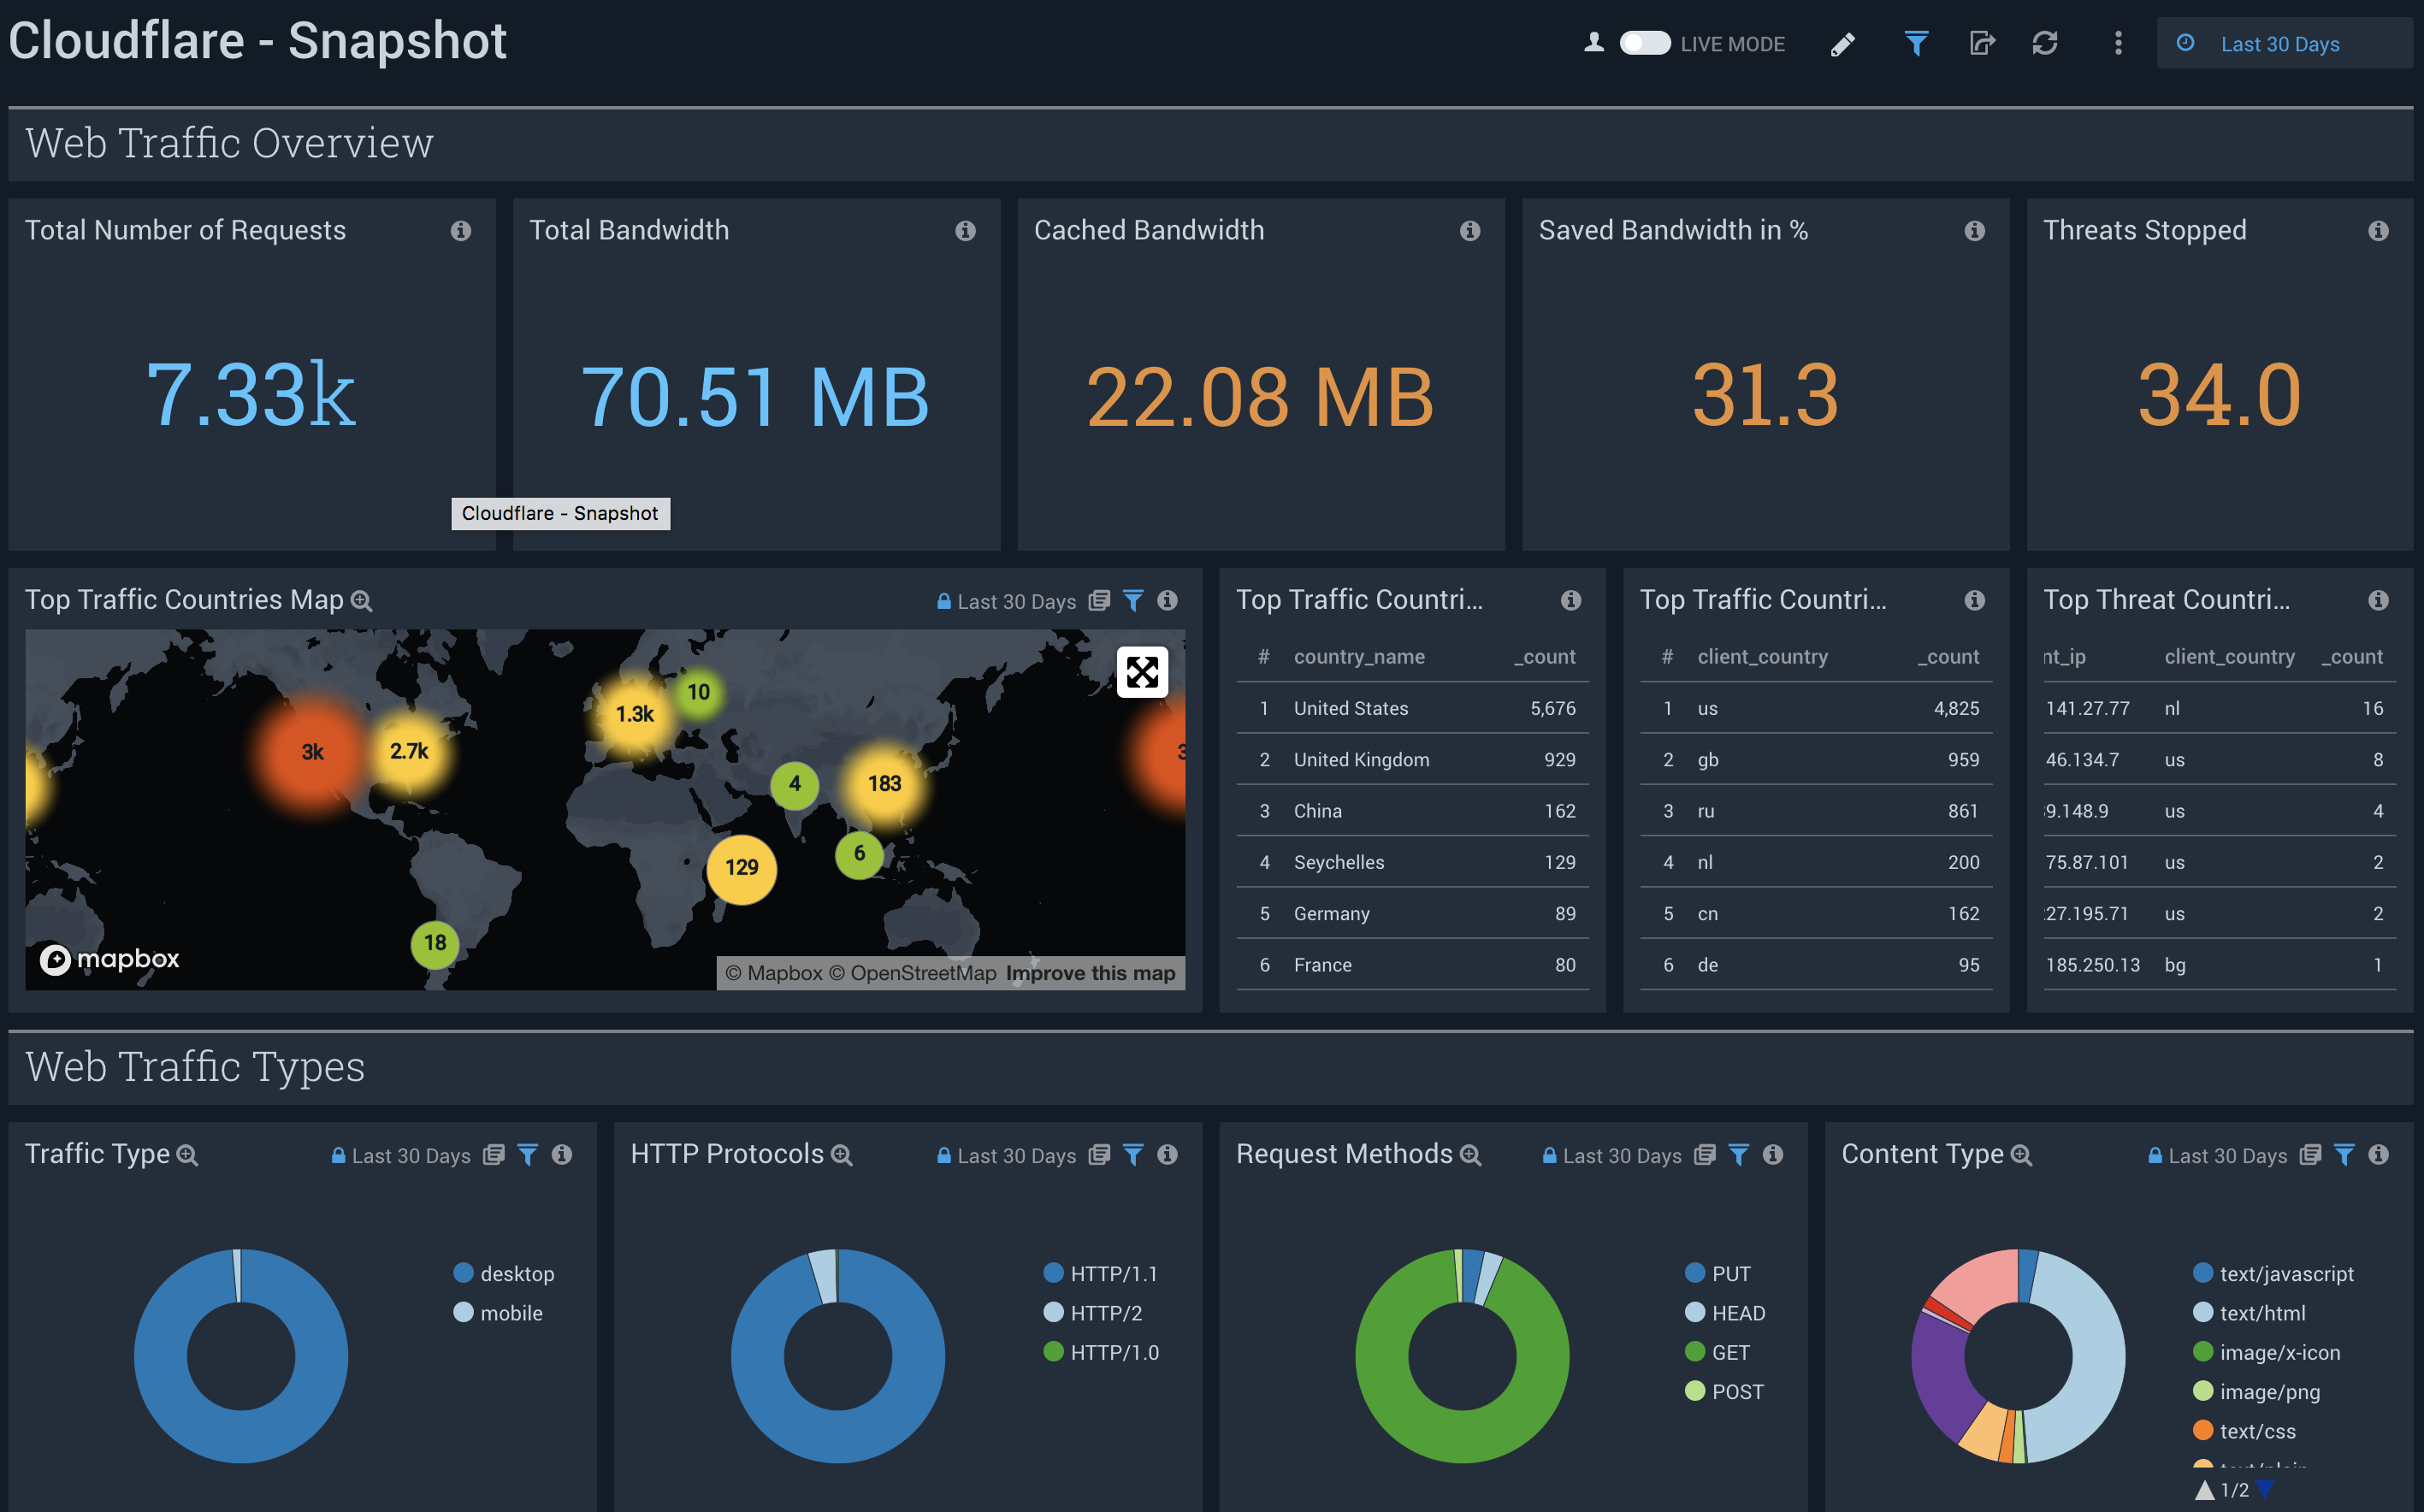
Snapshot
Cloudflare - Snapshot Dashboard provides an at-a-glance overview of the most important metrics from your websites and applications on the Cloudflare network. You can use dashboard filters to further slice and dice the information for granular analysis of events and trends.
Use this dashboard to:
- Monitor the most important web traffic metrics of your websites and applications on the Cloudflare network.
- View what countries and IPs your traffic is coming from and analyze the breakdown between mobile and desktop traffic, protocol, methods, and content types.
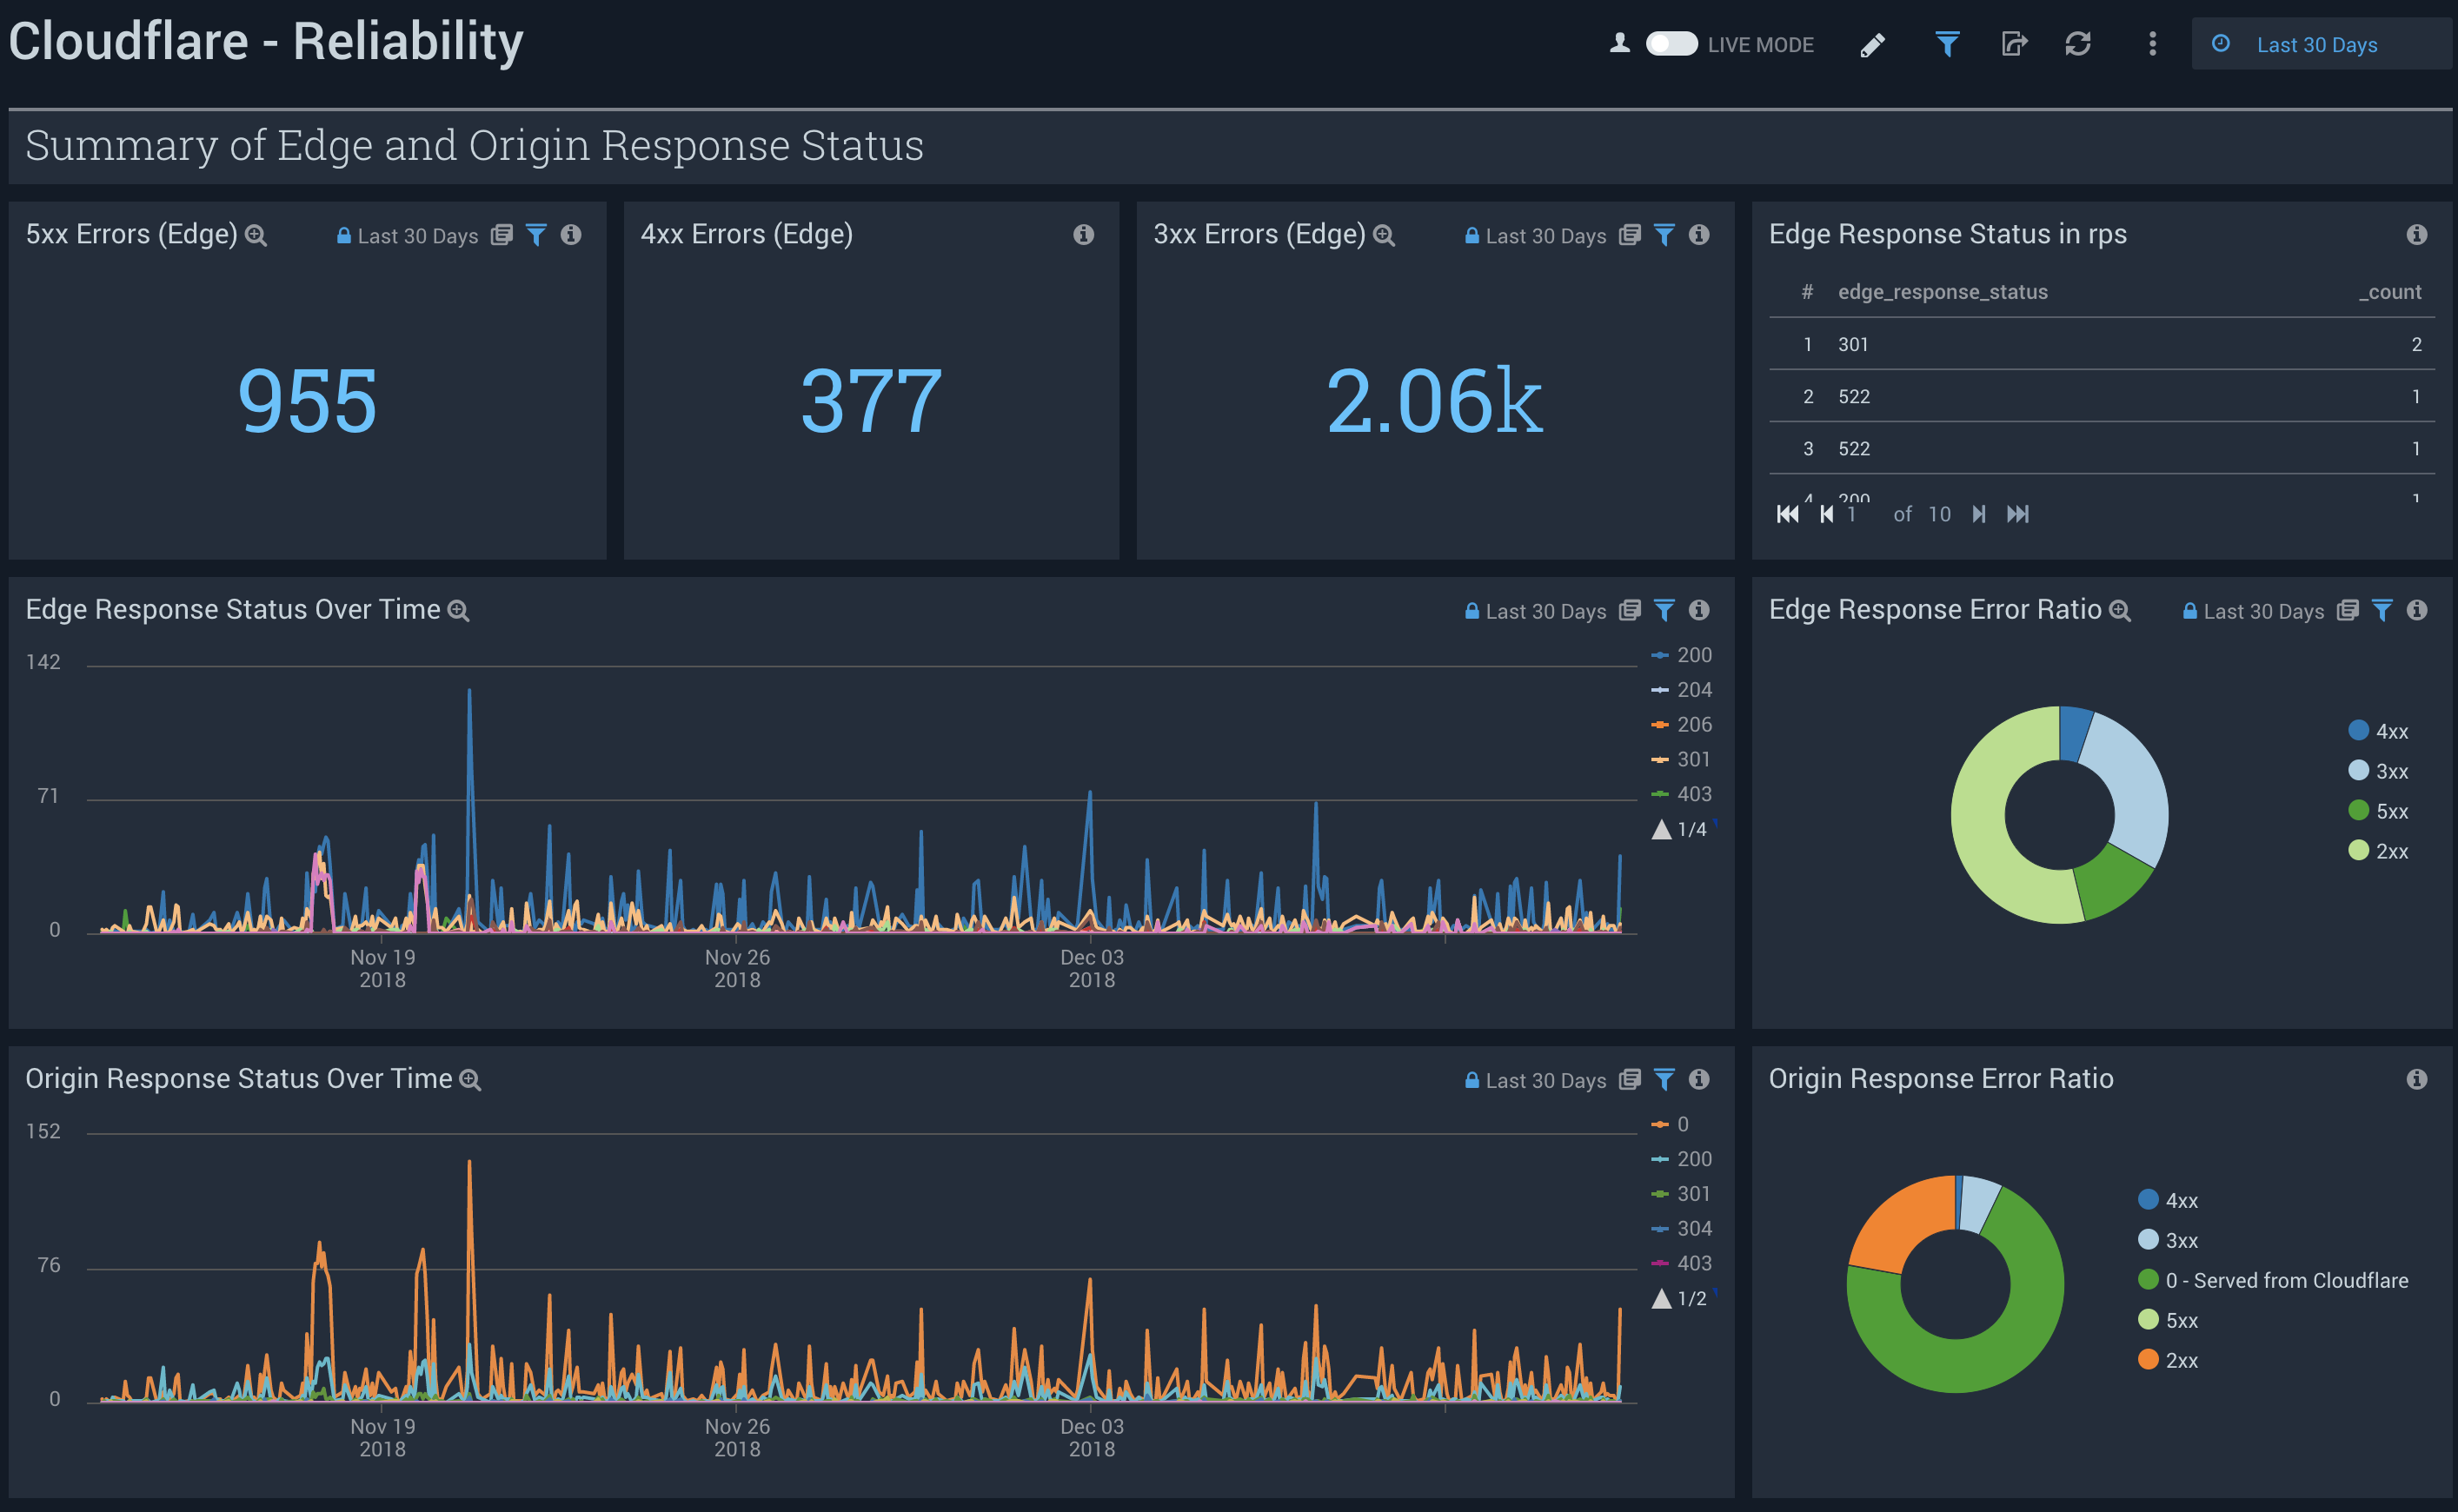
Reliability
Cloudflare - Reliability Dashboard provides insights on the availability of your websites and applications. Metrics include origin response error ratio, origin response status over time, percentage of 3xx/4xx/5xx errors over time, and more.
Use this dashboard to:
- Investigate errors on your websites and applications by viewing edge and origin response status codes.
- Further analyze errors based on status codes by countries, client IPs, hostnames, and other metrics.
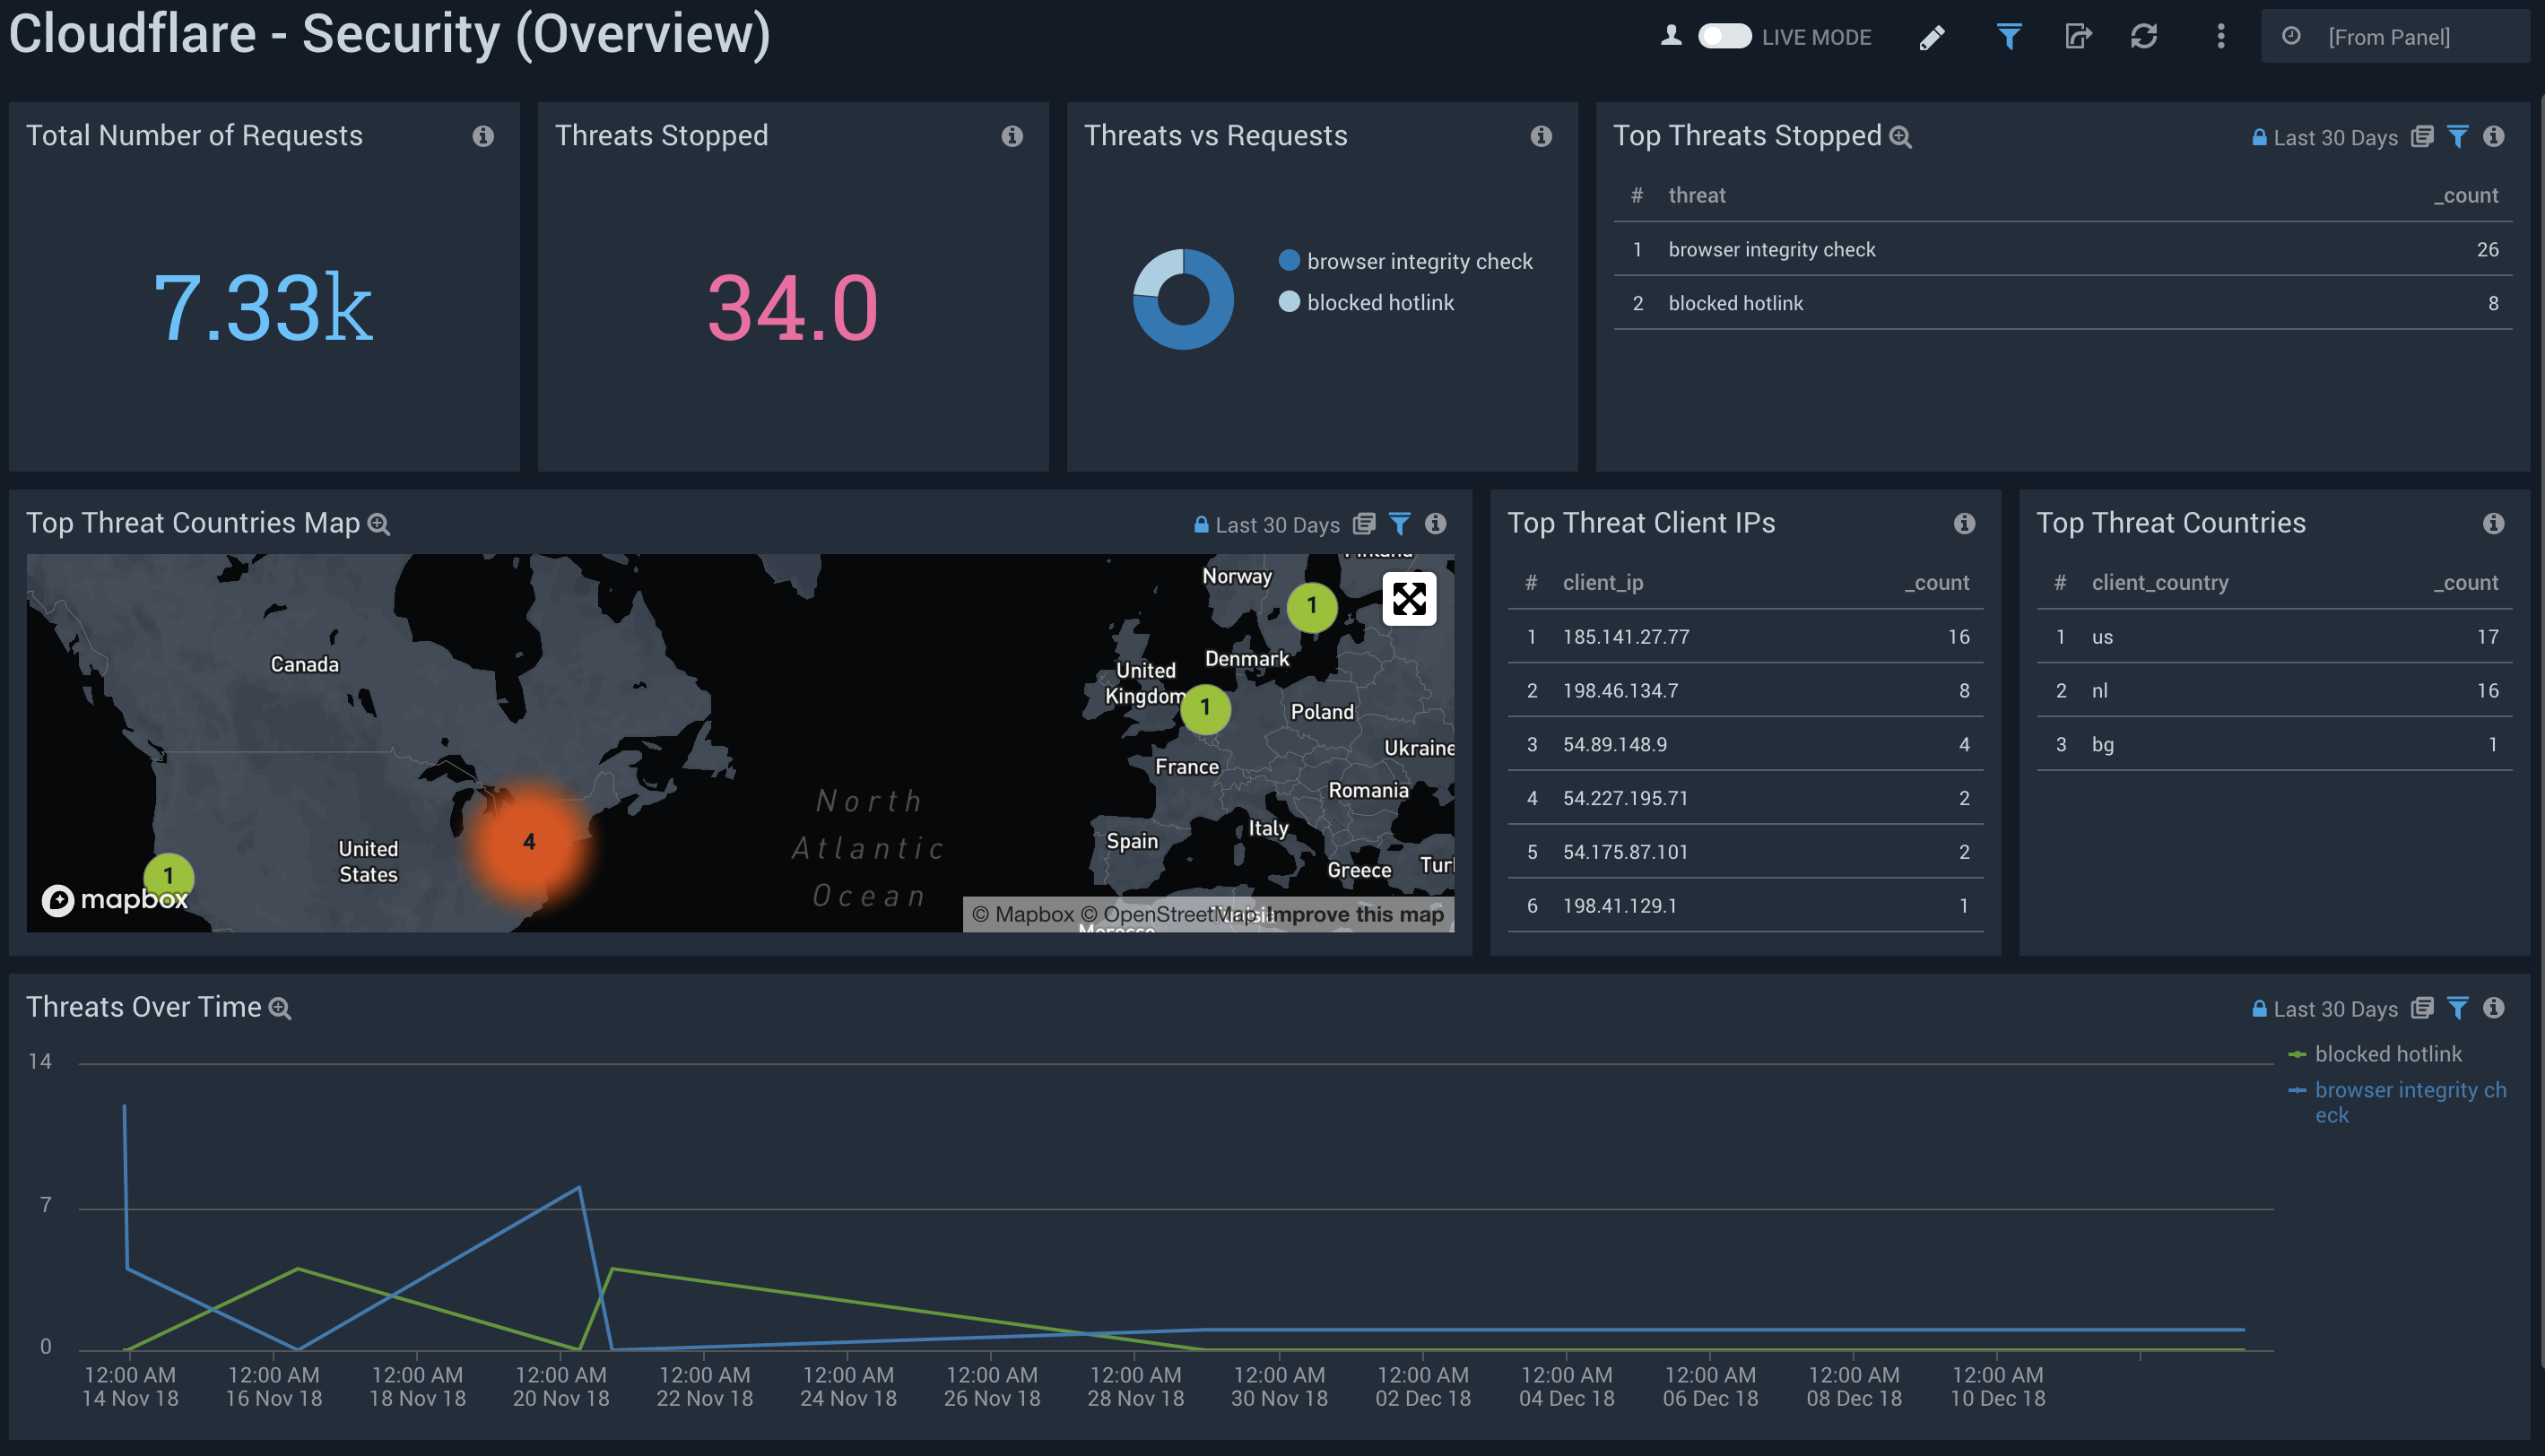
Security (Overview)
Cloudflare - Security (Overview) Dashboard provides insights on threats to your websites and applications, including number of threats stopped, threats over time, top threat countries, and more.
Use this dashboard to:
- Monitor the most important security and threat metrics for your websites and applications.
- Fine tune and configure your IP firewall.
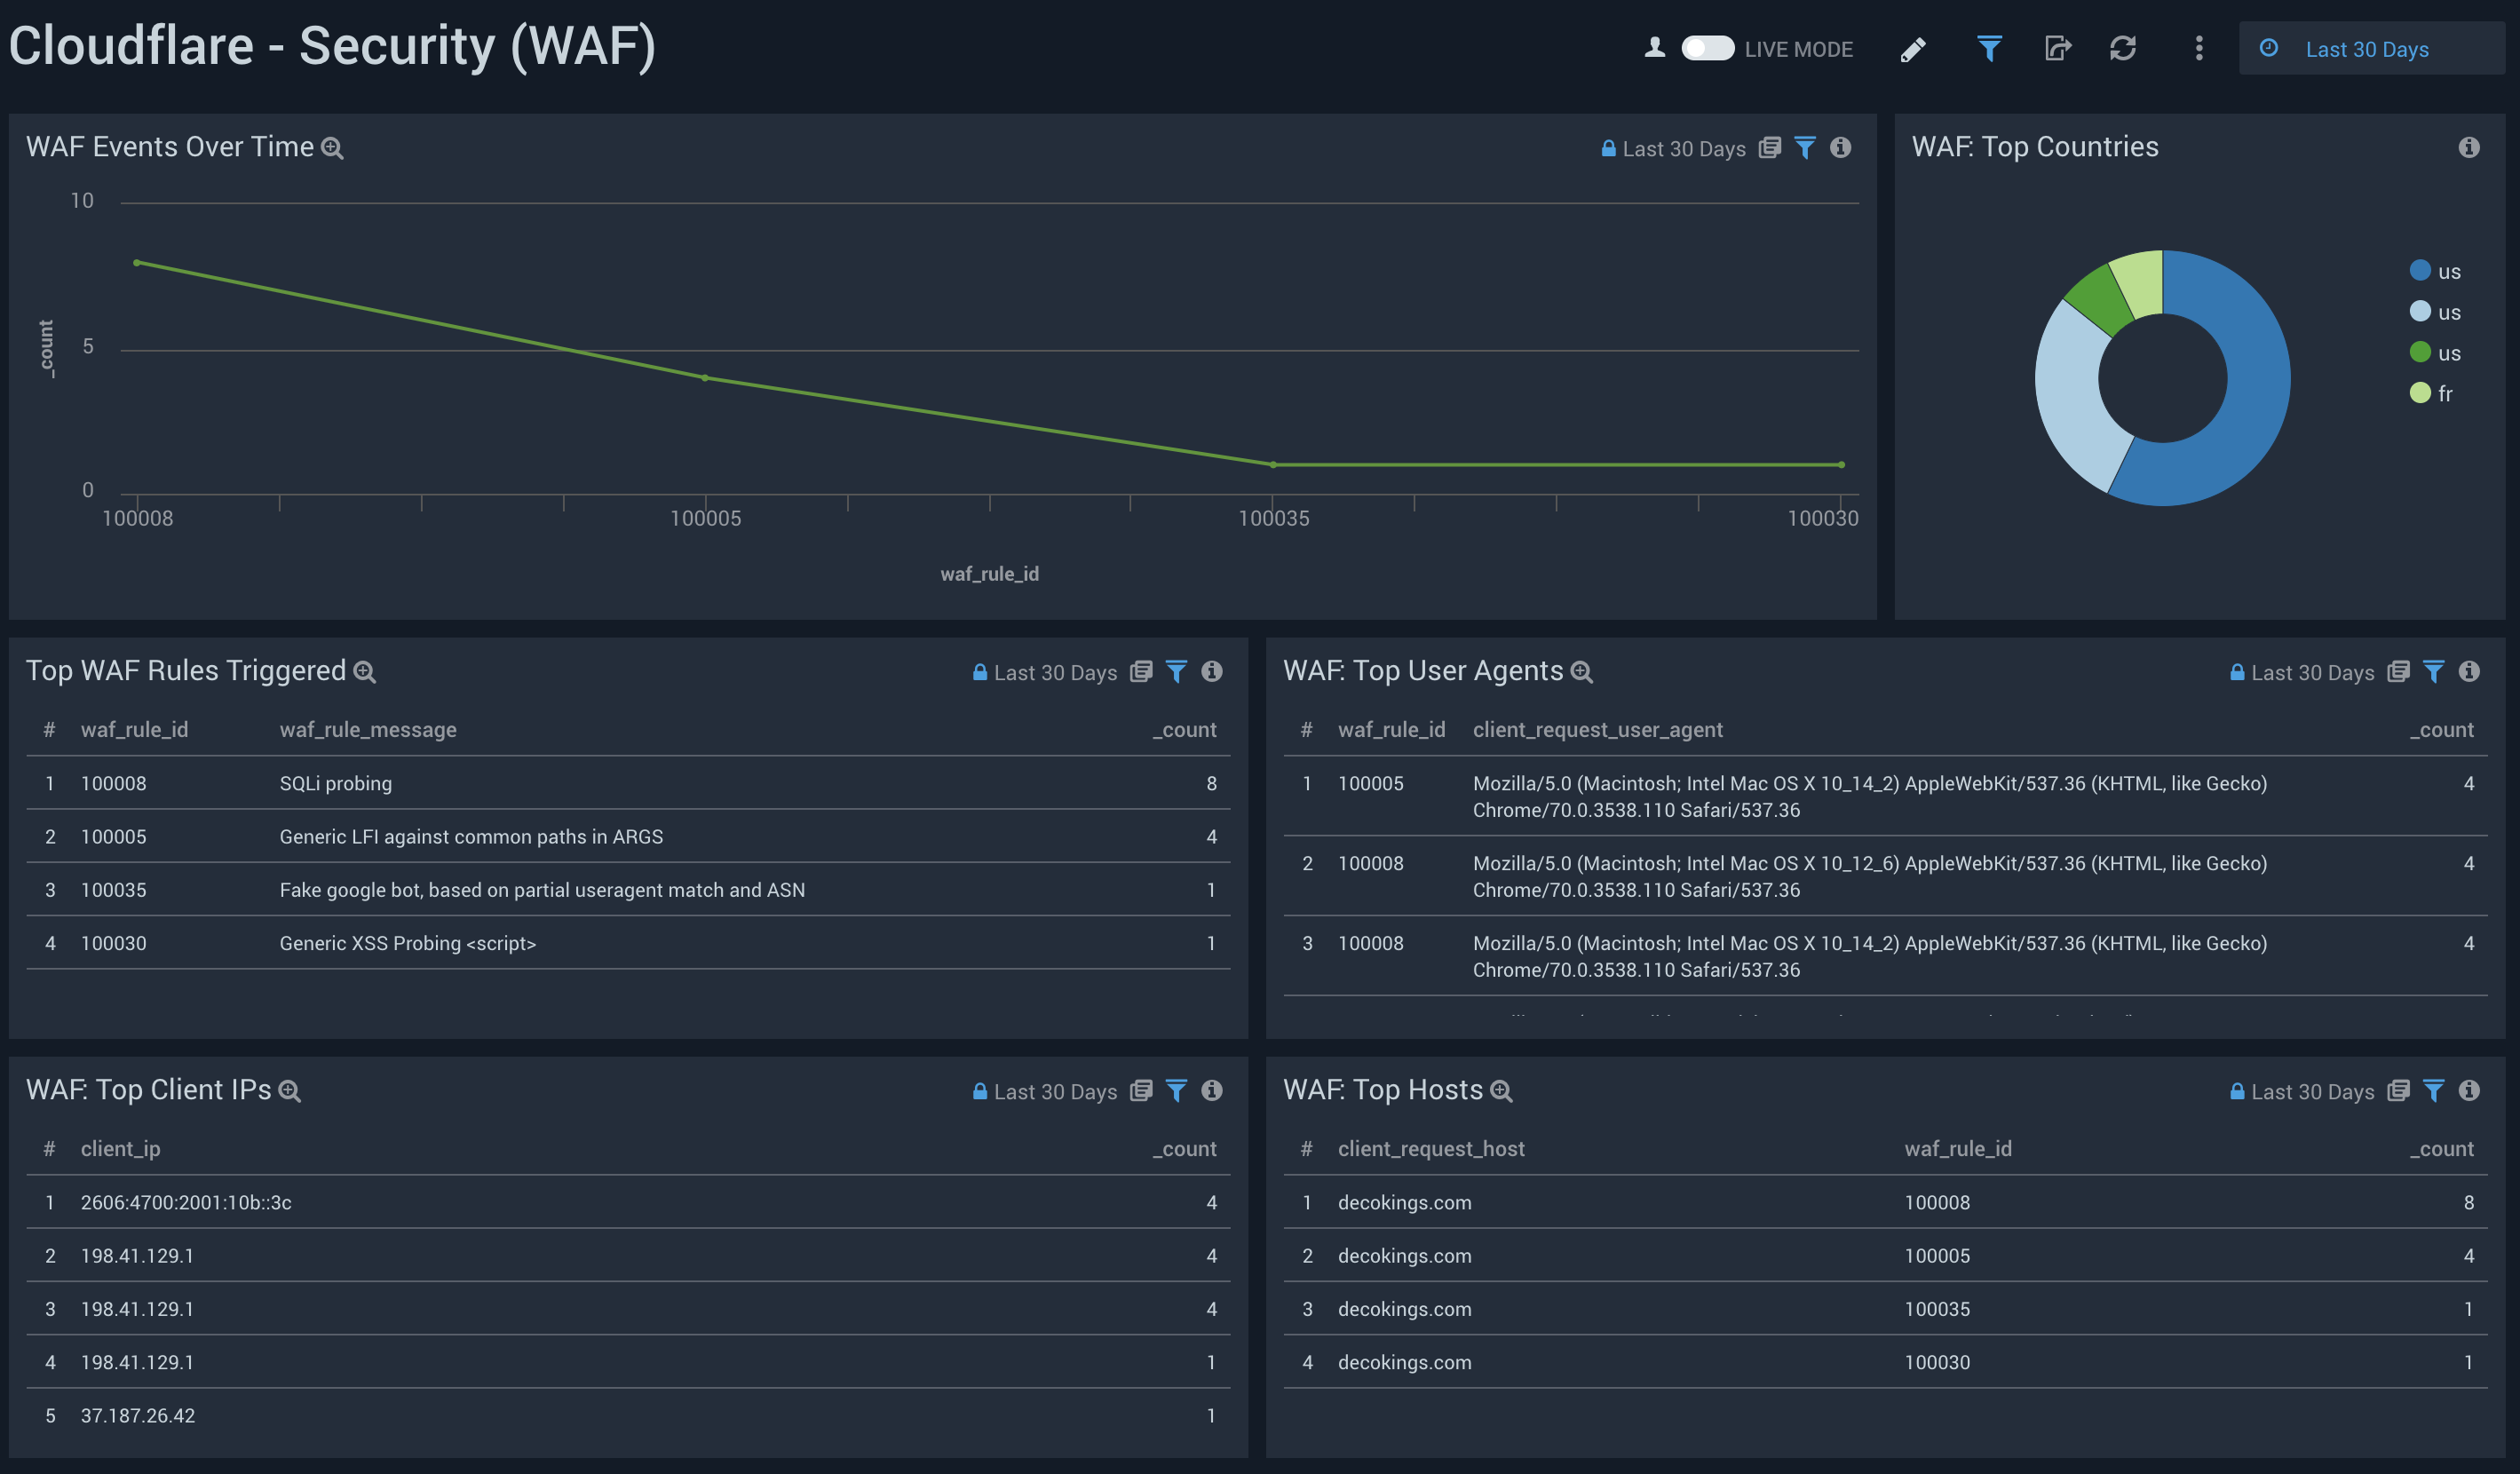
Security (WAF)
Cloudflare - Security (WAF) Dashboard provides insights on threat identification and mitigation by our Web Application Firewall (WAF), including events like SQL injections, XSS, and more.
Use this dashboard to:
- Understand attacks and WAF rules triggered to reveal vulnerabilities and false positives.
- Fine tune the WAF to target obvious threats and prevent false positives.
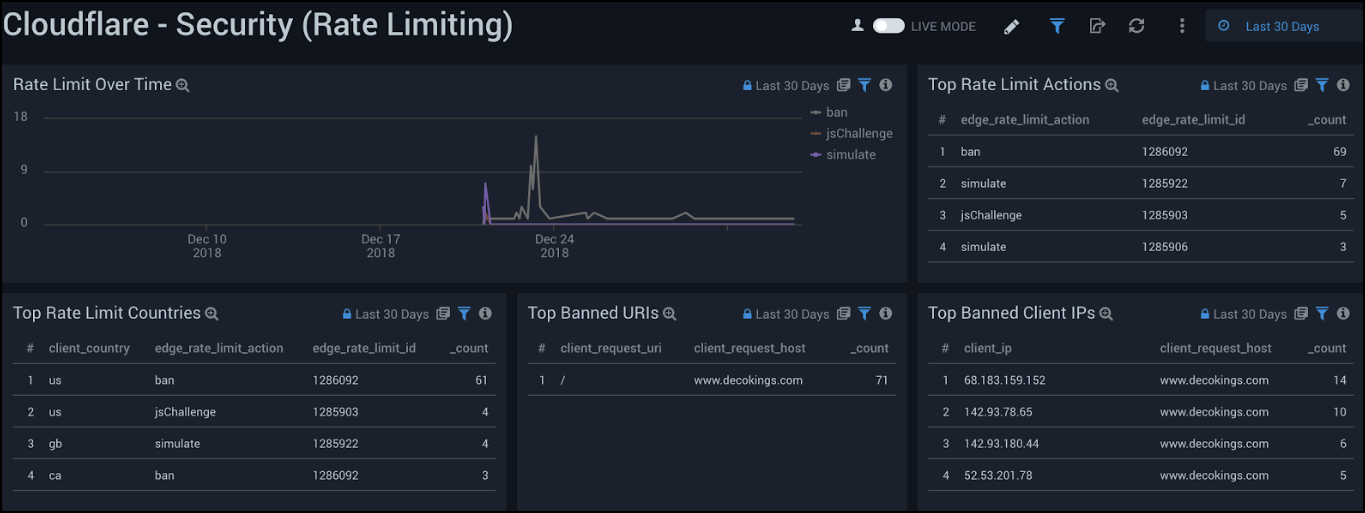
Security (Rate Limiting)
Cloudflare - Security (Rate Limiting) Dashboard provides insights on rate limiting protection against denial-of-service attacks, brute-force login attempts, and other types of abusive behavior targeted at your websites and applications.
Use this dashboard to:
- Investigate attacks by looking at rate limiting over time, top rate limit actions, top rate limit countries, top banned URIs, and top banned client IPs.
- Define thresholds or block client IP addresses to protect your website or application from malicious traffic.
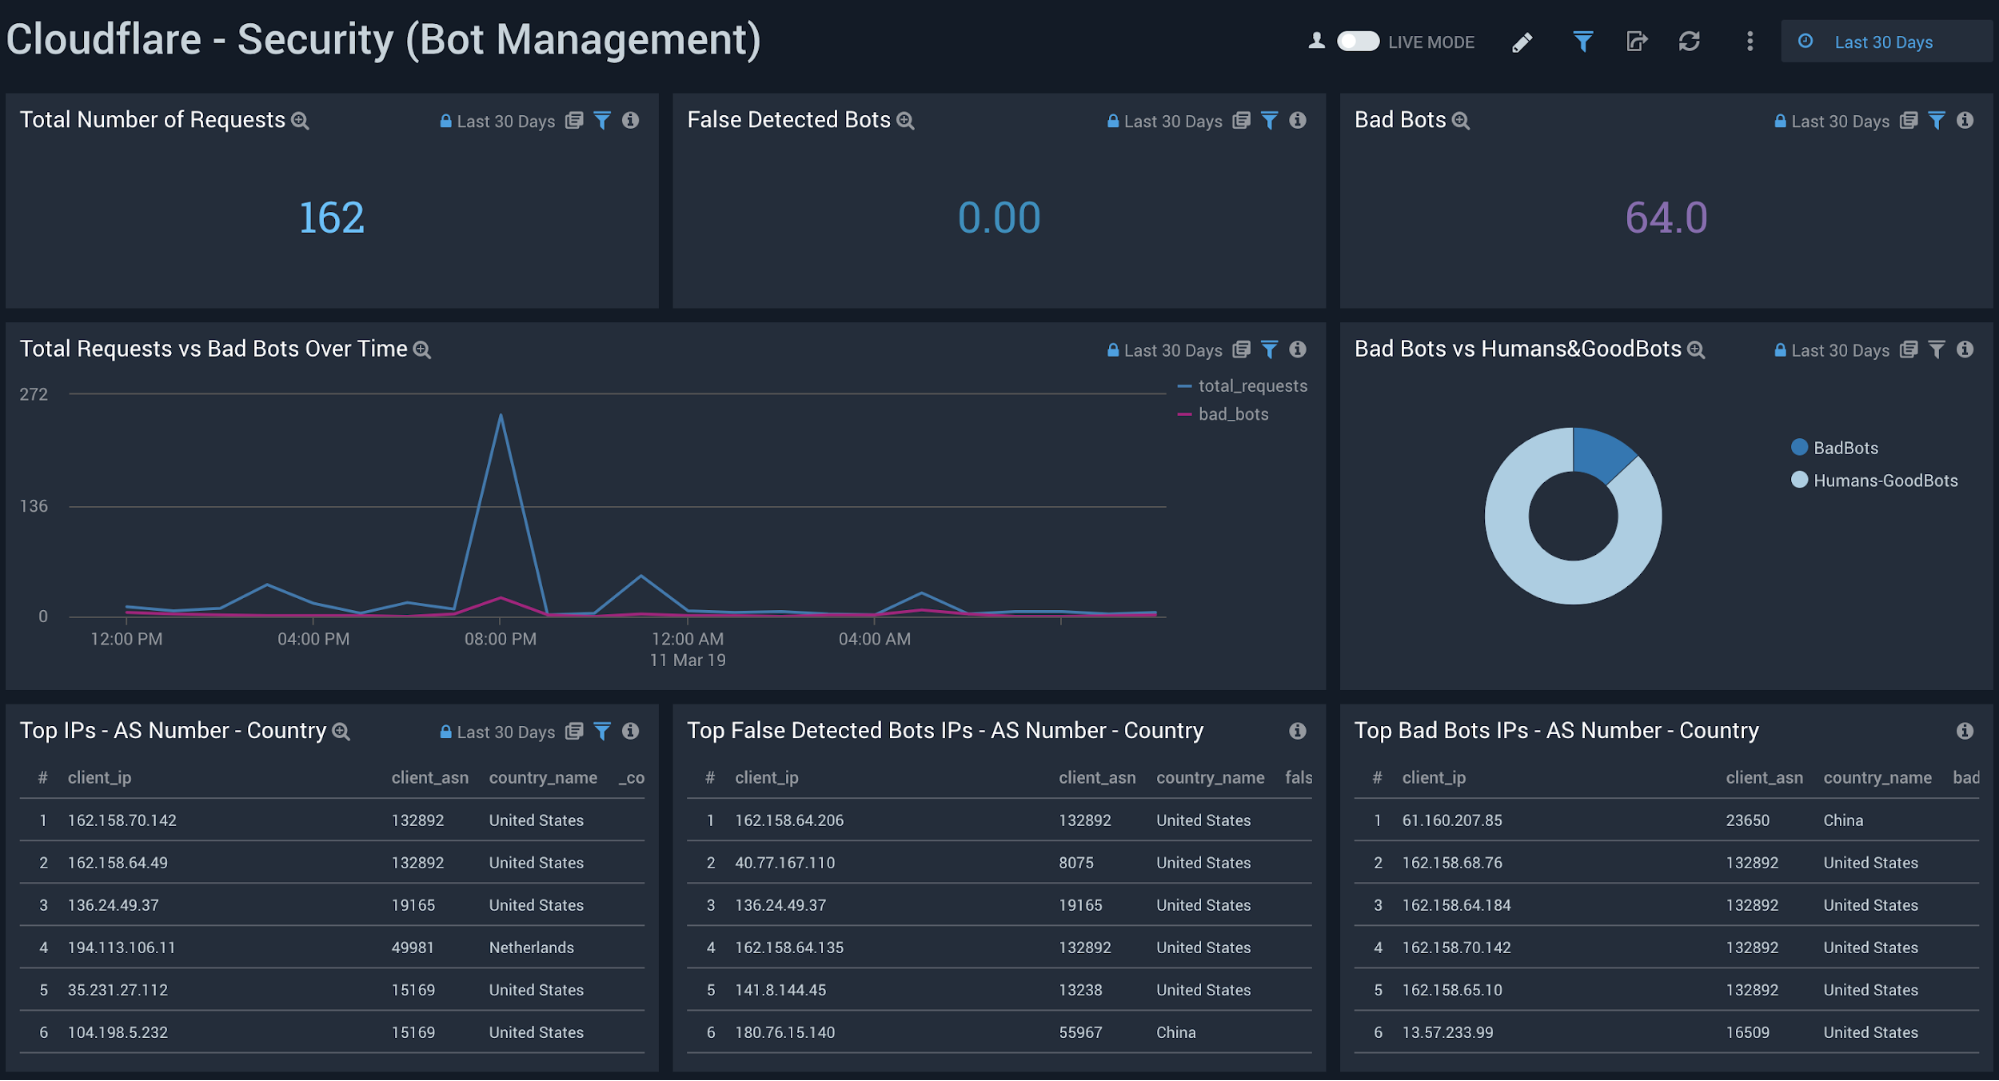
Security (Bot Management)
Cloudflare - Security (Bot Management) Dashboard reliably detects and mitigates bad bots to prevent credential stuffing, spam registration, content scraping, click fraud, inventory hoarding, and other malicious activities.
To get bot requests identified correctly, use only one Filter Based Firewall rule with action "Challenge (Captcha)". For more information, see the Cloudflare documentation.
Use this dashboard to:
- Investigate bot activity on your website to prevent content scraping, checkout fraud, spam registration and other malicious activities.
- Use insight to tune Cloudflare to prevent bots from excessive usage and abuse across websites, applications, and API endpoints.
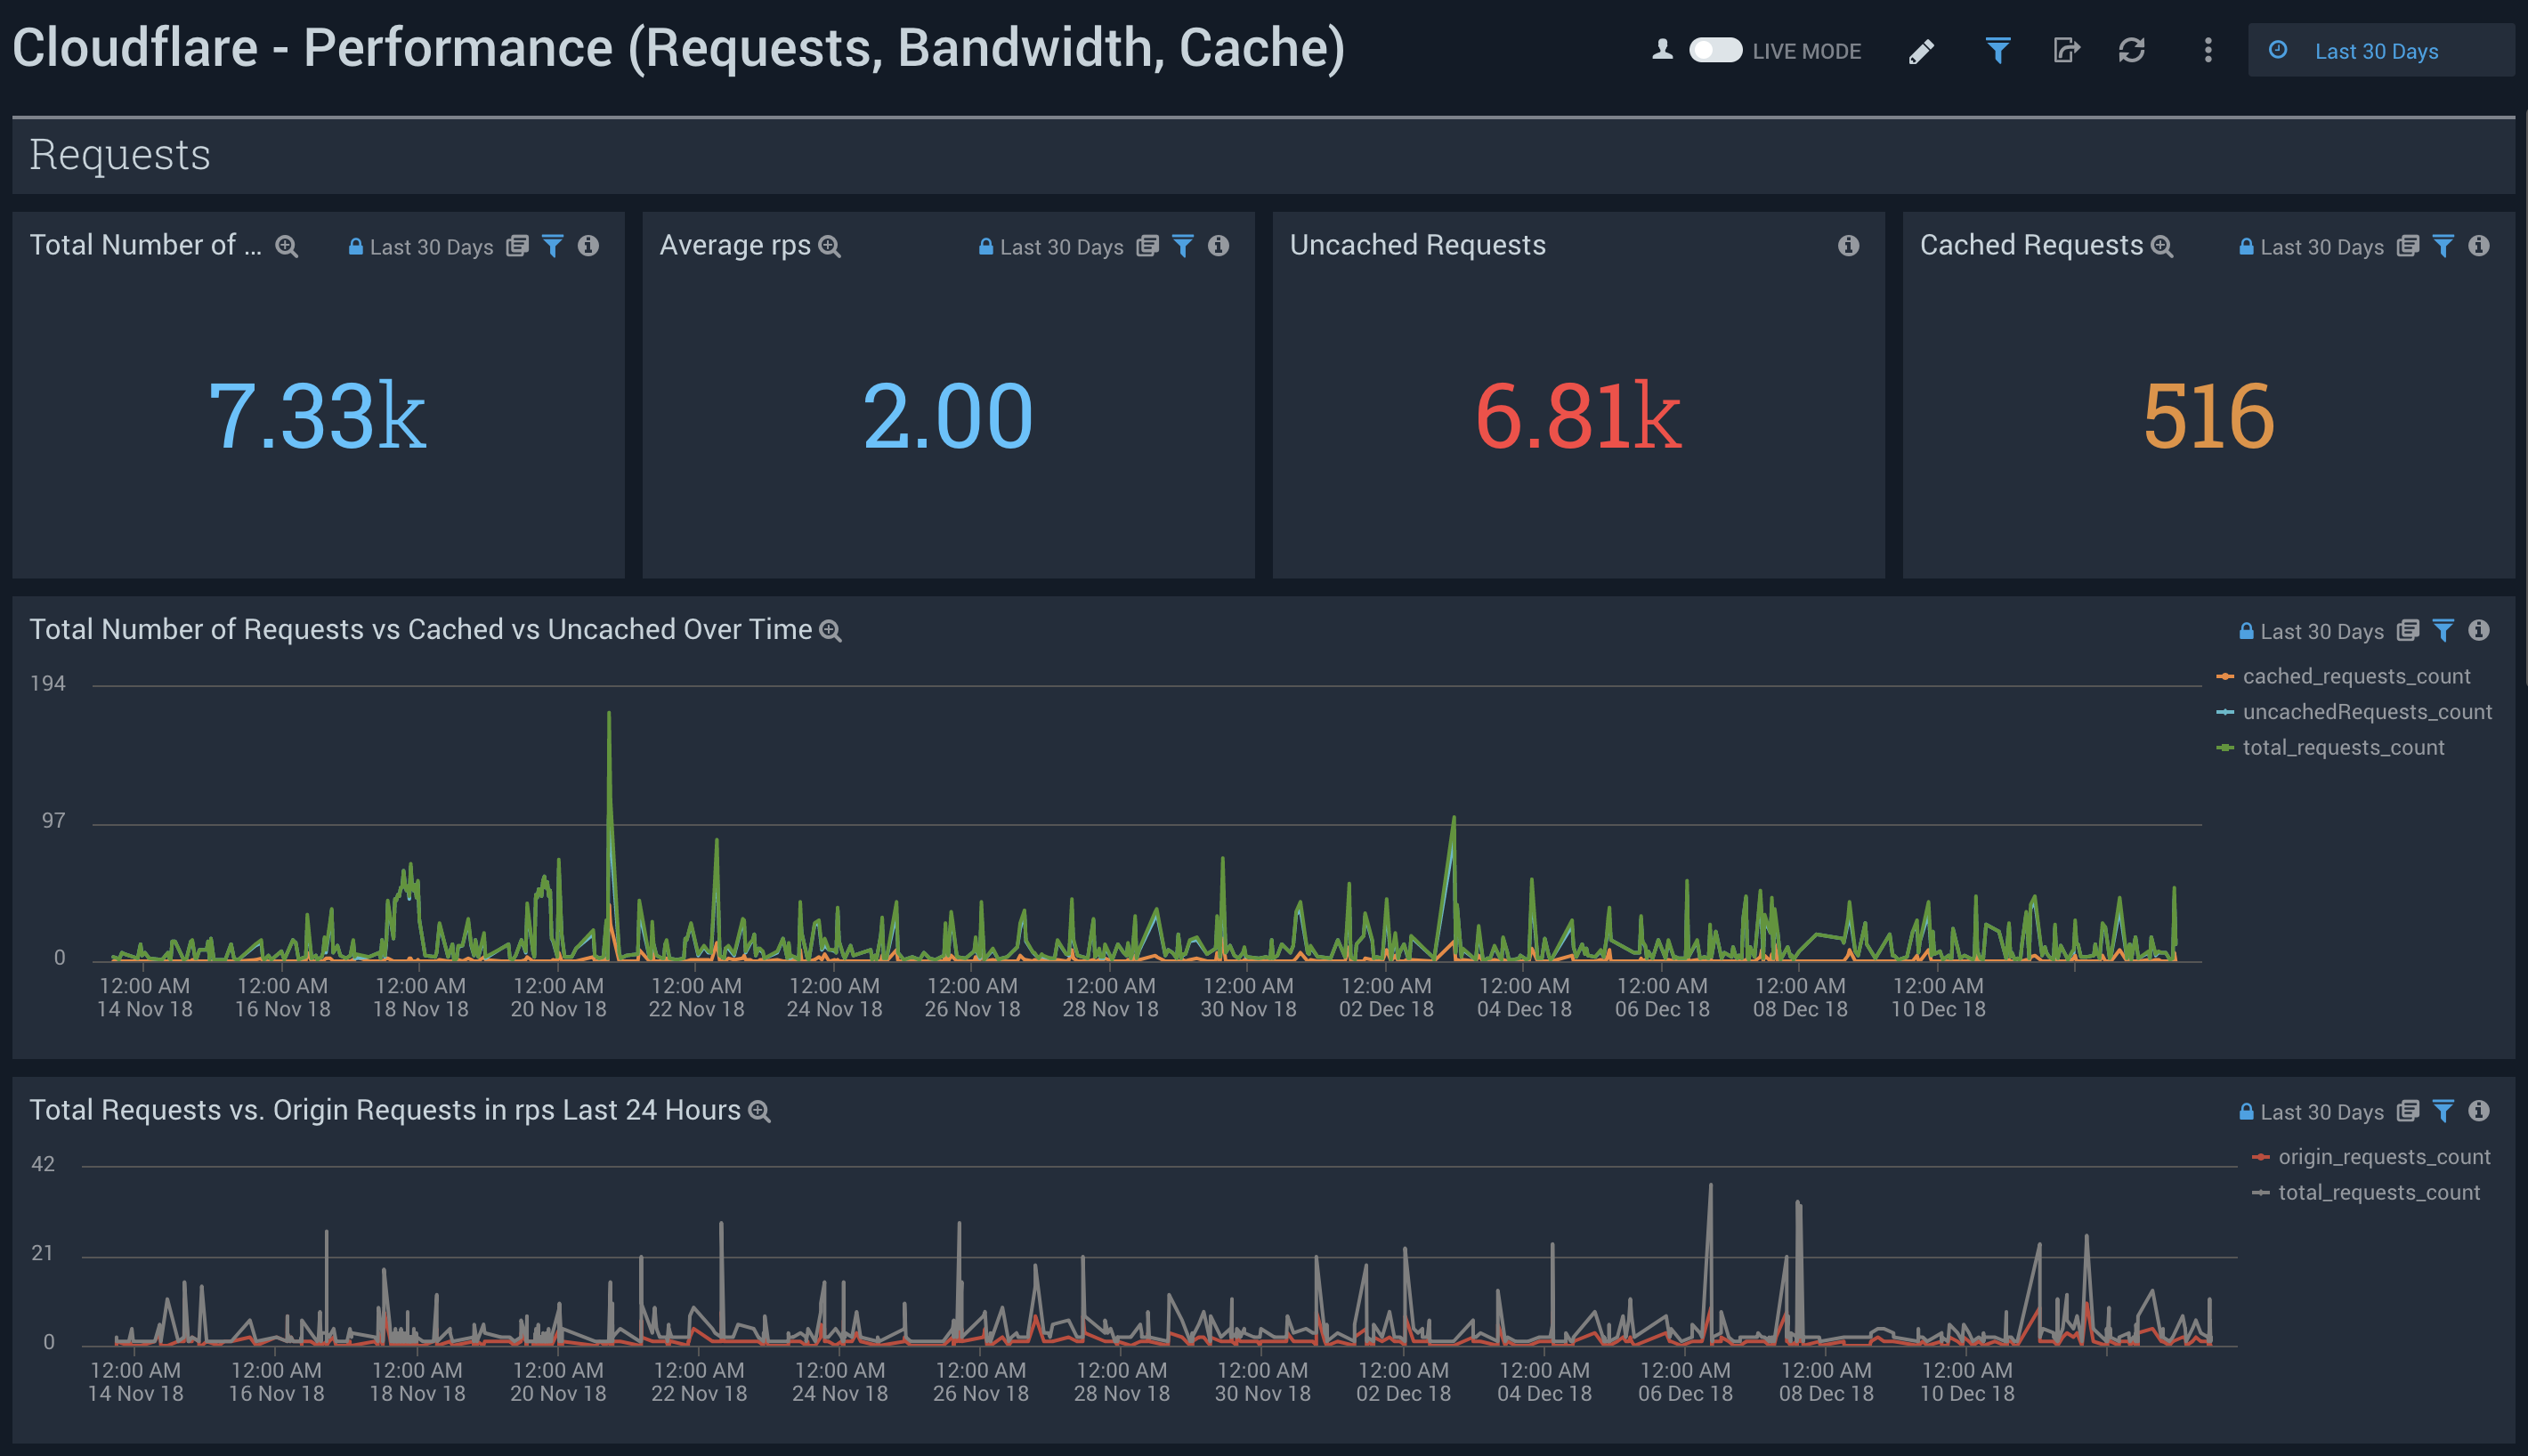
Performance (Requests, Bandwidth, Cache)
Cloudflare - Performance (Requests, Bandwidth, Cache) Dashboard identifies and addresses performance issues and caching misconfigurations. Metrics include total vs. cached bandwidth, saved bandwidth, total requests, cache ratio, top uncached requests, and more.
Use this dashboard to:
- Monitor caching behavior and identify misconfigurations.
- Improve configuration and caching ratio.
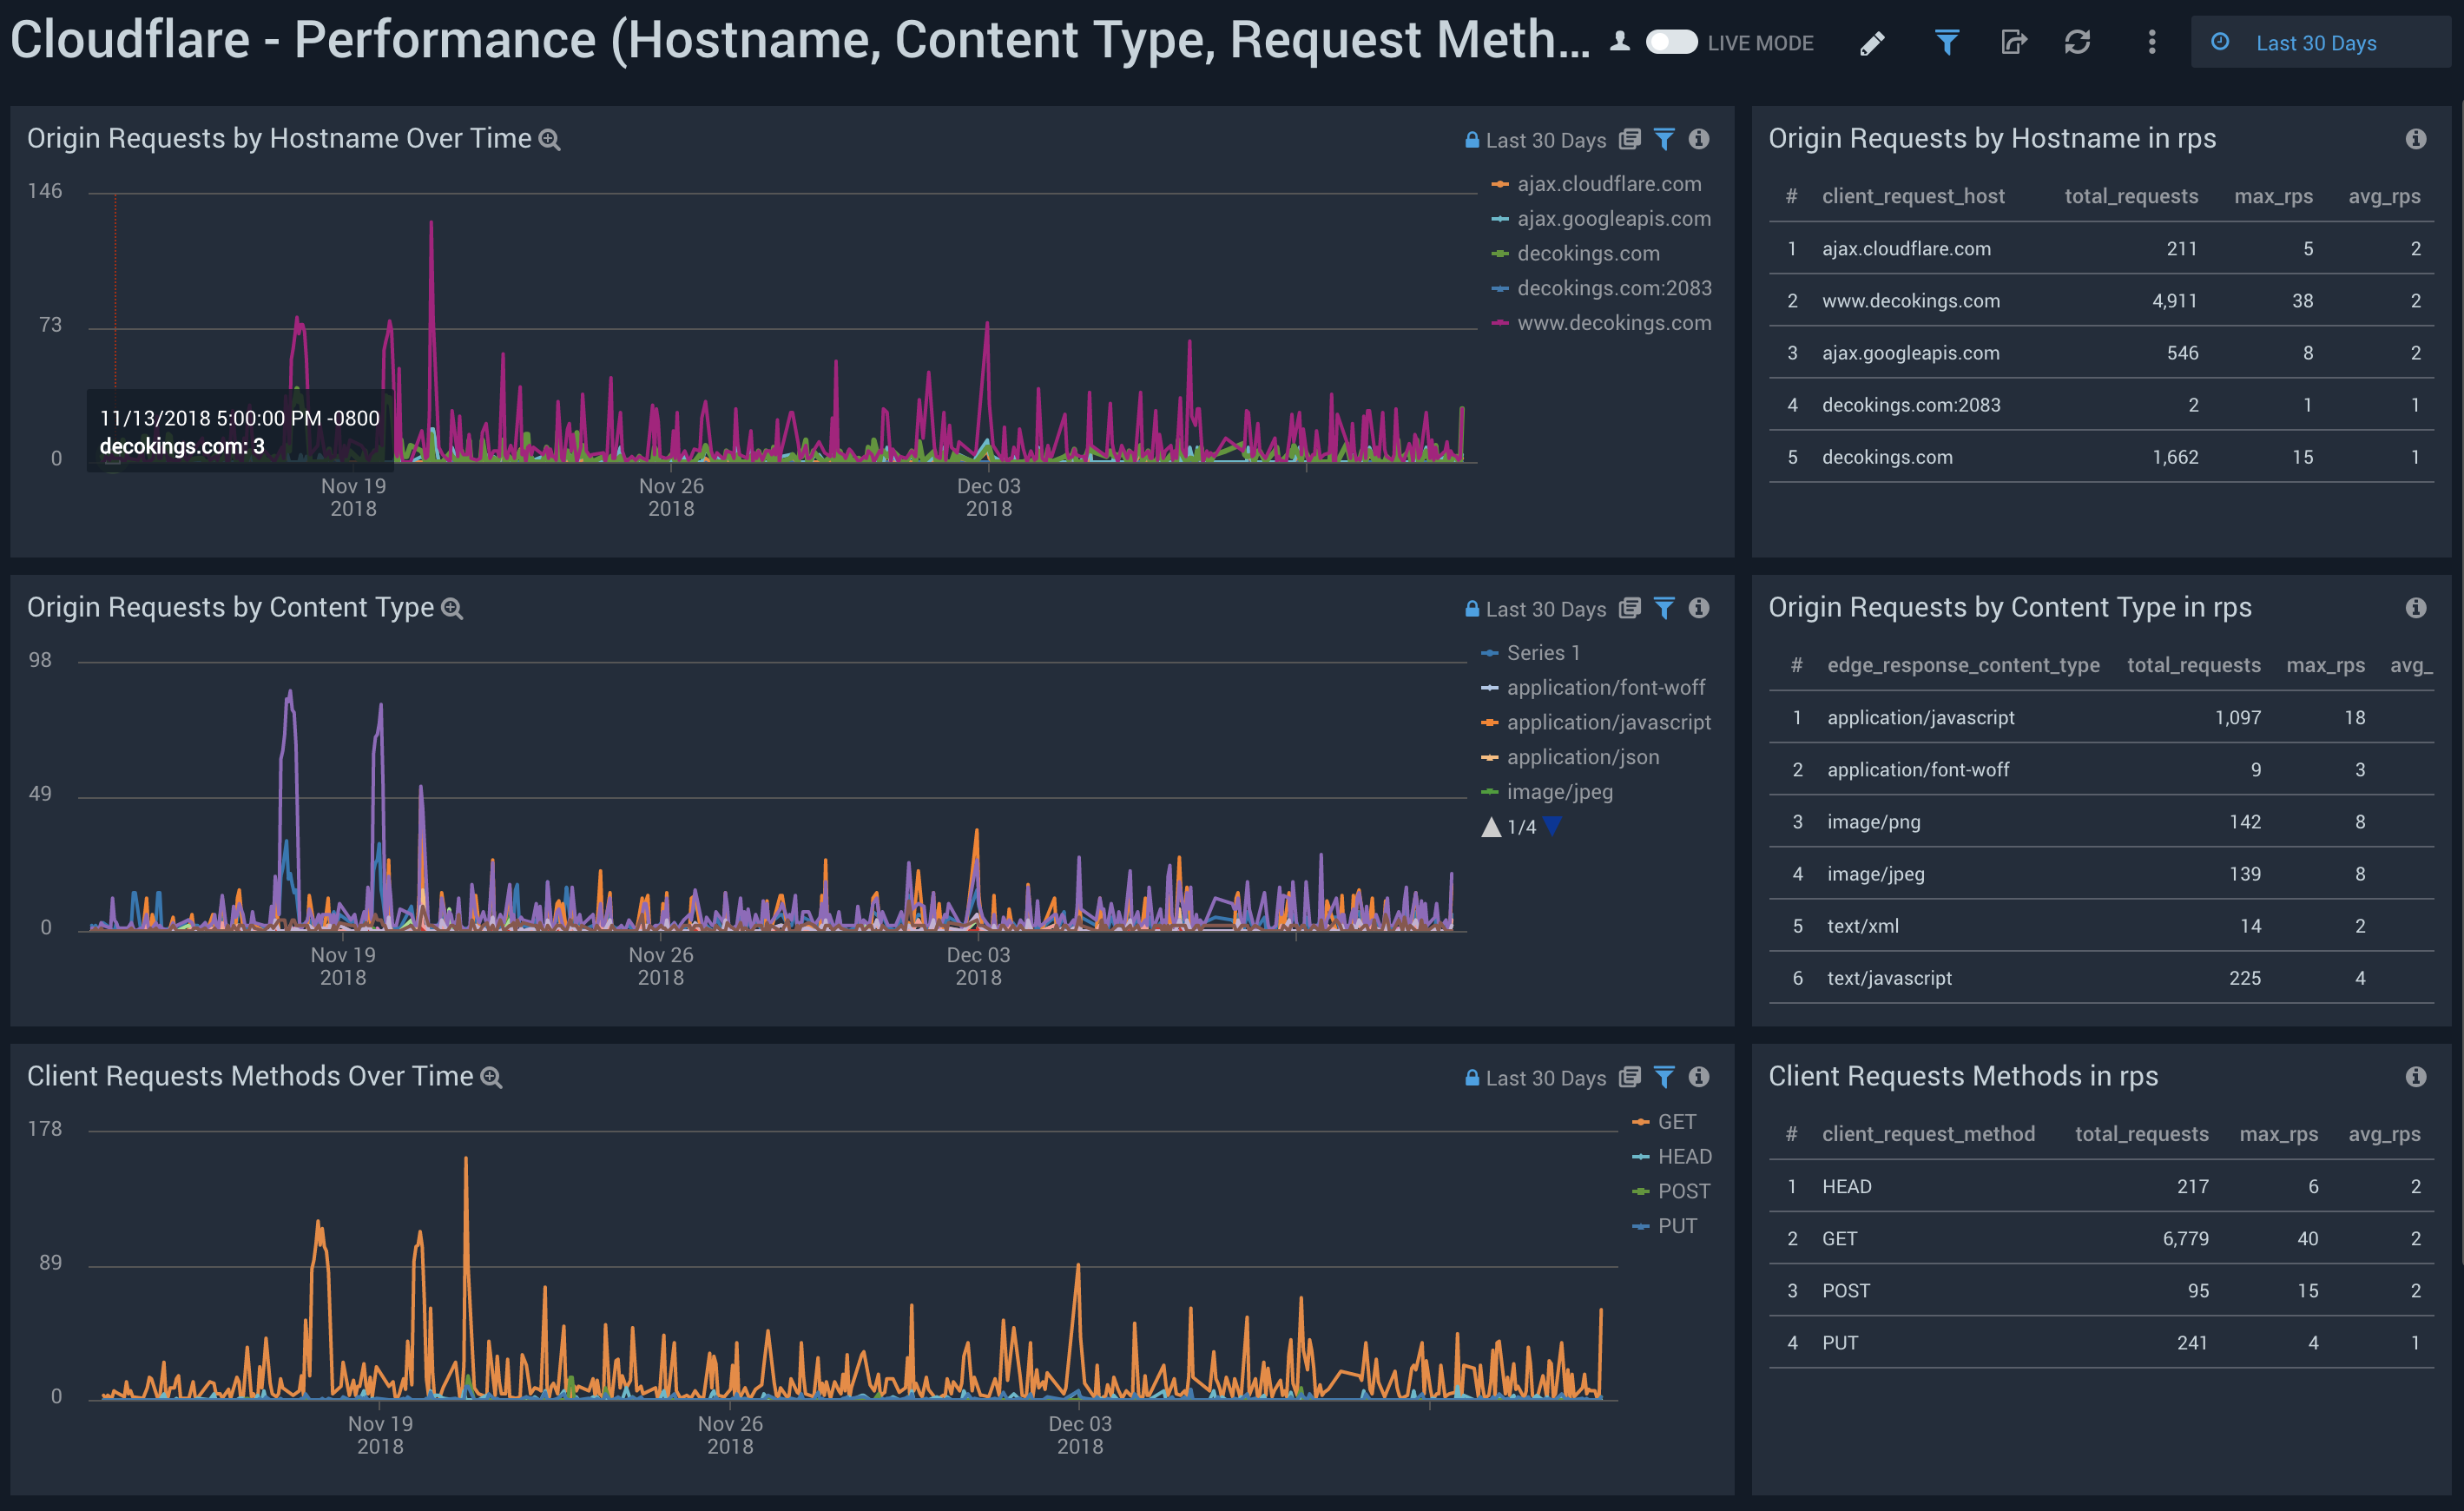
Performance (Hostname, Content Type, Request Methods, Connection Type)
Cloudflare - Performance (Hostname, Content Type, Request Methods, Connection Type) Dashboard provides insights into your most popular hostnames, most requested content types, breakdown of request methods, and connection type.
Use this dashboard to:
- Review the most requested content types, popular hostnames, and top triggered methods and TLS protocols.
- Compare these metrics over time and in requests per second.
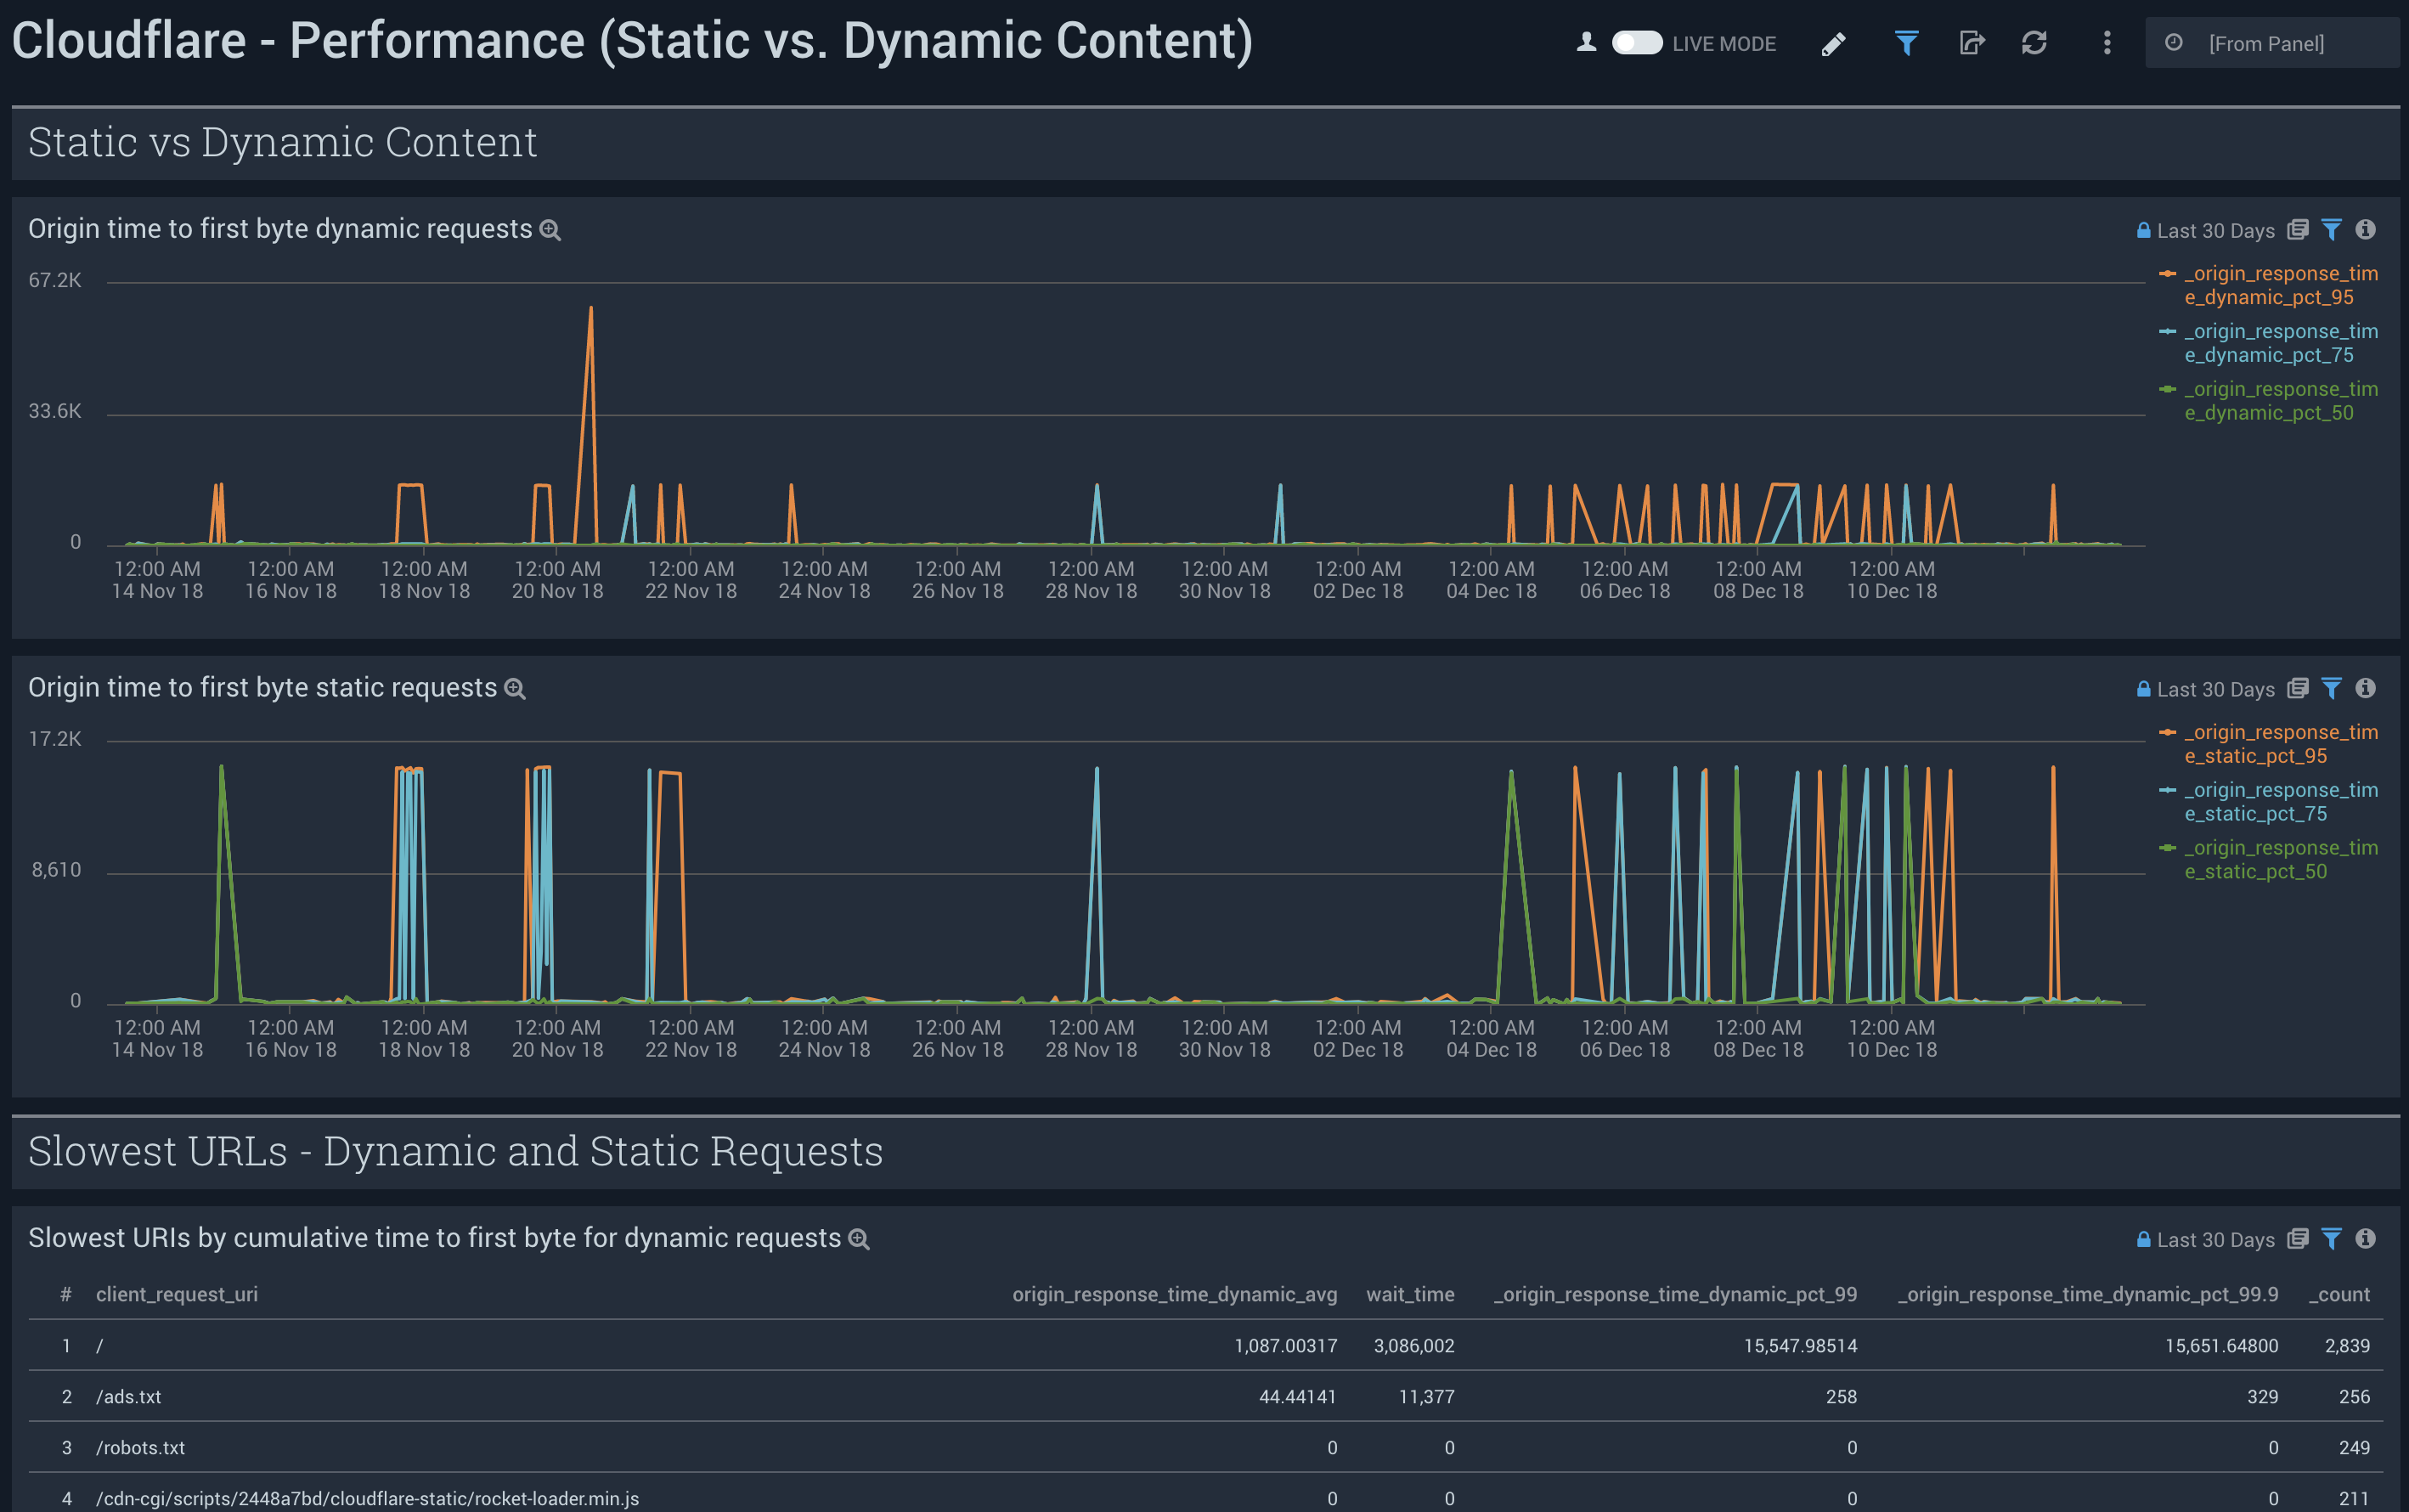
Performance (Static vs. Dynamic Content)
Cloudflare - Performance (Static vs. Dynamic Content) Dashboard provides insights into the performance of your static and dynamic content, including slowest URLs.
Use this dashboard to:
- Compare your static and dynamic content performance.
- Investigate the cause of slow requested URLs in order to improve performance.