Microsoft Exchange Trace Logs
The MessageTrace API offers insight into the handling of emails that have gone through Office 365 for an organization. The Sumo Logic Microsoft Exchange Trace Logs App provides information on the delivery status of messages including Delivered, Failed, Quarantined, Pending, and Spam. The app dashboard analyzes message size, sender and receiver locations, and provides threat analysis by utilizing the CrowdStrike threat detection feed.
Log types
The Sumo Logic App for Microsoft Exchange Trace Logs uses the MessageTrace reports. To learn about the Microsoft Exchange Trace logs fields, see the Fields documentation.
Sample Log Messages
{
 "odata.metadata": "https://reports.office365.com/ecp/ReportingWebService/Reporting.svc/$metadata#MessageTrace",
 "value": [
   {
     "Organization": "org.onmicrosoft.com",
     "MessageId": "<233af449-87f6-4902-bcf5-77838a4e7603@az.southcentralus.unknown.microsoft.com>",
     "Received": "2022-11-29T05:35:08.2652371",
     "SenderAddress": "azure-noreply@microsoft.com",
     "RecipientAddress": "ebenzoni@org.onmicrosoft.com",
     "Subject": "Azure AD Identity Protection Weekly Digest",
     "Status": "Delivered",
     "ToIP": null,
     "FromIP": "20.97.34.221",
     "Size": 145153,
     "MessageTraceId": "aa1a3e28-8967-4bfb-06d3-08dad1cb7a0e",
     "StartDate": "2022-11-27T17:08:26.8492706Z",
     "EndDate": "2022-11-29T17:08:26.8492706Z",
     "Index": 0
   },
   {
     "Organization": "org.onmicrosoft.com",
     "MessageId": "<c41de266-153b-487c-a142-618d99505b38@az.southcentralus.unknown.microsoft.com>",
     "Received": "2022-11-29T05:35:07.7450561",
     "SenderAddress": "azure-noreply@microsoft.com",
     "RecipientAddress": "lmilby@org.onmicrosoft.com",
     "Subject": "Azure AD Identity Protection Weekly Digest",
     "Status": "Delivered",
     "ToIP": null,
     "FromIP": "20.97.34.221",
     "Size": 144900,
     "MessageTraceId": "0c1d5652-d2eb-496c-a741-08dad1cb79be",
     "StartDate": "2022-11-27T17:08:26.8492706Z",
     "EndDate": "2022-11-29T17:08:26.8492706Z",
     "Index": 1
   },
   {
     "Organization": "org.onmicrosoft.com",
     "MessageId": "<072e0c5d-66d0-40ac-a376-52b11344255a@az.northcentralus.unknown.microsoft.com>",
     "Received": "2022-11-29T05:35:07.2828271",
     "SenderAddress": "azure-noreply@microsoft.com",
     "RecipientAddress": "sumo-apps@org.onmicrosoft.com",
     "Subject": "Azure AD Identity Protection Weekly Digest",
     "Status": "Delivered",
     "ToIP": null,
     "FromIP": "20.51.6.33",
     "Size": 145123,
     "MessageTraceId": "4d68a1db-9375-4ae8-1f6f-08dad1cb7978",
     "StartDate": "2022-11-27T17:08:26.8492706Z",
     "EndDate": "2022-11-29T17:08:26.8492706Z",
     "Index": 2
   }
 ]
}
Sample Queries
_sourceCategory="o365dummy"
| json "Organization", "MessageId", "Received","SenderAddress", "RecipientAddress", "Subject", "Status", "ToIP", "FromIP", "Size", "MessageTraceId", "StartDate", "EndDate", "Index" as organization, message_id, received, sender_address, recipient_address, subject, status, toIP, fromIP, size, message_traceId, start_date, end_Date, index nodrop
| where status matches"{{status}}"
| where sender_address matches"{{sender_address}}"
| where organization matches "{{organization}}"
| lookup latitude, longitude, country_code, country_name, region, city, postal_code from geo://location on ip = fromIP
| where country_name matches "{{country}}"
| timeslice 1d
| count by _timeslice, status
| fillmissing timeslice, values all in status
| transpose row _timeslice column status
Collecting logs from Microsoft Exchange Trace Logs App
This section explains how to collect logs from Microsoft Exchange Trace logs Api and ingest them into Sumo Logic. Refer to the Microsoft Exchange Trace logs Api Cloud-to-Cloud Integration to create the source and use the same source category while installing the app.
Installing the Microsoft Exchange Trace Logs app
Locate and install the app from the App Catalog. If you want to see a preview of the dashboards included with the app before installing, click Preview Dashboards.
To install the app, follow the steps below:
- From the App Catalog, search for the app and select it.
- Select the version of the service you're using and click Add to Library.note
Version selection is applicable only to a few apps currently. For details, see the Install the Apps from the Library.
- To install the app, enter the following fields.
- App Name. You can retain the existing name, or enter a name of your choice for the app.
- Data Source. Select either of these options for the data source:
- Choose Source Category and then choose a source category from the list.
- Select Enter a Custom Data Filter and type in a custom source category that starts with an underscore. For Example,
_sourceCategory=MyCategory.
- Advanced. Select the Location in Library (the default is the Personal folder in the library), or click New Folder to add a new folder.
- Click Add to Library.
Once an app is installed, it will appear in your Personal folder, or other folder that you specified. You can share it with your organization.
The panels will begin to fill automatically. It's worth noting that each panel gradually fills with data that matches the time range query and has been received since the panel was created. The results will not be available right away, but with some patience, you will be able to view full graphs and maps.
Viewing Microsoft Exchange Trace Logs Dashboards
- All dashboard have a set of filters that you can apply to the entire dashboard, as shown in the following example. Click the funnel icon in the top dashboard menu bar to display a scrollable list of filters that are applied across the entire dashboard.
- You can use filters to drill down and examine the data on a granular level. Filters include client country, client device type, client IP, client request host, client request URI, client request user agent, edge response status, origin IP, and origin response status.
- Each panel has a set of filters that are applied to the results for that panel only, as shown in the following example. Click the funnel icon in the top panel menu bar to display a list of panel-specific filters.
Overview
Microsoft Exchange Trace Logs - Overview. The Dashboard provides information on the delivery status of messages, including outliers, and a summary of the message size. 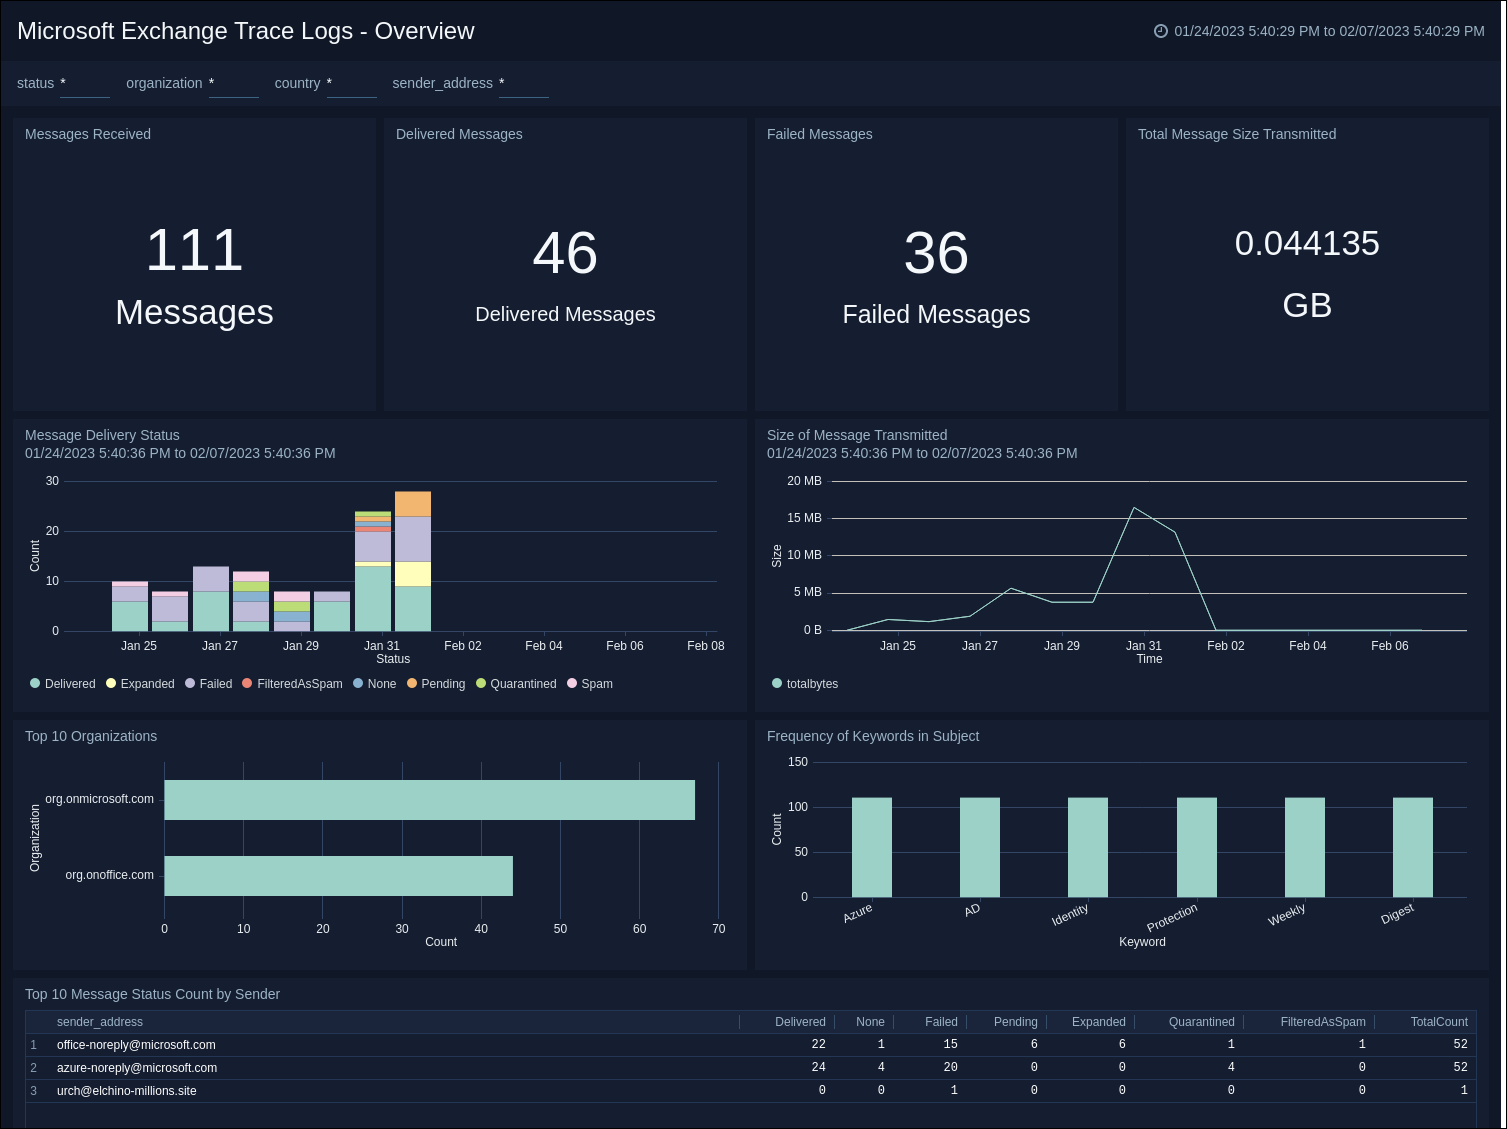
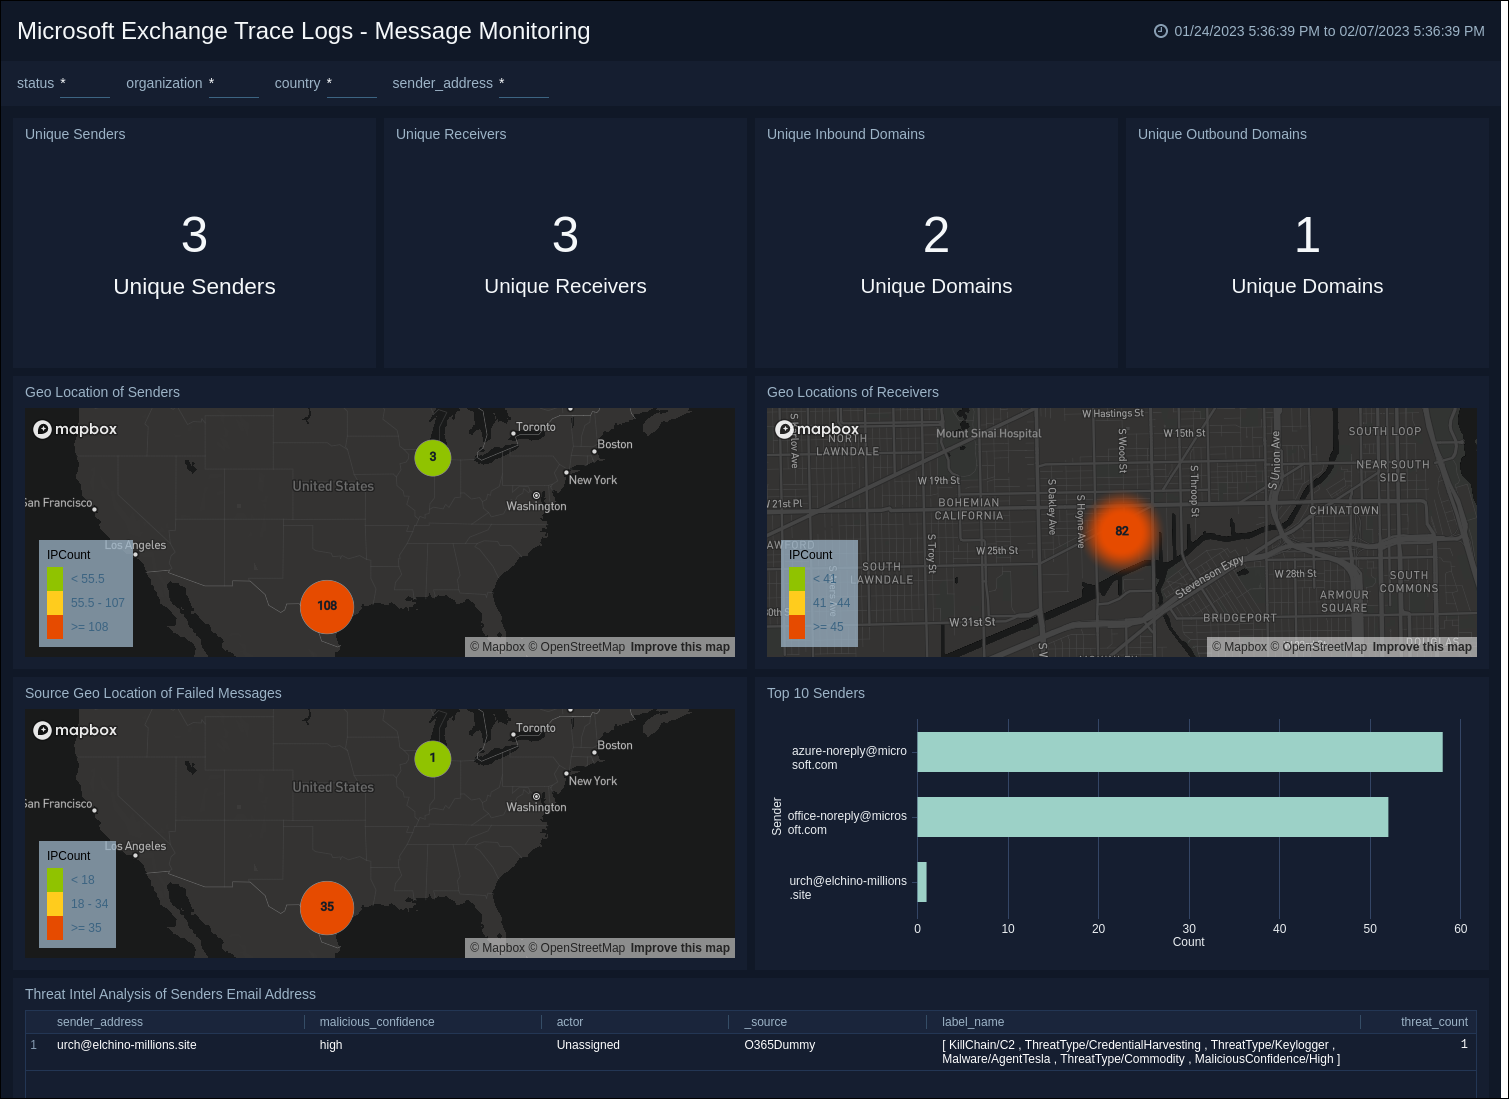
Message Monitoring
Microsoft Exchange Trace Logs - Message Monitoring. The Dashboard mainly focuses on the message traffic, including the number of unique senders and receivers and their domains. It shows the geographical locations of senders, receivers, and failed messages, and performs security threat analysis on the senders. Additionally, it displays the top 10 senders.