Opsgenie

The Opsgenie App provides at-a-glance views and detailed analytics for alerts on your DevOps environment, allowing you to effectively monitor and gain valuable insights into your incidents and incident handling operations.
Opsgenie is an incident management platform for operating services that are on 24/7. Opsgenie allows you to plan for service disruptions and stay in control during incidents. Opsgenie centralizes alerts and reliably notifies the correct contacts to ensure timely analysis and efficient action.
For more information, see the Opsgenie Alerts and Alert Fields documentation.
Log Types
Sumo Logic - Opsgenie integration supports the following Alert types:
- Create
- AddRecipient
- Acknowledge
- AddNote
- UnAcknowledge
- EscalateToNext
- Escalate
- Close
Sample Log Message
Different Alert types used by Opsgenie, with sample payloads, are defined here: https://docs.opsgenie.com/docs/sample-alert-action-data
Sample Query
The following query sample is taken from the Alerts by Priority Over Time panel on the Opsgenie - Alerts Breakdown Dashboard:
_sourceCategory="opsgenie/events" Create
| json "alert.createdAt", "alert.description", "alert.message", "action", "alert.team",
"alert.priority", "alert.source" , "alert.tags[*]","alert.recipients[*]" as created_at,
description, message, action, team, priority, source, tags, recipients nodrop
| where action = "Create"
| timeslice 1h
| count by _timeslice, priority
| transpose row _timeslice column priority
Collecting Logs for Opsgenie
The Sumo Logic Opsgenie App is designed to effectively monitor Opsgenie alerts, team performances, detect any outliers, and track the team's Mean time to repair (MTTR) incidents. With Sumo Logic dashboards you can easily identify:
- Alerts by Type Over Time
- Alerts Created - Outlier
- Alerts Escalated - Outlier
- Alerts Breakdown by Team/Priority/Users/Sources/Tags
- Alerts Created/Closed/Escalated/Acknowledged/Escalated to Next
- Alerts - One Day Time Comparison
- Alerts MTTR with additional details
Configuring collection
This section explains the log collection process, and then walks you through the steps for configuring log collection for the Sumo Logic App for Opsgenie.
There are two methods for integrating Opsgenie with Sumo Logic:
- When an action happens at Opsgenie alerts, the webhook data is forwarded to the Sumo Logic and the data appears in the Opsgenie App. This integration method are described in this section.
- Sumo Logic sends webhook alerts to Opsgenie which acts as a dispatcher for these alerts and determines the right people to notify based on on-call schedules, and notifies them via email, text messages (SMS), phone calls, and iPhone & Android push notifications, and escalates alerts until the alert is acknowledged or closed. This data is not utilized by the Opsgenie App, but you can configure this integration by following the instructions provided in this Set Up Webhook Connections document. Opsgenie Alerts are defined at the Team level, so you need to create an Opsgenie - Sumo Logic Webhook integrations for each team.
To configure log collection for the Opsgenie App, do the following:
Configure a Sumo Logic HTTP Source, an endpoint for receiving log and metric data uploaded to a unique URL generated for the Source. Make a note of the URL for the endpoint, as you will need to enter the endpoint URL in step 3.
Follow the Opsgenie Webhook Integration instructions to create a Webhook integration for the Opsgenie App. Webhook connections allow you to send Sumo Logic alerts to third-party applications that accept incoming Webhooks.
Specify the following parameters to send Opsgenie alerts to Sumo Logic:
- For Webhook URL field provide Sumo Logic HTTP URL (from step 1).
- Check Add Alert Description to Payload.
- Check Add Alert Details to Payload.
The Final Configuration for your integration should look similar to the following example:
(Optional) Create an Opsgenie - Sumo Logic Webhook integration for each team. Opsgenie Alerts are defined at the Team level. In the following example shows two Webhook Integrations, one for each team. Sending Opsgenie alerts to Sumo Logic for analysis with the predefined searches and dashboards provided by the Opsgenie App.
Installing the Opsgenie App
This section provides instructions for installing the Opsgenie App, as well as examples of each of the app dashboards.
To install the app, do the following:
Locate and install the app you need from the App Catalog. If you want to see a preview of the dashboards included with the app before installing, click Preview Dashboards.
- From the App Catalog, search for and select the app.
- Select the version of the service you're using and click Add to Library. Version selection is applicable only to a few apps currently. For more information, see Installing the Apps from the Library.
- To install the app, complete the following fields.
- App Name. You can retain the existing name, or enter a name of your choice for the app.
- Data Source. Select either of these options for the data source.
- Choose Source Category, and select a source category from the list.
- Choose Enter a Custom Data Filter, and enter a custom source category beginning with an underscore. Example: (
_sourceCategory=MyCategory).
- Advanced. Select the Location in Library (the default is the Personal folder in the library), or click New Folder to add a new folder.
- Click Add to Library.
Once an app is installed, it will appear in your Personal folder, or other folder that you specified. From here, you can share it with your organization.
Panels will start to fill automatically. It's important to note that each panel slowly fills with data matching the time range query and received since the panel was created. Results won't immediately be available, but with a bit of time, you'll see full graphs and maps.
Viewing OpsGenie Dashboards
Template variables provide dynamic dashboards that can rescope data on the fly. As you apply variables to troubleshoot through your dashboard, you view dynamic changes to the data for a quicker resolution to the root cause. You can use template variables to drill down and examine the data on a granular level. For more information, see Filter with template variables.
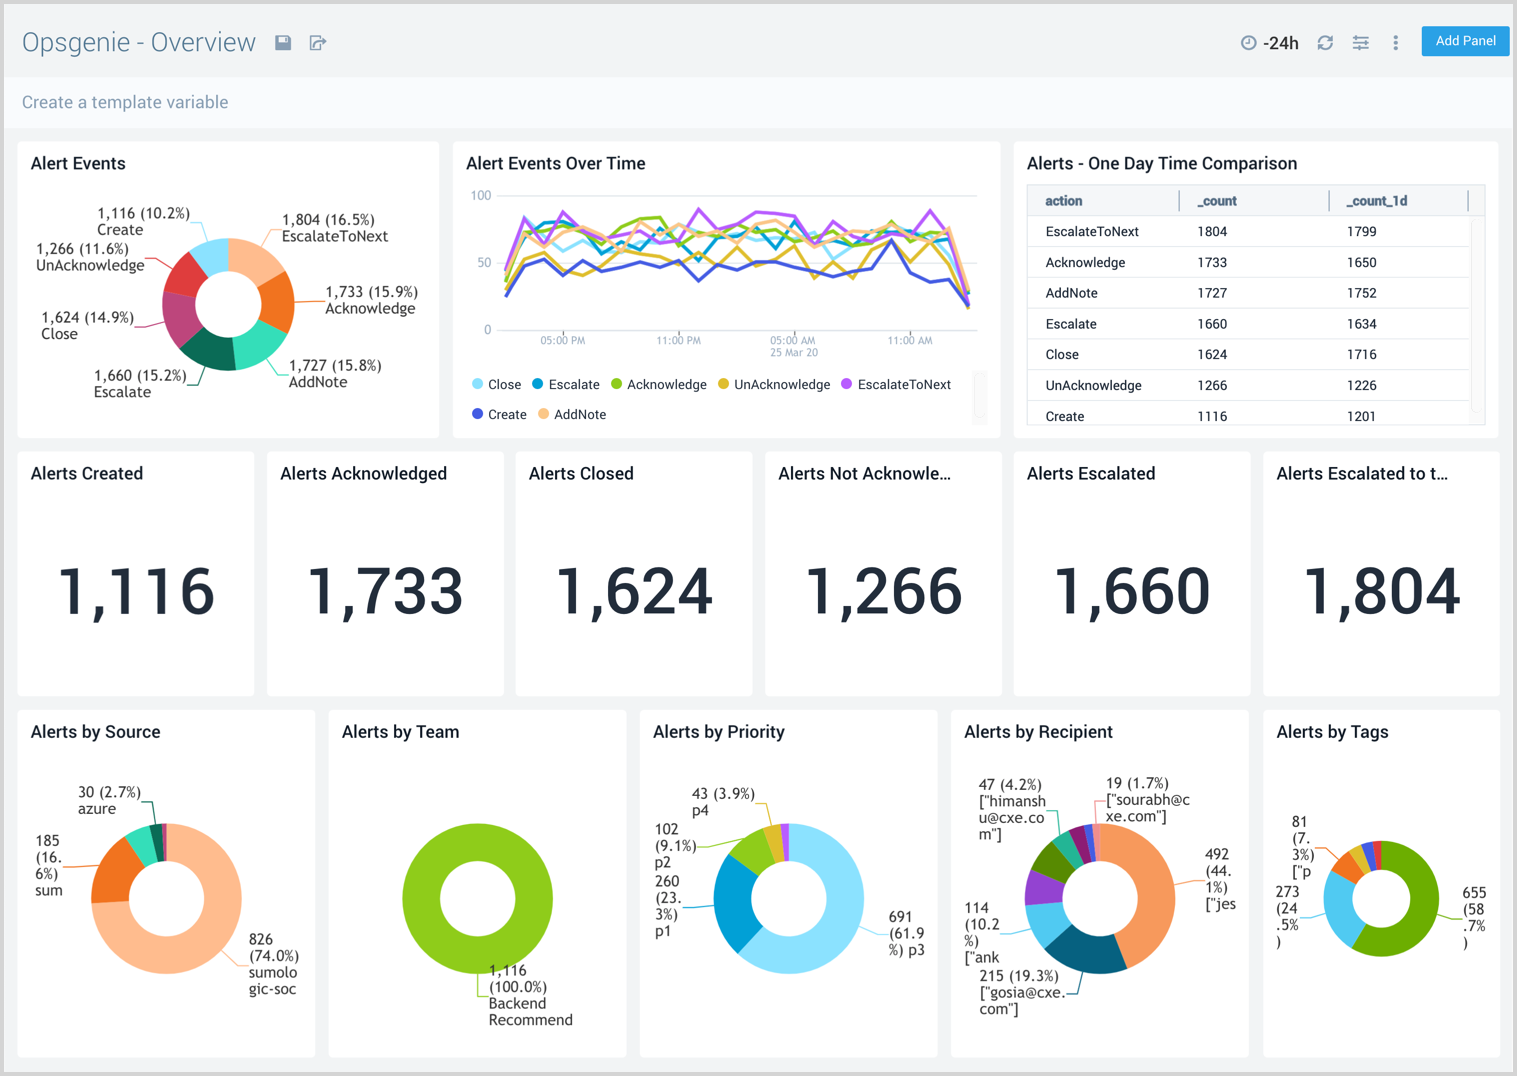
Overview
The Opsgenie - Overview Dashboard provides a high level view of alert types, details, trends, and comparisons. The at-a-glance graphs are an easy to access visual reference for alert breakdowns by source, team, priority, recipient, and tags.
Use this dashboard to:
- Monitor key KPIs such as Alerts Created/Closed/Escalated/Acknowledged/Escalated to Next.
- Track trends for different alert types in the Alerts over Time panel.
- Identify any spikes or unusual behavior in your DevOps environment, then identify the root cause by drilling further down to view related fields.
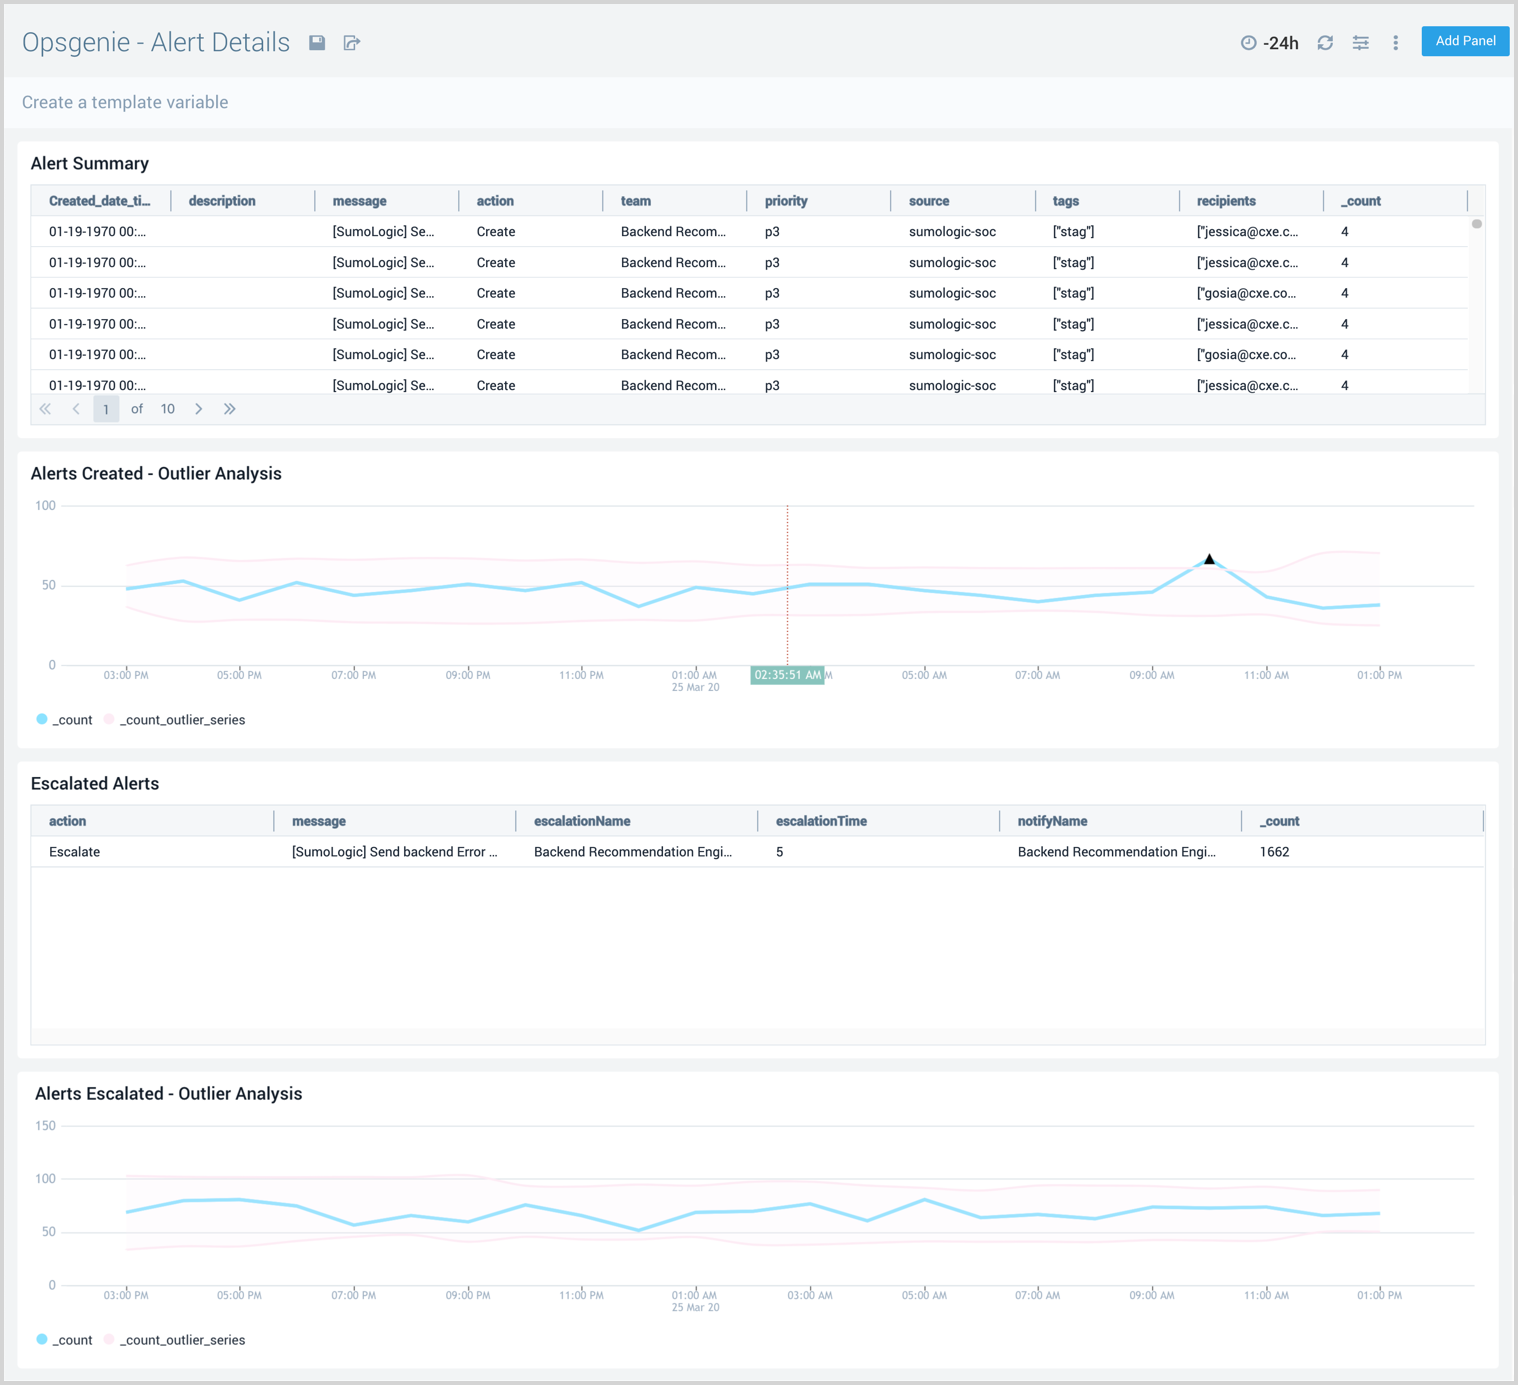
Alert Details
The Opsgenie - Alert Details Dashboard provides detailed graphs and analytics for alert outliers, escalated alerts, and alert summaries.
Use this dashboard to:
- Gain visibility into the summary and source of the incident to help DevOps teams debug the root cause of the issue.
- Use panel filters to slice the information by source, priority, team and users.
- Track outlier in Alert Escalations to notify on-call teams to take appropriate action, and prevent any production outages.
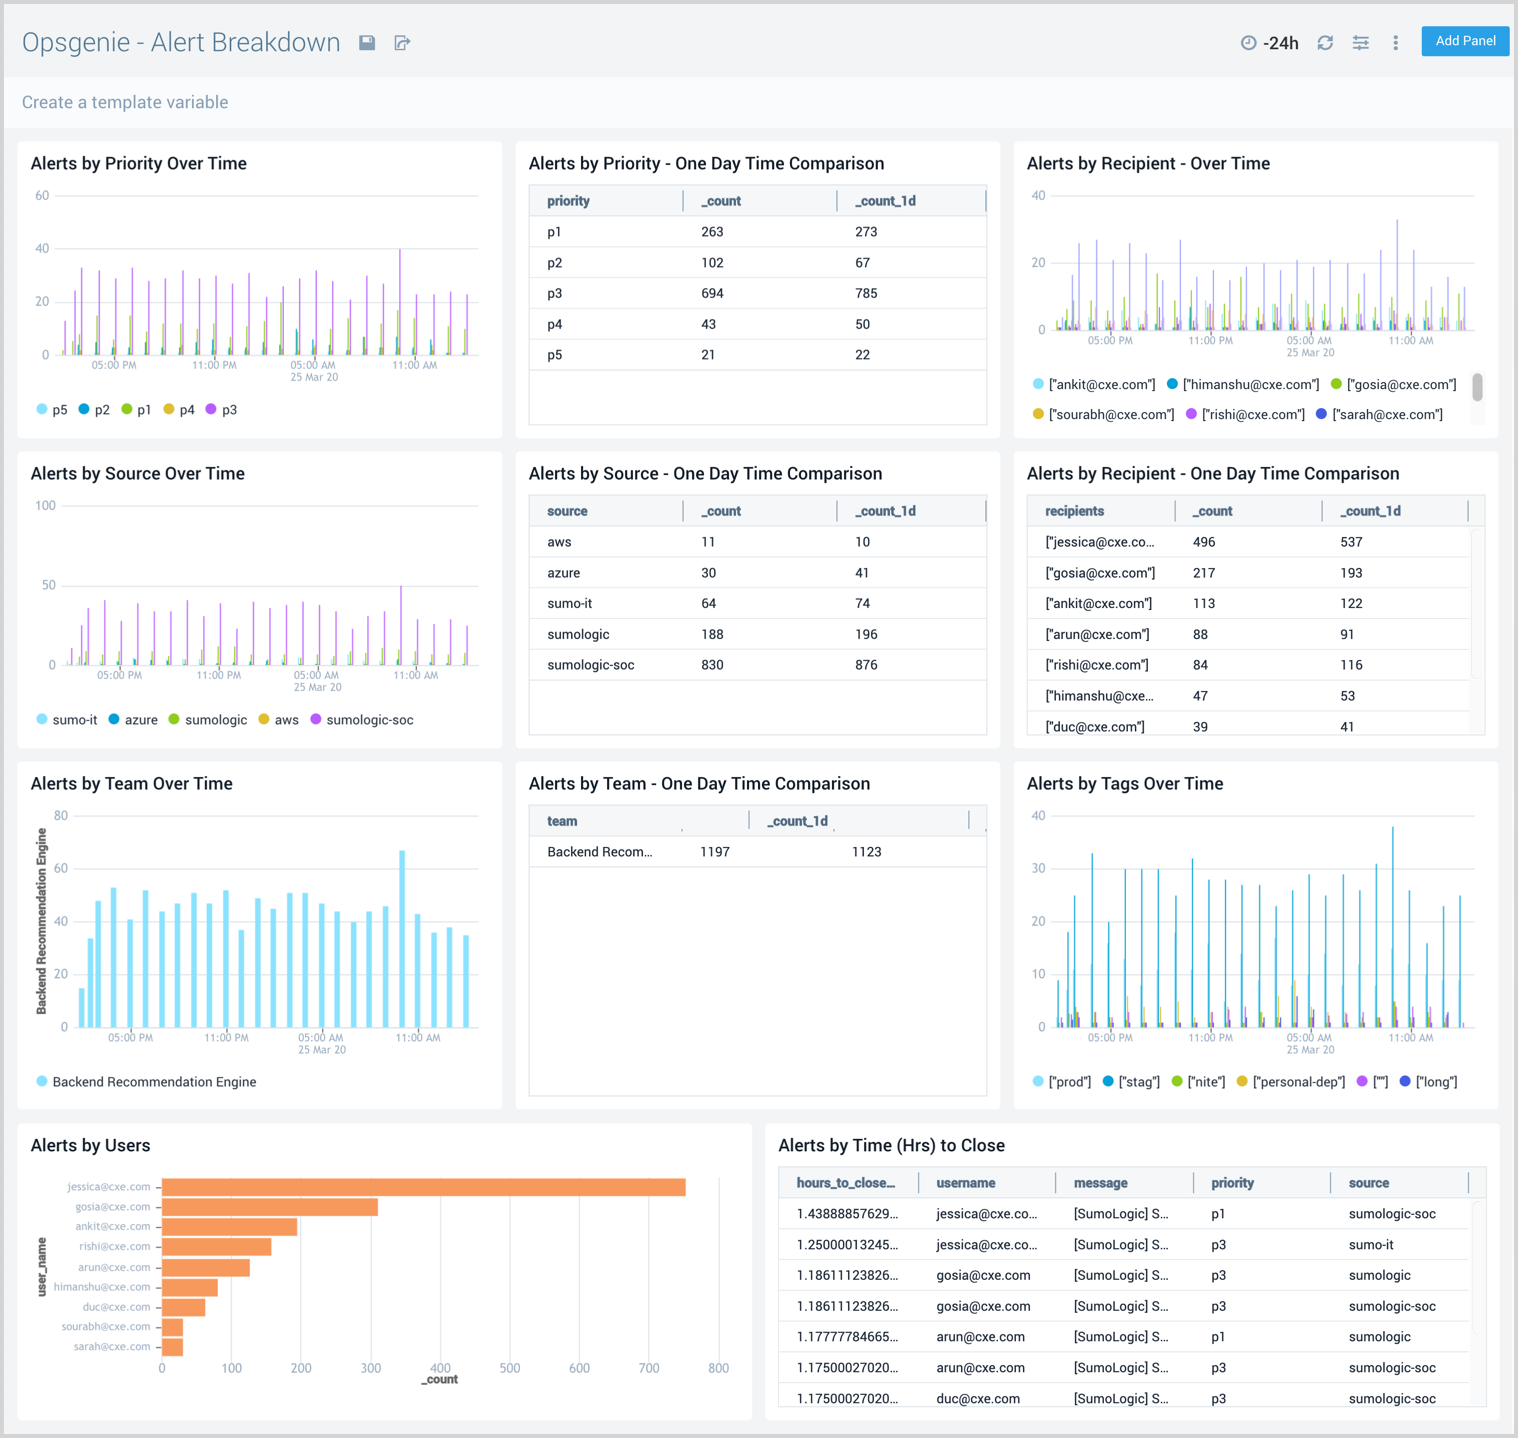
Alert Breakdown
The Opsgenie - Alert Breakdown Dashboard provides visual graphs and detailed tables with analytics on alerts by priority, source, team, users, tags, and recipient, over time and by comparison.
Use this dashboard to:
- Provide further visibility into alerts by breaking them down by different dimensions such as team, source, tags, users and priority.
- Use bar graphs to identify unusual behavior or spikes across these dimensions.
- Compare current status of Opsgenie Alerts within your Infrastructure to Yesterday’s status