Akamai Cloud Monitor

The Sumo Logic App for Akamai Cloud Monitor allows you to analyze and correlate Akamai data with origin data in order to improve availability and performance of applications, improve end-user experience, gain deeper user insights, and enforce rigorous security controls. The app uses predefined searches and Dashboards that provide visibility into your environment for real-time analysis of overall usage.
Log Types
The Sumo Logic App for Akamai Cloud Monitor assumes Akamai formatted logs, which provide one log message for each request.
For information about Akamai Cloud Monitor log formats, contact Akamai Support and request the document “Akamai Log Delivery User Guide.” Refer to “Appendix A: Log Formats and Examples."
Sample Log Messages
{
        "type": "cloud_monitor",
        "format": "default",
        "version": "1.0",
        "id": "dce9bc83ff6820435e6633e",
        "start": "1379543560.807",
        "cp": "180370",
        "message": {
            "proto": "http",
            "protoVer": "1.0",
            "status": "200",
            "cliIP": "109.31.186.162",
            "reqPort": "80",
            "reqHost": "www2.acmeco.com",
            "reqMethod": "GET",
            "reqPath": "/cart?display=full",
            "respCT": "",
            "respLen": "",
            "bytes": "",
            "UA": "Chrome/35.0.1916.153",
            "fwdHost": ""
    },
    "reqHdr": {
            "accEnc": "gzip",
            "conn": "Keep-Alive"
},
"respHdr": {
        "accRange": "bytes",
        "conn": "keep-alive",
        "contEnc": "gzip",
        "date": "2016-09-23 23:04:45.697 +0000",
        "eTag": "\"\"",
        "lastMod": "Mon,%2023%20Jan%202012%2001:44:17%20GMT",
        "server": "Apache/2.2.14%20(Ubuntu)",
        "cookie": "987597820765"
},
"netPerf": {
        "downloadTime": "1594",
        "netOriginLatency": "40",
        "originName": "down",
        "originIP": "",
        "originInitIP": "10.10.10.10",
        "originRetry": "0",
        "lastMileRTT": "43",
        "cacheStatus": "1",
        "firstByte": "1",
        "lastByte": "1",
        "asnum": "4812",
        "edgeIP": ""
},
"geo": {
        "country": "us",
        "region": "",
        "city": ""
},
"waf": {
        "logVer": ""
},
"ipRules": "",
"warnRules": "",
"denyRules": ""
}
Sample Queries
_sourceCategory=akamai 50?
| parse "\"reqPath\":\"*\"" as path, "\"status\":\"*\"" as status
| urldecode(path) as path
| where status > 499
| where status < 600
| count as errors by path
| sort by errors
_sourceCategory=akamai cacheStatus
| parse "\"cacheStatus\":\"*\"" as status
| where !(status="")
| if(status="0", "0 - Non cacheable", if(status="1" OR status="2", "1/2 - Cache Hit", if(status="3", "3 - Cache Miss", ""))) as cachestatus
| count bycachestatus
_sourceCategory=akamai waf denyRules reqHost
| parse "\"denyRules\":\"*\"" as deny, "\"reqHost\":\"*\"" as host
| where deny != ""
| timeslice 1m
| count by host, _timeslice
| transpose row _timeslice column host
Collect Logs for Akamai Cloud Monitor
This procedure explains how to collect logs from Akamai Cloud Monitor and ingest them into Sumo Logic.
Enable Akamai Cloud Monitor
Akamai Cloud Monitor is the service that generates transactional information for your Akamai CDN. To enable Cloud Monitor in your Akamai environment, use the instructions at: https://techdocs.akamai.com/property-mgr/docs/cloud-monitor-instrumentation
Configure a Collector
In Sumo Logic, create a new Hosted Collector.
Configure a Source
- Configure an HTTP Source.
- Configure the Source Fields as follows:
- Name. Required. For example, use Akamai.
- Source Category. Required. For example, use akamai_cloud_monitor. (The Source Category metadata field is a fundamental building block to organize and label Sources. For details see Best Practices.)
- Configure the Advanced section:
- Check Extract timestamp information from log file entries.
- Timezone. Use time zone from log file. If none is present, use UTC.
- Timestamp Format. Auto-Detected
- Encoding Type. UTF-8
- Enable Multiline Processing.
- Detect Messages Spanning Multiple Lines. False
- Multi Line Boundary. NA
- Click Save.
Save the URL endpoint that is generated for your HTTP Source. You will use it to configure Akamai.
Configure Akamai
- In Akamai, open the Luna Control center and navigate to the property you’d like to work with.
- Create a new version for the property and select it.
- Scroll down to the Property Manager Configuration section.
- Select Add Rule and choose Cloud Management.
- Add Cloud Monitor Instrumentation.
- Add the path from your Sumo Logic URL endpoint, generated from the HTTP Source, in the Delivery URL Path section. It should start with
/receiver/v1/http/<your unique endpoint>. - Return to the screen where you can see your main property and add a new property.
- Make sure to apply your TLS certificate so it can handle HTTPS traffic.
- Set the origin server as the server from your Sumo Logic URL endpoint.
- Set the HTTPS port to
443.
Field Extraction Rules
Field Extraction Rules (FERs) tell Sumo Logic which fields to parse out automatically. For instructions, see Create a Field Extraction Rule.
- In Sumo Logic, go to Manage Data > Logs > Field Extractions and click Add.
- Configure the following fields:
- Rule Name. Required (for example, Akamai Cloud Monitor).
- Scope. Use the Source Category you created for your HTTP Source (for example, akamai_cloud_monitor).
- Parse Expression. Select the template Akamai Cloud Monitor and click Use Template. The full parse statement is below.
- Click Add.
parse "\"reqMethod\":\"*\"" as method, "\"status\":\"*\"" as status, "\"fwdHost\":\"*\"" as origin
| parse "\"bytes\":\"*\"" as bytes, "\"edgeIP\":\"*\"" as edgeip, "\"country\":\"*\"" as country, "\"cookie\":\"*\"" as cookie
Installing the Akamai Cloud Monitor App
Now that you have configured Akamai logs, install the Sumo Logic App for Akamai Cloud Monitor to take advantage of the pre-configured searches and dashboards to analyze your Akamai data.
To install the app:
Locate and install the app you need from the App Catalog. If you want to see a preview of the dashboards included with the app before installing, click Preview Dashboards.
- From the App Catalog, search for and select the app.
- Select the version of the service you're using and click Add to Library. Version selection is applicable only to a few apps currently. For more information, see Installing the Apps from the Library..
- To install the app, complete the following fields.
- App Name. You can retain the existing name, or enter a name of your choice for the app.
- Data Source. Select either of these options for the data source.
- Choose Source Category, and select a source category from the list.
- Choose Enter a Custom Data Filter, and enter a custom source category beginning with an underscore. Example: (
_sourceCategory=MyCategory).
- Advanced. Select the Location in Library (the default is the Personal folder in the library), or click New Folder to add a new folder.
- Click Add to Library.
Once an app is installed, it will appear in your Personal folder, or other folder that you specified. From here, you can share it with your organization.
Panels will start to fill automatically. It's important to note that each panel slowly fills with data matching the time range query and received since the panel was created. Results won't immediately be available, but with a bit of time, you'll see full graphs and maps.
Viewing Akamai Cloud Monitor Dashboards
Overview

Map (Unique Visitors). Performs a geo lookup operation and displays the number of visitors to your site and their locations on a map of the world by IP address over the last 15 minutes.
Download Performance Hotspots - Average Download Above 300 by Country. Uses a geo lookup operation to display performance download time hotspots on a map of the world by IP addresses, which allows you to see a count of hits per location for the last hour.
Countries. Displays the originating country of visitors to your site by IP address over the last three hours in a pie chart. Hover over a section of the pie chart to display more details.
Top 404-Causing URLs. Displays the top 25 URLs that have produced a 404 error in the last 15 minutes and counts the errors in a bar chart.
Top Error-Causing URLs. Displays the URLs that have produced the most errors in the last 15 minutes and counts the errors in a bar chart.
Origin Performance
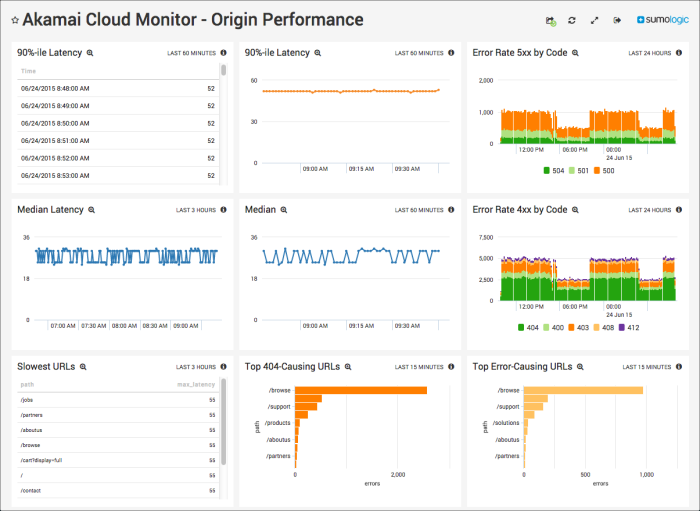
90%-ile Latency. Displays the 90th percentile of the origin response time latency as an aggregation table for the last hour.
Median Latency. Shows the median of the origin response time latency as a line chart on a timeline for the last 3 hours, using timeslices of one minute.
Slowest URLs. Lists the top 10 slowest URLs, including the path and the maximum latency metric for the last 3 hours, in a line chart.
90%-ile Latency. Displays the 90th percentile of the data center response time latency as a line chart on a timeline for the last hour, using timeslices of one minute.
Median. Shows the median of the data center response time latency as a line chart on a timeline for the last hour, using timeslices of one minute.
Top 404-Causing URLs. Displays the top 25 URLs that have produced a 404 error in the last 15 minutes and counts the errors in a bar chart.
Error Rate 5xx by Code. Shows the number of 5xx error events by code in a stacked column chart on a timeline using timeslices of 10 minutes for the past 24 hours.
Error Rate 4xx by Code. Displays the number of 4xx error events by code in a stacked column chart on a timeline using timeslices of 10 minutes for the past 24 hours.
Top Error-Causing URLs. Displays the URLs that have produced the most errors in the last 15 minutes and counts the errors in a bar chart.
Quality of Service
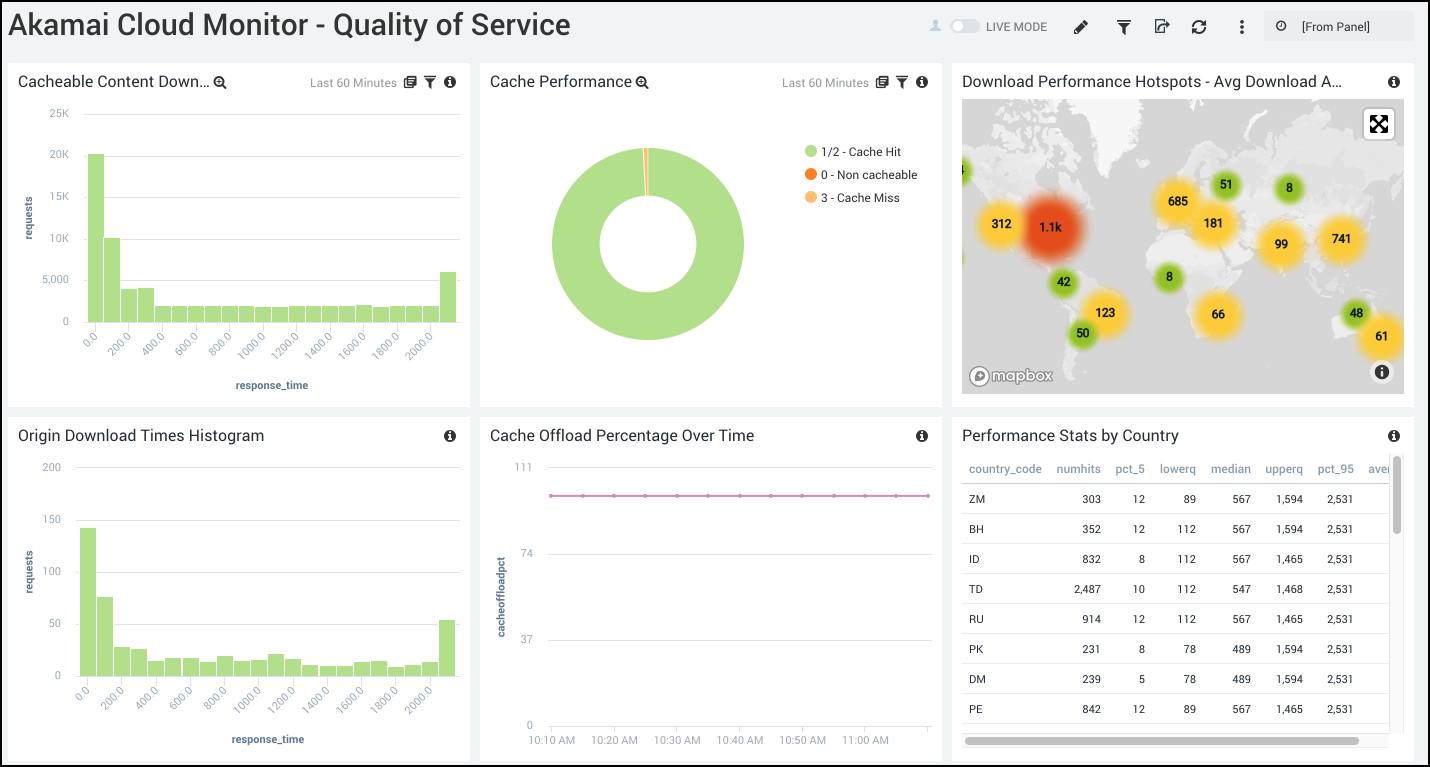
Cached Content Download Times. Shows download times for cached content for the number of requests and the response time in a column chart for the last hour.
Origin Download Times Histogram. Displays download times for origin content for the number of requests and the response time in a column chart for the last hour.
Cache Performance. Provides the cache performance by status as a pie chart for the last hour.
Cache Offload Percentage Overtime. Displays the cache offload percentage overtime in a line chart on a timeline for the last hour.
Download Performance Hotspots - Average Download Above 300 by Country. Uses a geo lookup operation to display performance download time hotspots on a map of the world by IP addresses, which allows you to see a count of hits per location for the last hour.
Performance Stats by Country. Provides an aggregation table of performance statistics by IP address per country code for the last hour.
Security
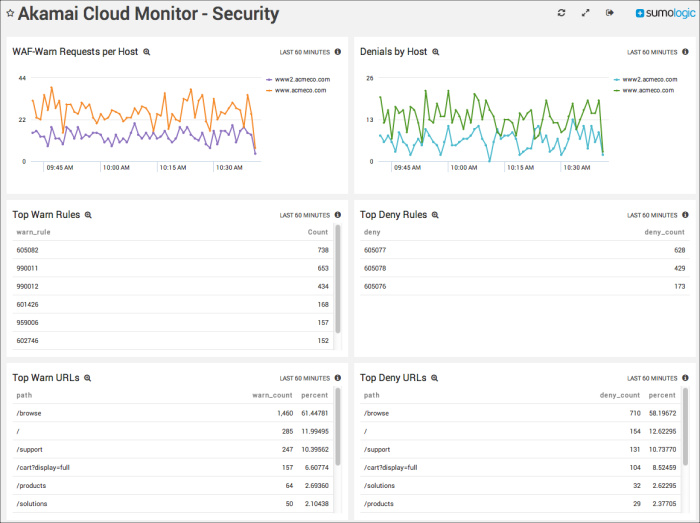
WAF-Warn Requests per Host. Displays a count of WAF warning requests per host in a stacked column chart on a timeline using timeslices of one minute for the last hour.
Top Warn Rules. Lists the top warning rules in an aggregation table by rule and count for the last hour.
Top Warn URLs. Lists the top 10 URLs with the most warnings in an aggregation table by path, count, and percentage for the last hour.
Denials by Host. Displays WAF denials by host in a line chart on a timeline using timeslices of one minute for the last hour.
Top Deny Rules. Lists the top denial rules in an aggregation table by rule and count for the last hour.
Top Deny URLs. Lists the top 10 URLs with the most denials in an aggregation table by path, count, and percentage for the last hour.
Visitors
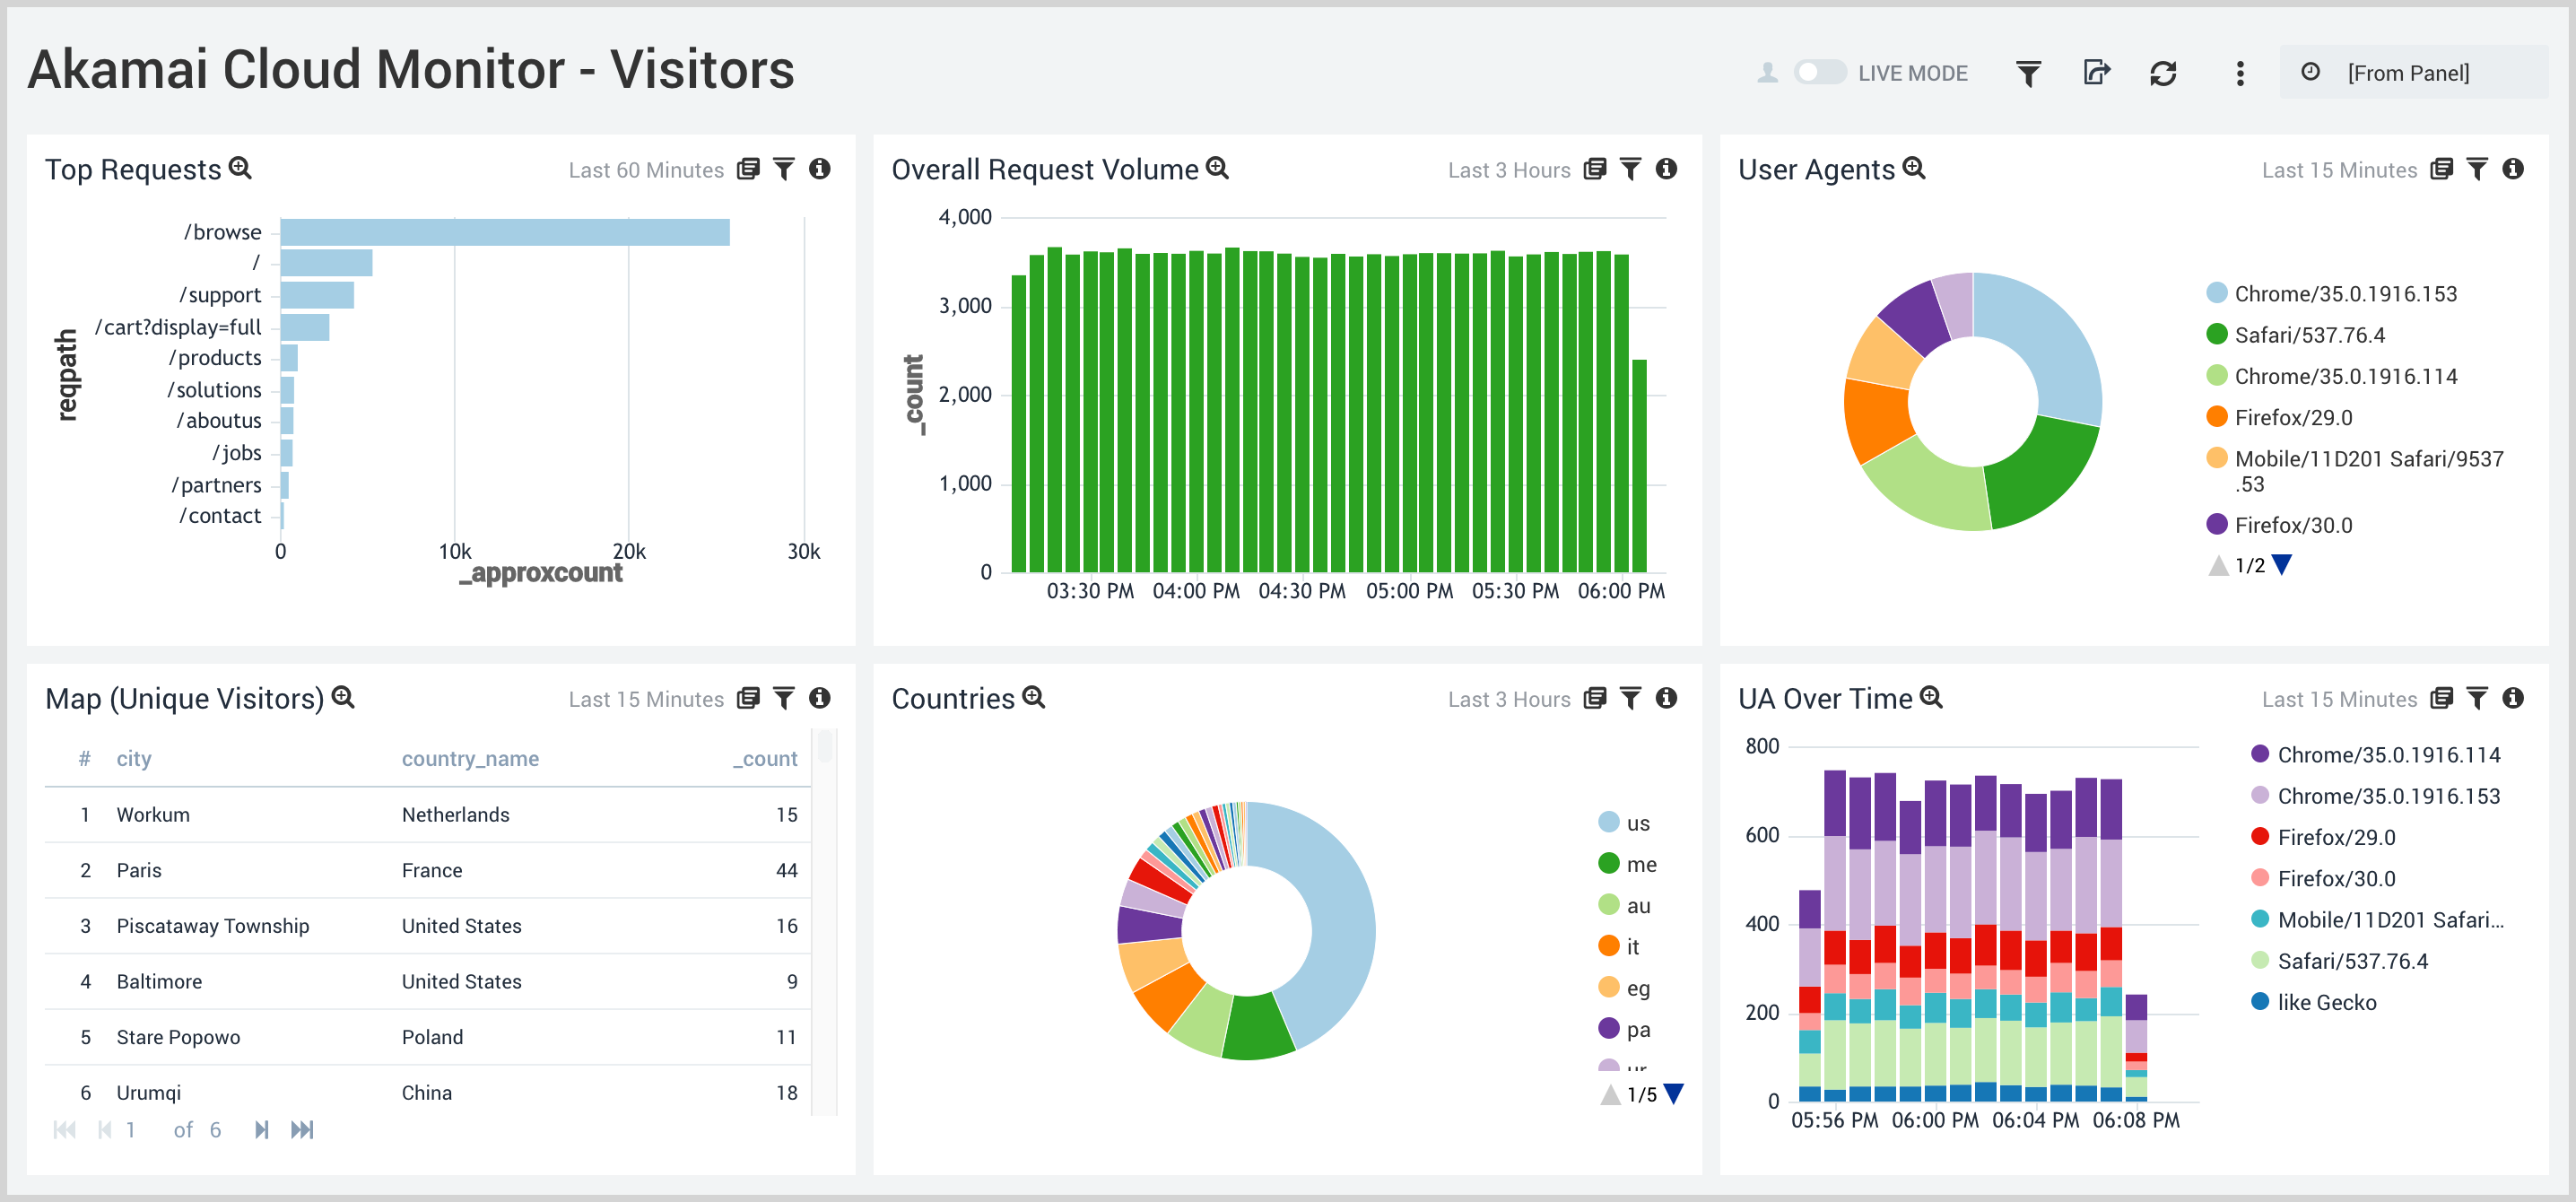
Top Requests. Displays the top requests by path and count in a bar chart for the last hour.
Map (Unique Visitors). Performs a geo lookup operation and displays the number of visitors to your site and their locations on a map of the world by IP address over the last 15 minutes.
Overall Request Volume. Shows the number of requests made in a column chart on a timeline using timeslices of five minutes over the last three hours.
Countries. Displays the originating country of visitors to your site by IP address over the last three hours in a pie chart. Hover over a section of the pie chart to display more details.
User Agents. Show the agents used by visitors to your site as a pie chart for the past 15 minutes.
UA Over Time. Displays user agents used by visitors as a stacked column chart over a timeline using timeslices of one minute for the last 15 minutes.
Web Application Firewall - Attacks
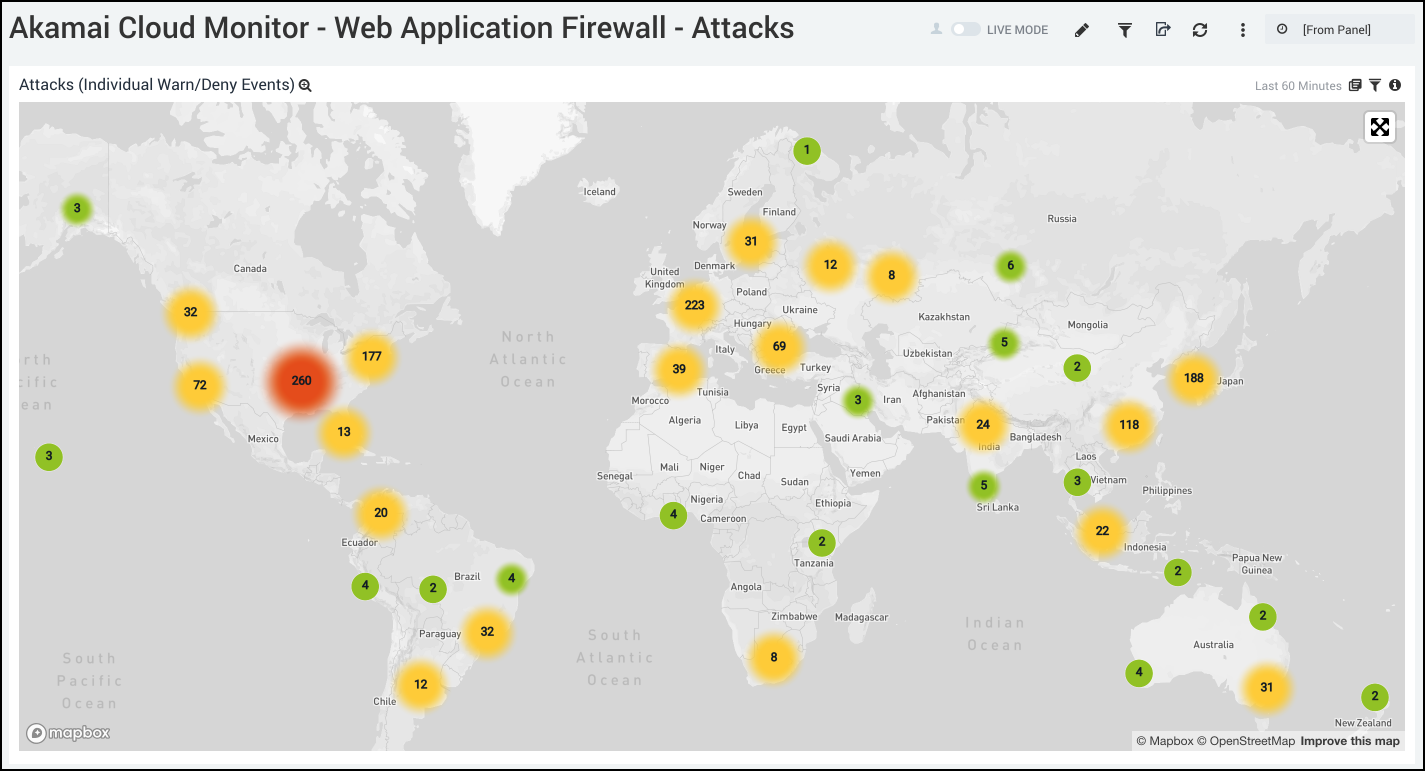
Attacks (Individual Warn/Deny Events). Uses a geo lookup operator to provide information on individual warn and deny events by IP address for the last hour and displays them on a map of the world.