Cisco Umbrella
The Sumo Logic App for Cisco Umbrella provides analytics and visibility into DNS, Proxy, and Admin activity. It gives insights into Geolocation of traffic sources, blocked clients, top categories, and more. It also analyzes traffic passing through Umbrella SWG and selective proxy, and provides information on client requests, malware, AV detections, and traffic summary. The Admin Activity dashboard provides snapshots of changes made in Umbrella's settings.
Log Types
Sumo Logic app for Cisco Umbrella uses the following log types:
Sample Log Messages
To know about the Sample Logs and Schema for Cisco Umbrella logs, click here.
Sample Query
_sourceCategory=Labs/cisco_umbrella
| where _sourcename matches "*dnslogs*"
| parse "\"*\",\"*\",\"*\",\"*\",\"*\",\"*\",\"*\",\"*\",\"*\",\"*\",\"*\",\"*\",\"*\"" as timestamp,identity,identites_all,internal_ip,external_ip,action,query_type,response_code,domain_name,categories,first_identity_type_matched,all_identity_types,blocked_categories
_sourceCategory=Labs/cisco_umbrella
| where _sourcename matches "*proxylogs*"
| parse "\"*\",\"*\",\"*\",\"*\",\"*\",\"*\",\"*\",\"*\",\"*\",\"*\",\"*\",\"*\",\"*\",\"*\",\"*\",\"*\",\"*\",\"*\",\"*\",\"*\",\"*\",\"*\",\"*\",\"*\",\"*\",\"*\",\"*\",\"*\",\"*\",\"*\",\"*\",\"*\",\"*\",\"*\",\"*\"" as timestamp,policy_identity_label,internal_client_ip,external_client_ip,destination_ip,content_type,action,url,referer,user_agent,status_code,request_size,response_size,response_body_size,sha256,categories,av_detections,PUAs,AMP_disposition,AMP_malware_name,AMP_score,policy_identity_type,blocked_categories,identities,identity_types,request_method,DLP_status,certificate_errors,file_name,ruleset_ID,rule_ID,destination_list_IDs,isolate_action,file_action,warn_status
_sourceCategory=Labs/cisco_umbrella
| where _sourcename matches "*auditlogs*"
| parse "\"*\",\"*\",\"*\",\"*\",\"*\",\"*\",\"*\",\"*\",\"*\"" as  id, timestamp, email, user, type, action, ip, before, after
Collecting logs for Cisco Umbrella
This section provides instructions for setting up collection for Cisco Umbrella for analysis in Sumo Logic.
The Cisco Umbrella app offers logging to Amazon S3 as it has the ability to upload, store, and archive traffic activity logs from your Umbrella dashboards to the cloud through Amazon S3. CSV formatted Umbrella logs are compressed (gzip) and uploaded every ten minutes so that there's a minimum of delay between traffic from the customer's Umbrella dashboard being logged and then being available to download from an S3 bucket.
Login to your Amazon S3 admin account. You need to have a admin account to collect logs from Amazon S3 account.
Navigate to the Log Management.
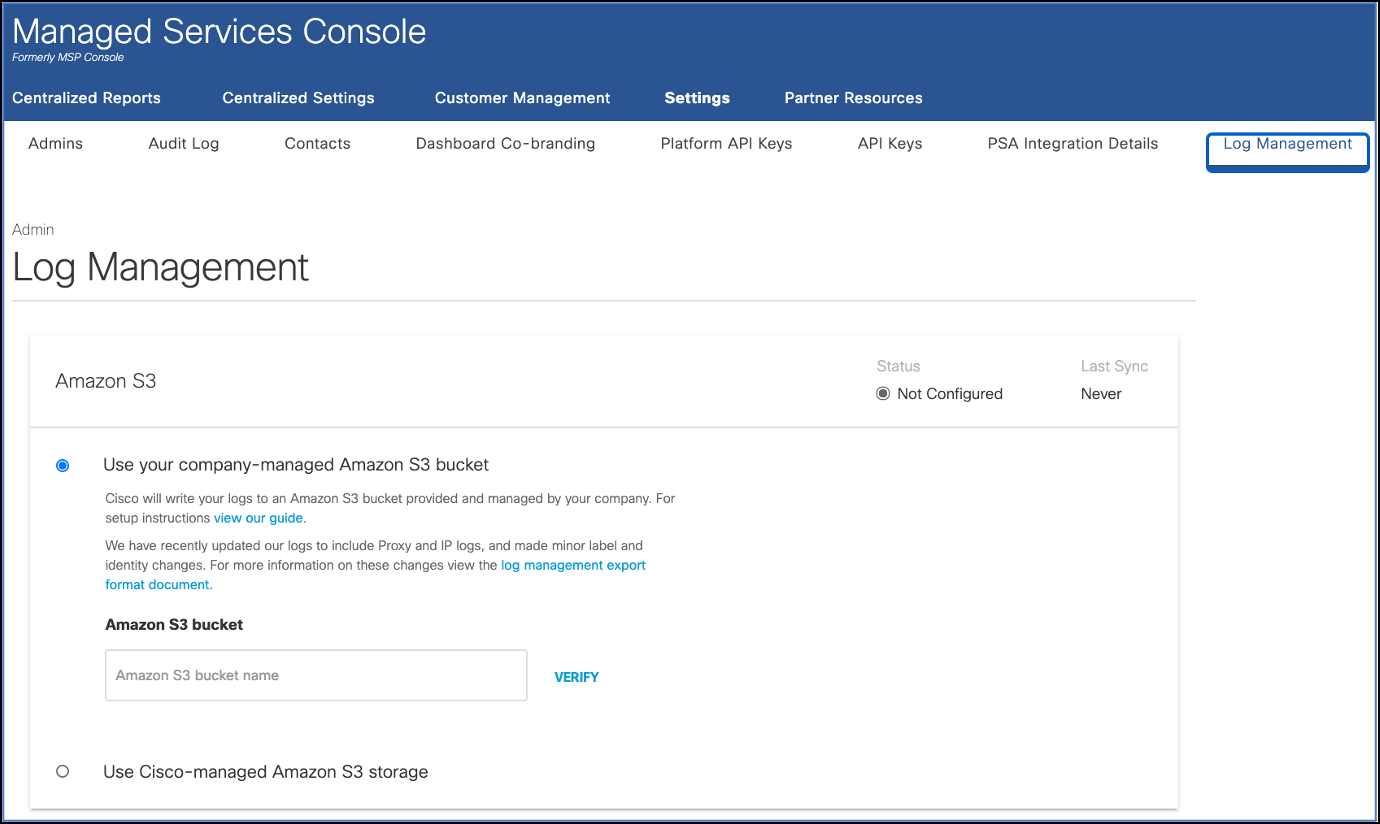
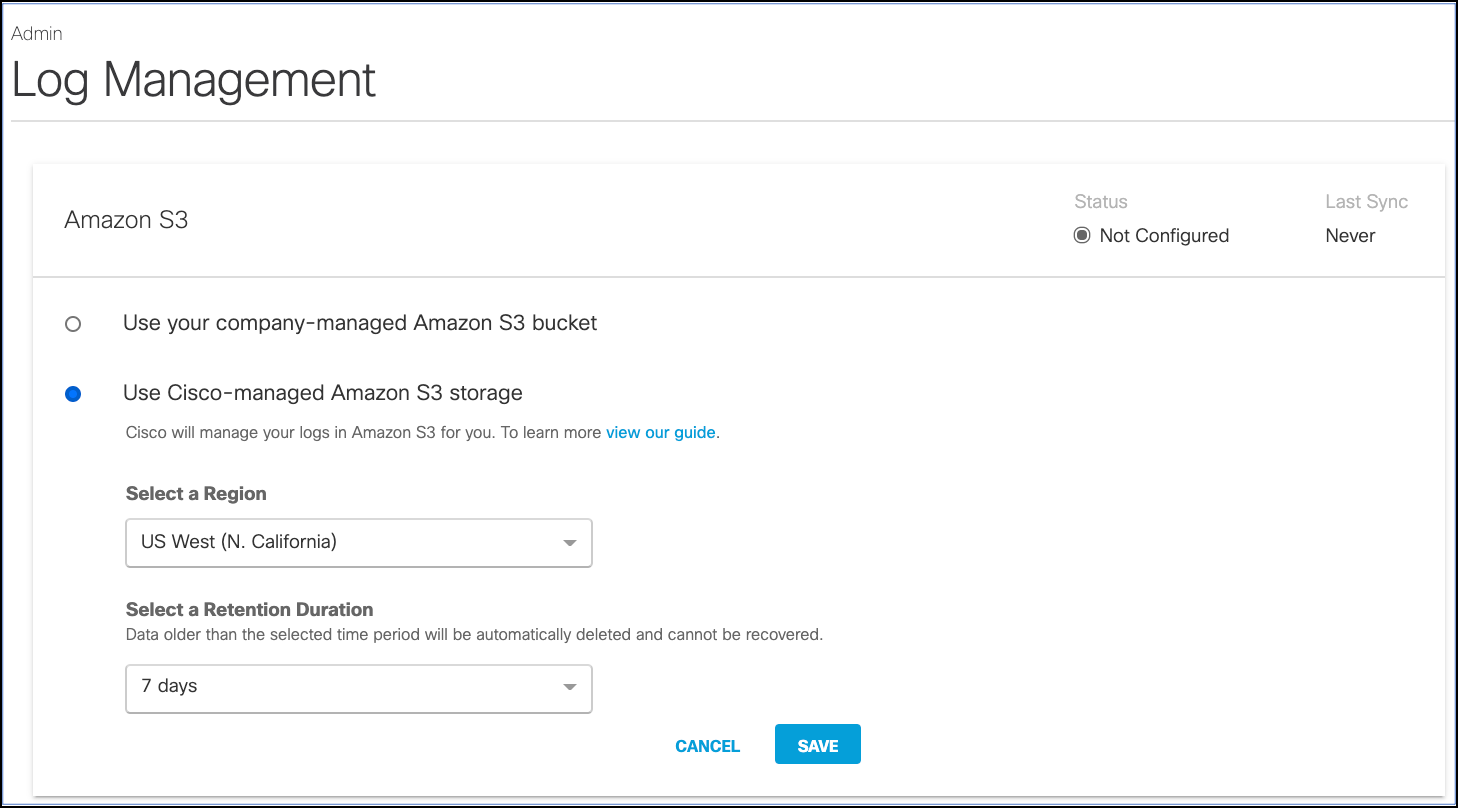
You have the following two options on Cisco Umbrella Amazon S3:
- A self-managed bucket. You own the Amazon S3 bucket, including its configuration and management.
- A Cisco-managed bucket. Cisco Umbrella owns the bucket and sets the configuration and management of it. For more information, see Enable Logging to a Cisco-managed S3 Bucket.
If you're collecting from a Cisco Umbrella bucket, SNS Subscription Endpoint is not supported. For more information, see important note on using Sumo Logic's AWS S3 source for the Cisco Managed s3 bucket
By having all your logs uploaded to an S3 bucket, you can then download logs automatically to keep in perpetuity in backup storage. Or, ingest the logs through your SIEM or another security tool to determine if any security events in these Umbrella logs coincide with events in other security tools.
For more information, see Cisco Umbrella Documentation.
Installing Cisco Umbrella Apps
This section has instructions for installing the Cisco Umbrella App for Sumo and descriptions of each of the dashboards.
- Locate and install the app you need from the App Catalog. If you want to see a preview of the dashboards included with the app before installing, click Preview Dashboards.
- From the App Catalog, search for and select the app.
- Select the version of the service you're using and click Add to Library. Version selection is applicable only to a few apps currently.For more information, see the Install the Apps from the Library.
- To install the app, complete the following fields.
- App Name. You can retain the existing name, or enter a name of your choice for the app.
- Data Source. Select either of these options for the data source.
- Choose Source Category, and select a source category from the list.
- Choose Enter a Custom Data Filter, and enter a custom source category beginning with an underscore. Example:
_sourceCategory=MyCategory.
- Advanced. Select the Location in Library (the default is the Personal folder in the library), or click New Folder to add a new folder.
- Click Add to Library.
Once an app is installed, it will appear in your Personal folder, or other folder that you specified. From here, you can share it with your organization.
Panels will start to fill automatically. It's important to note that each panel slowly fills with data matching the time range query and received since the panel was created. Results won't immediately be available, but with a bit of time, you'll see full graphs and maps.
Viewing the Cisco Umbrella Dashboards
- All dashboards have a set of filters that you can apply to the entire dashboard, as shown in the following example. Click the funnel icon in the top dashboard menu bar to display a scrollable list of filters that are applied across the entire dashboard.
You can use filters to drill down and examine the data on a granular level. Filters include client country, client device type, client IP, client request host, client request URI, client request user agent, edge response status, origin IP, and origin response status.
- Each panel has a set of filters that are applied to the results for that panel only, as shown in the following example. Click the funnel icon in the top panel menu bar to display a list of panel-specific filters.
Admin Activities
Cisco Umbrella - Admin Activities. This dashboard displays snapshots of changes made to Umbrella's settings by the admin. By using the dashboard's filters, you can easily sort through the data based on key fields such as action.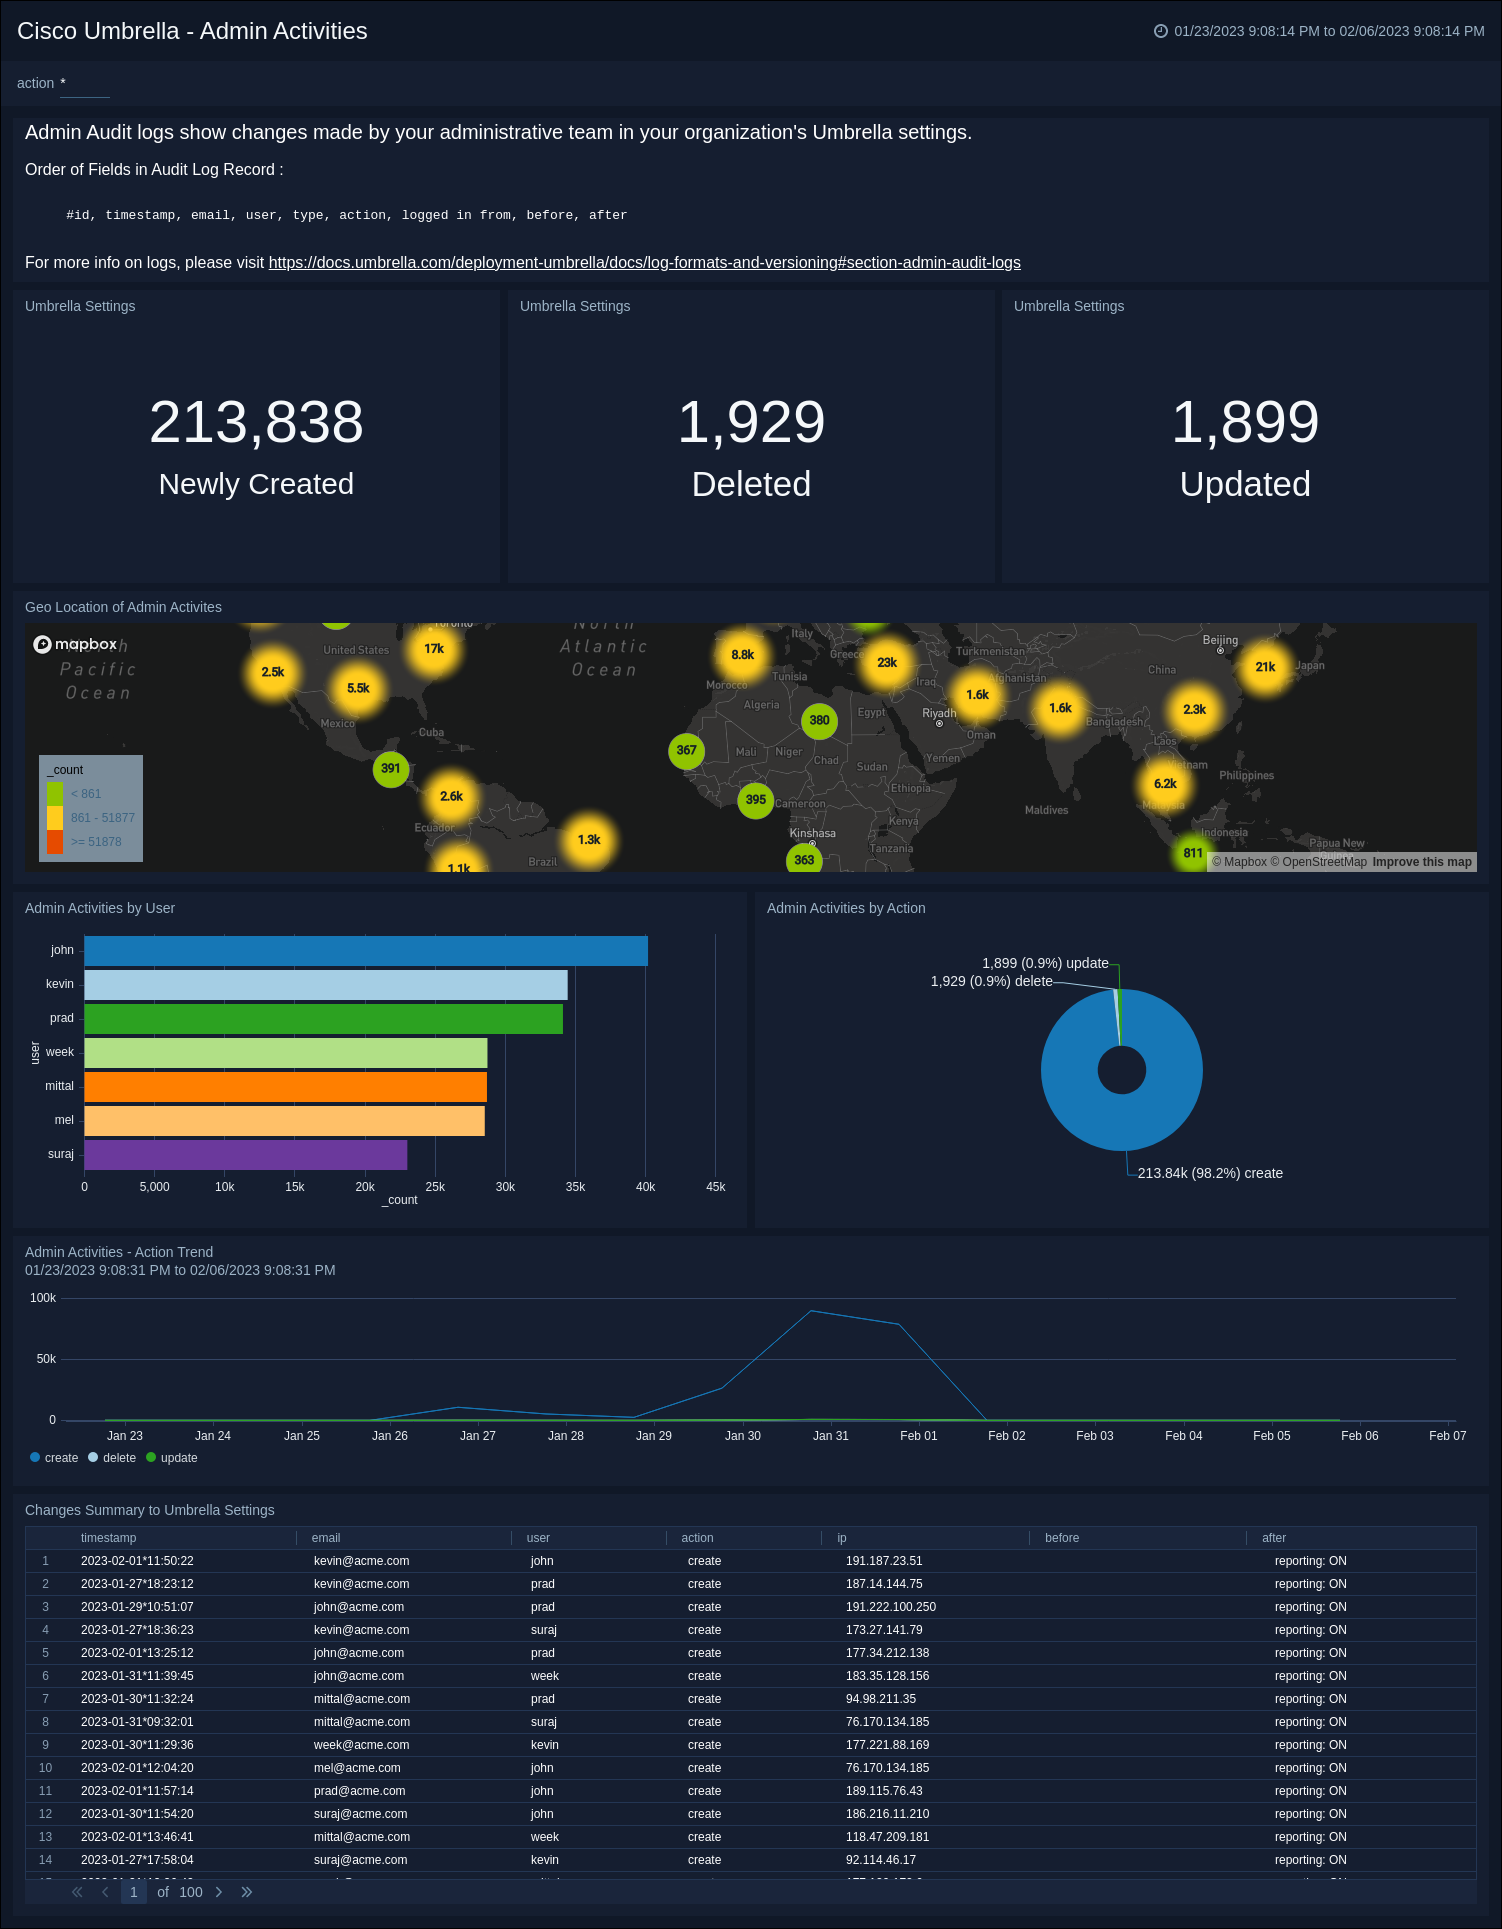
DNS
Cisco Umbrella - DNS. This dashboard offers insights into traffic that has been processed by Cisco DNS resolvers. It provides a view of the geographical location of the traffic sources, clients that were blocked, the most popular categories and categories blocked by DNS. Additionally, it analyzes the domains requested, the related blocked requests and traffic, and the identities associated with them. The dashboard filters can be utilized to analyze the data based on crucial fields such as action, identity, response code, blocked category, and category.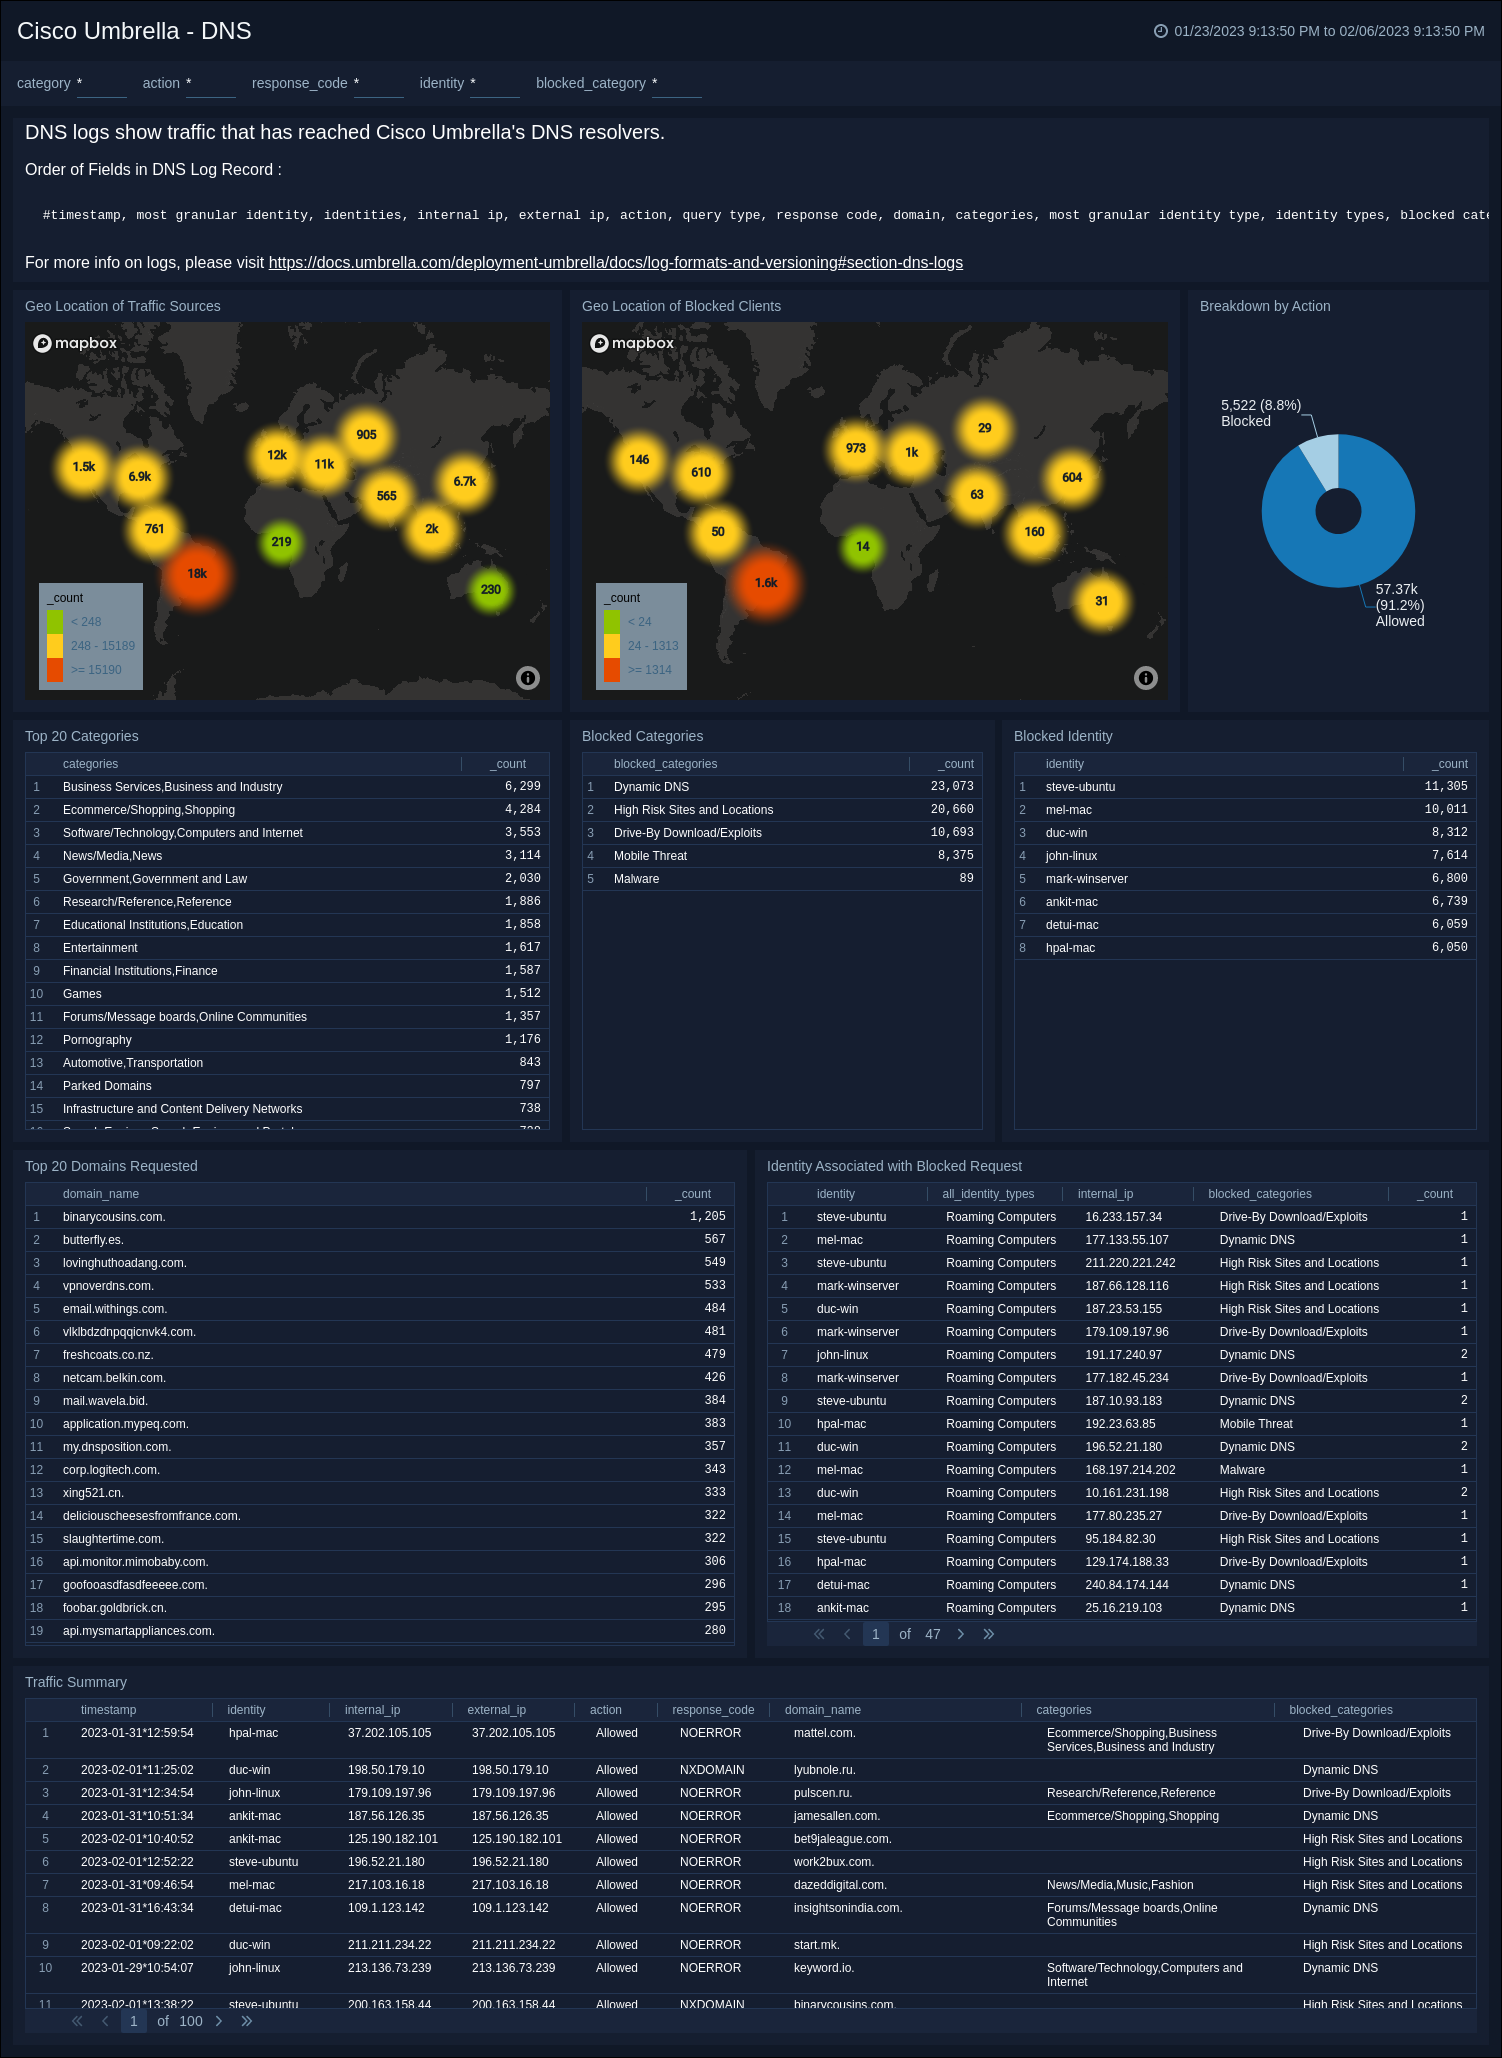
Proxy
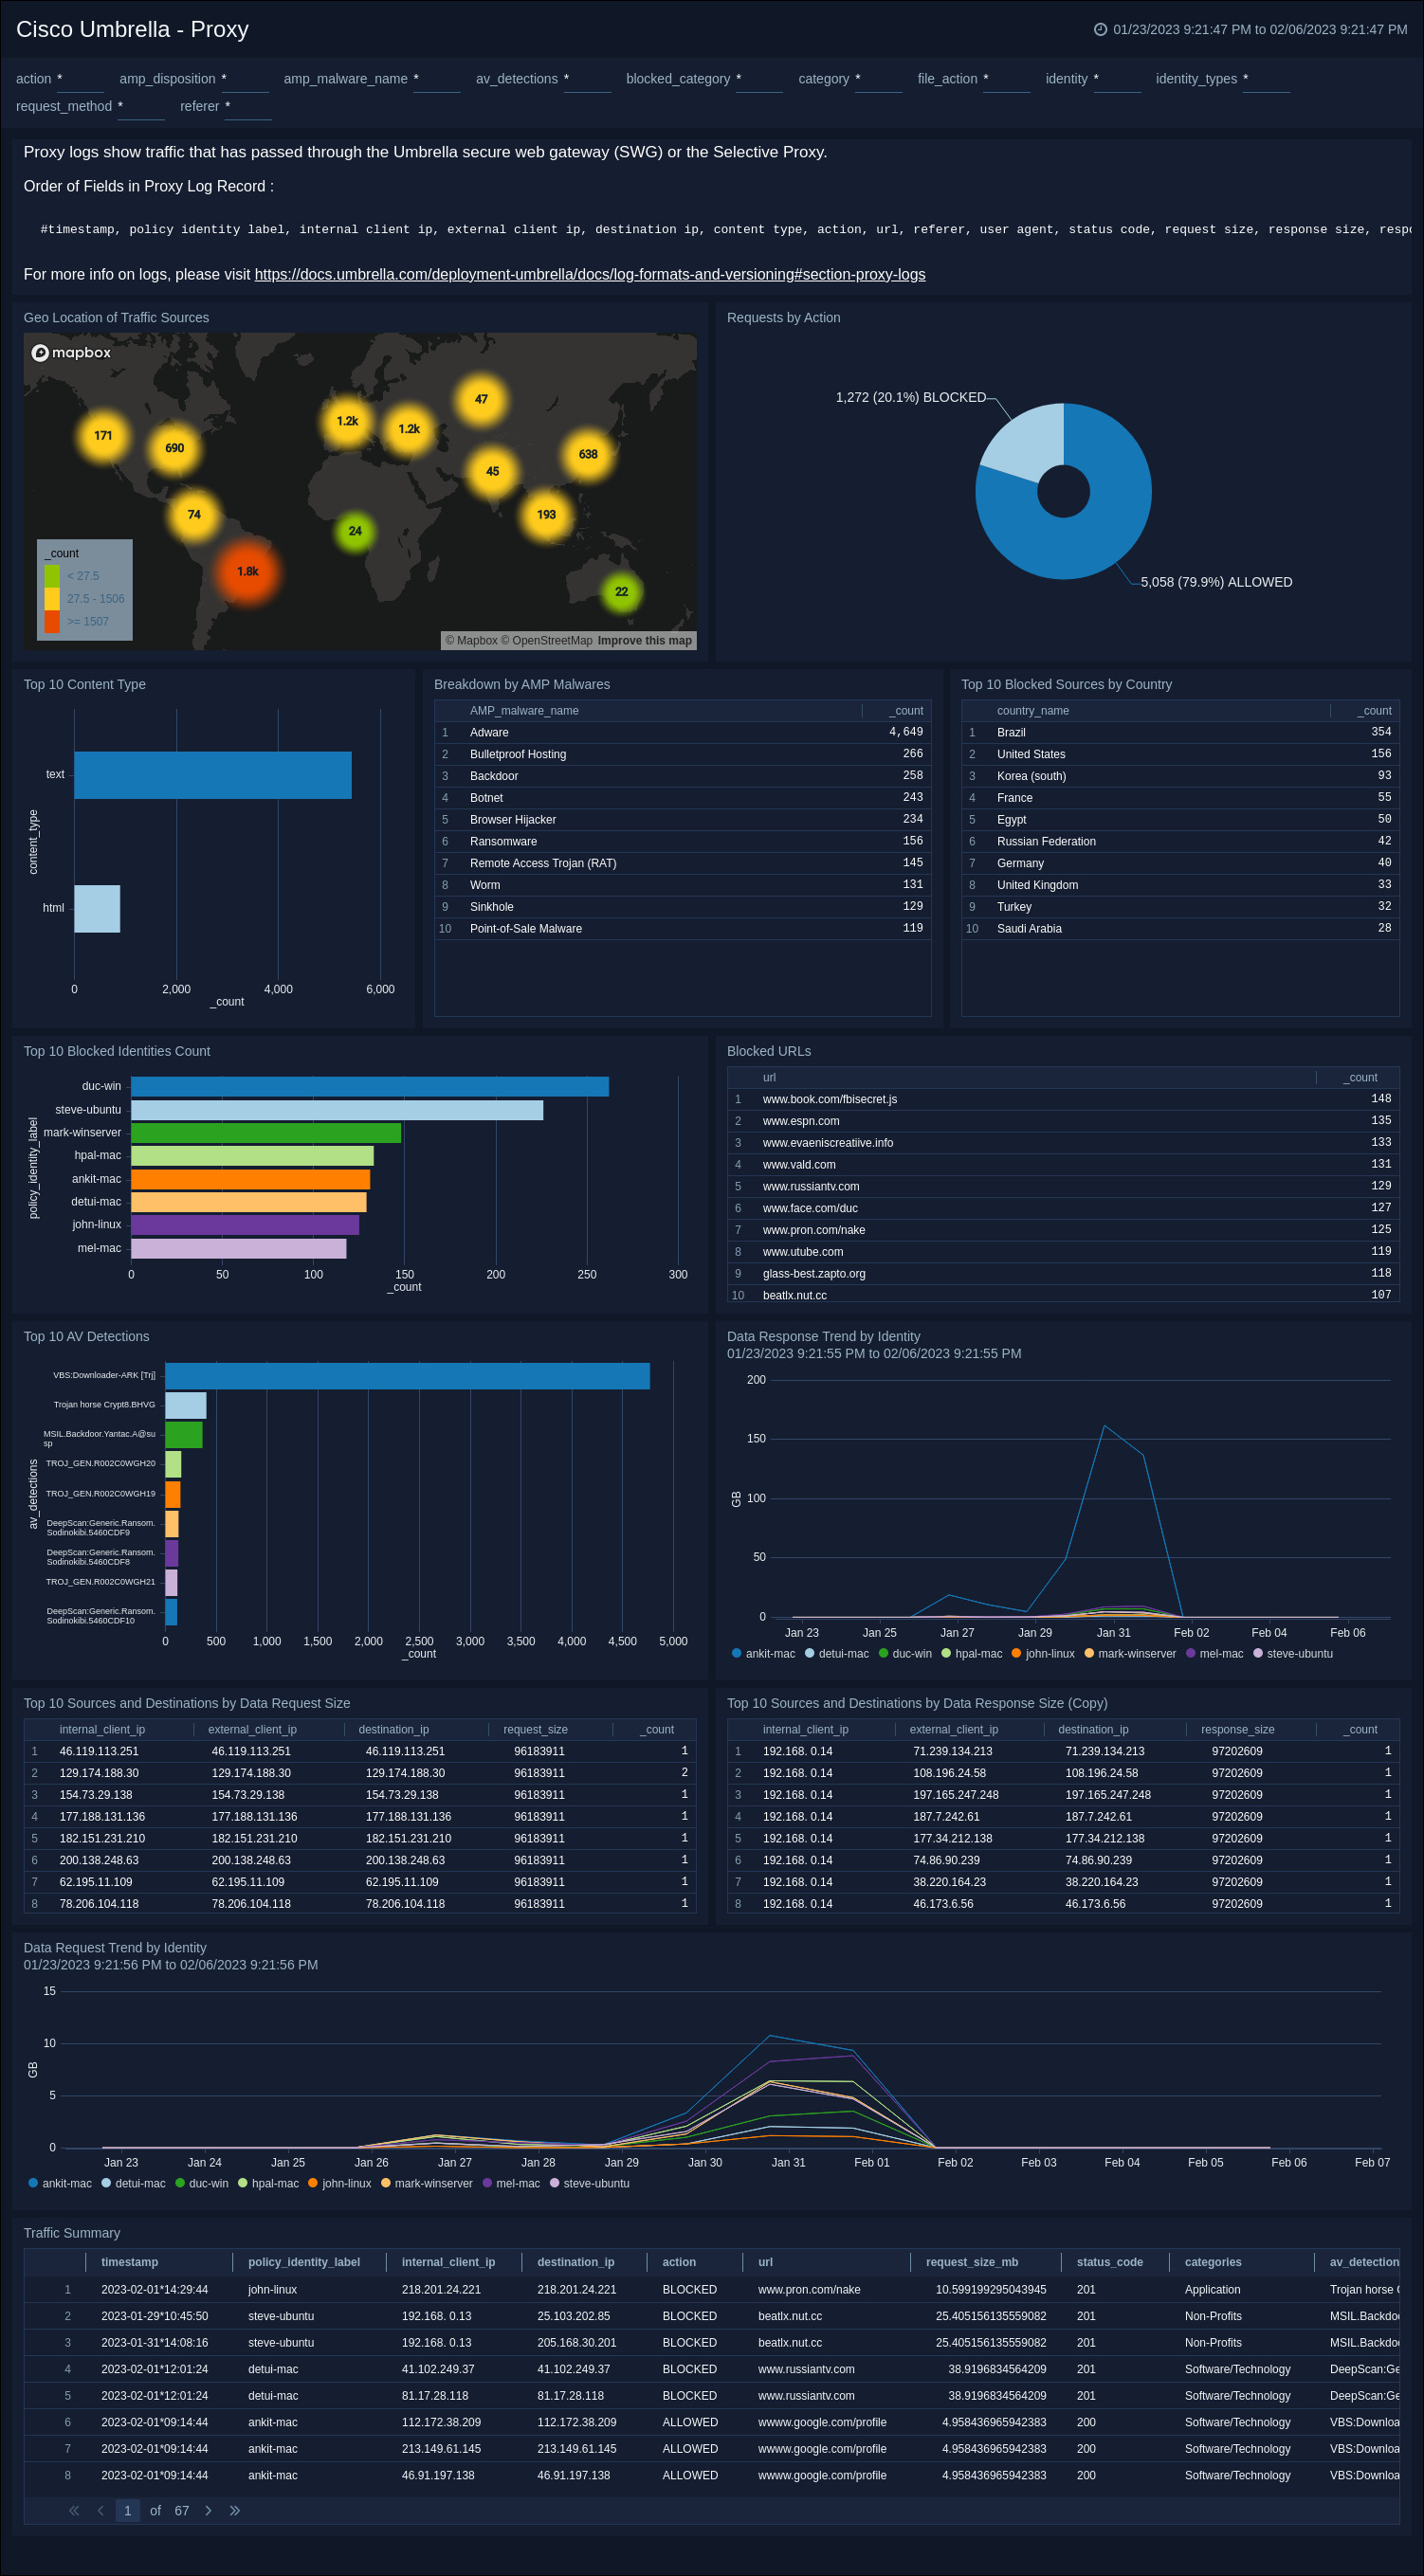
Cisco Umbrella - Proxy. This dashboard provides insights into the traffic that has gone through Umbrella's Secure Web Gateway (SWG) or Selective Proxy. It gives you a clear view of the geographical location of the traffic sources, client requests by blocked or allowed actions, malware detections, blocked sources and URLs, anti-virus detections, traffic request/response size, and an overall traffic summary.
By using the dashboard's filters, you can easily analyze the data by different key fields such as action, identity, malware, anti-virus detection, blocked category, referrer, and category.