Sumo Logic App for Airtable
The Airtable App for Sumo Logic monitors and analyzes your organization's Airtable audit logs, providing insights into user activity, data trends, and security events. This app is based on the Airtable Audit Logs, which provide detailed information on all actions performed in your Airtable account. The Airtable App makes it simple to import data from your Airtable audit logs into Sumo Logic, where you can perform real-time analysis and build dashboards to visualize key metrics. You can monitor security events and gain insights into user activity across your organization.
The Airtable App allows you to:
- Keep track of user activity within your Airtable account in real-time.
- Analyze user actions, identify failed executions, and track trends over time.
- View a summary of audit logs in table format, enabling you to identify anomalous behavior and potential security threats.
- Create customized dashboards to visualize important metrics and track key performance indicators.
The Airtable App also offers a pre-built dashboard that enables you to start monitoring your Airtable audit logs right away. The Airtable App for Sumo Logic is especially useful for organizations that must comply with regulatory requirements or maintain a high level of security. With the ability to monitor user activity and track changes in real time, you can quickly identify potential issues and respond to security incidents as they occur.
Log Types
The Sumo Logic App for Airtable consumes Audit logs from your Airtable Enterprise account. Audit Logs track user activity and record changes made to the data in the system.
To understand how to access detailed records of changes made to the Airtable Enterprise account, refer to the Airtable Audit logs documentation. This documentation provides information on the different types of logs that are available, how to access them, and what information they contain.
Sample Log Messages
{
  "enterpriseaccountid": "entdfgc0BXGp",
  "originatinguserid": "usrcdagdfQ1B",
  "apiname": "PUBLIC_API",
  "apiversion": "0.1",
  "actionid": "acfdgdfCht9zR",
  "client": {
    "ipaddress": "100.108.203.58"
  },
  "context": {
    "workspaceid": null,
    "applicationid": null,
    "tableid": null
  },
  "request": {
    "requestid": "reqesfgstSbadd",
    "starttime": "2023-01-18T10:26:45.281Z",
    "modelclassname": "enterpriseAccount",
    "modelid": "entmDsrgfc0BXGp",
    "action": "getEnterpriseAuditLog",
    "parametersjson": "{\"enterpriseAuditLogTaskId\":\"ealtossregfCp47\"}"
  },
  "response": {
    "success": true,
    "message": null
  }
}
Sample Queries
_sourceCategory="Labs/airtable"
| Json "enterprise_account_id", "originating_user_id", "api_name", "api_version", "action_id", "client.ipaddress", "request.requestid", "request.starttime", "request.modelclassname", "request.modelid", "request.action", "response.success" as enterprise_account_id, originating_user_id, api_name, api_version, action_id, ipaddress, requestid, starttime, modelclassname, modelid, action, success nodrop
| where api_name matches "{{api}}" or isNull(api_name)
| where modelclassname matches "{{model}}" or isNull(modelclassname)
| where action matches "{{action}}" or isNull(action)
| count_distinct (action_id)
Installing the Airtable App
Locate and install the app from the App Catalog. To see a preview of the dashboards included with the app before installing, click Preview Dashboards. Before you begin, collect logs from Airtable API and ingest them into Sumo Logic. Refer to the Airtable API Cloud-to-Cloud Integration to create the source and use the same source category while installing the app.
To install the app, follow the steps below:
- From the App Catalog, search for the app and select it.
- Select Add Integration button to install the app.
- Configure Airtable App using the steps described in the Airtable Cloud-to-Cloud Source. If you already have set up your data, skip this step by clicking on Next.
- Complete the following fields:
- Data Source. Select either of these options for the data source:
- Choose Source Category and then choose a source category from the list.
- Select Enter a Custom Data Filter and type in a custom source category that starts with an underscore. For example,
_sourceCategory=MyCategory.
- Folder Name. You can retain the existing name, or enter a name of your choice for the app.
- Select the Location in Library (the default is the Personal folder in the library), or click New Folder to add a new folder.
- Data Source. Select either of these options for the data source:
- Click Next.
Once an app is installed, it will appear in your Personal folder, or other folder that you specified. You can share it with your organization.
The panels will begin to fill automatically. It's worth noting that each panel gradually fills with data that matches the time range query and has been received since the panel was created. The results will not be available right away, but with some patience, you will be able to view full graphs and maps.
Viewing Airtable Dashboards
All dashboards have a set of filters that you can apply to the entire dashboard, as shown in the following example. Click the funnel icon in the top dashboard menu bar to display a scrollable list of filters that are applied across the entire dashboard.
You can use filters to drill down and examine the data on a granular level. Filters include client country, client device type, client IP, client request host, client request URI, client request user agent, edge response status, origin IP, and origin response status.
Each panel has a set of filters that are applied to the results for that panel only, as shown in the following example. Click the funnel icon in the top panel menu bar to display a list of panel-specific filters.
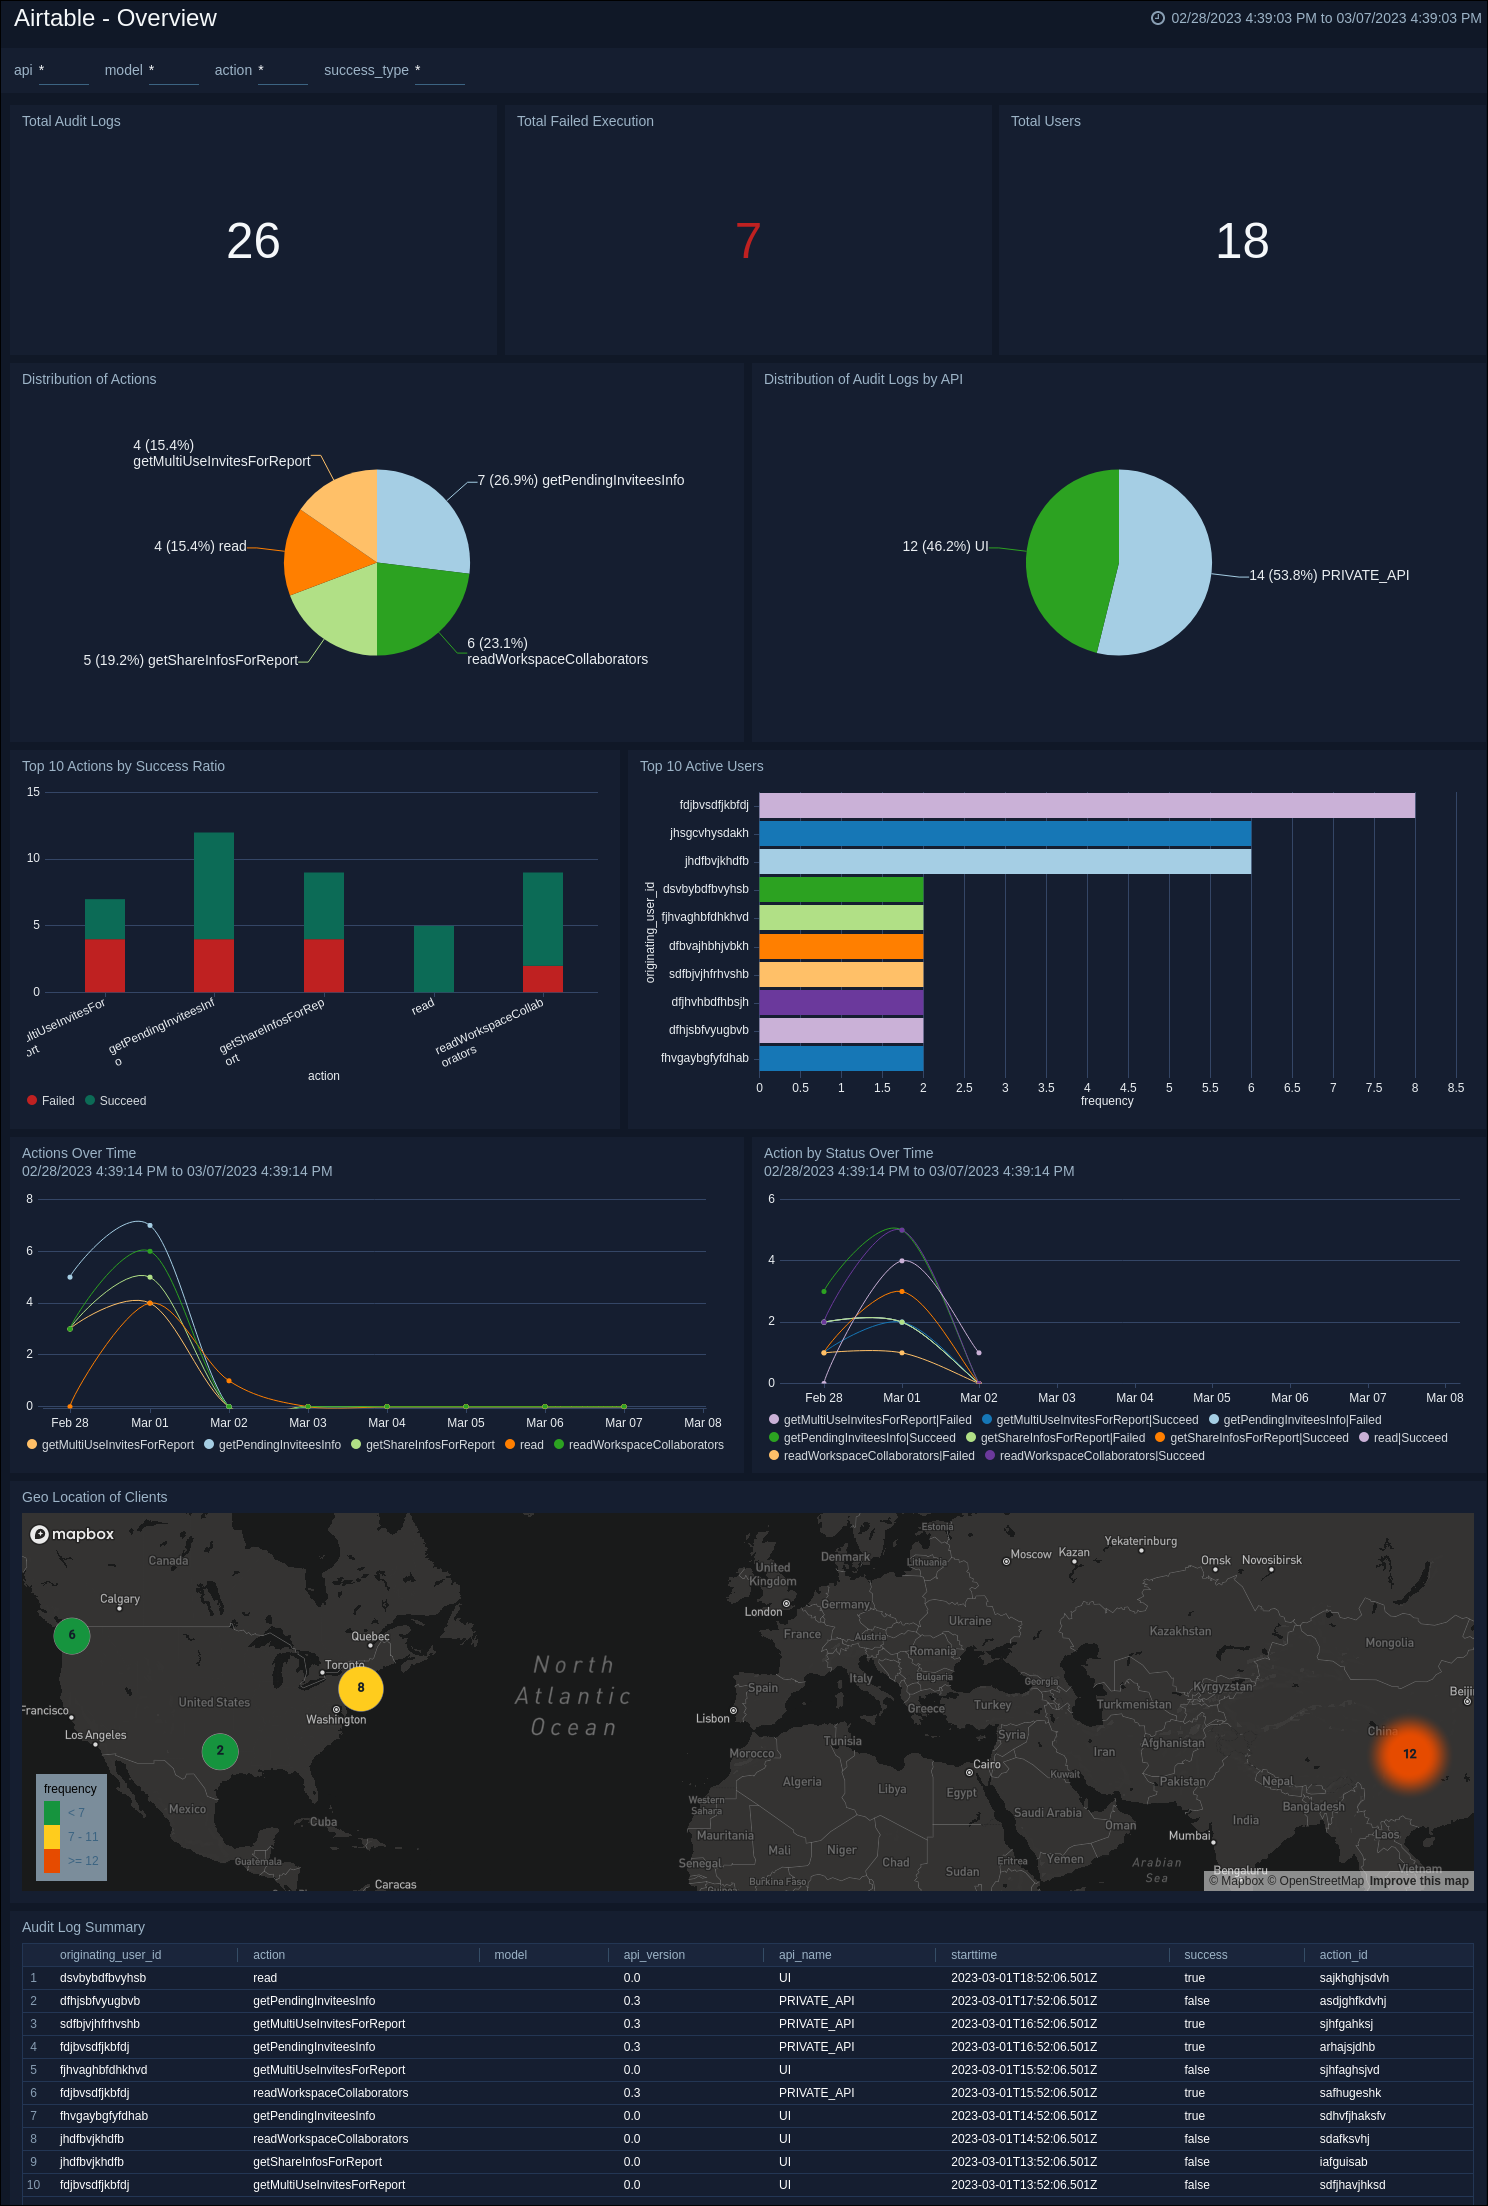
Overview Dashboard
Airtable - Overview dashboard provides a high-level view of key metrics related to Airtable platform user activity, audits, and execution. It contains widgets that display data such as total audit logs and failed executions, action distribution, and top-performing actions and users. The dashboard also provides information on activity trends over time and user locations. The Audit Log Summary widget provides a quick overview of all platform activity. Overall, the dashboard helps users quickly understand how the platform is used and identify areas for improvement.