Box

The Sumo Logic App for Box provides insight into user behavior patterns, monitors resources, and even tracks administrative activities. The app consists of three predefined Dashboards, providing visibility into your environment for real time analysis.
Log Types
The Sumo Logic App for Box collects Box events, which are described in detail here.
Sample Log Messages
{
   "source": {
      "type": "user",
      "id": "225980941",
      "name": "First Last",
      "login": "user@sumologic.com"
   },
   "created_by": {
      "type": "user",
      "id": "225980941",
      "name": "First Last",
      "login": "user@sumologic.com"
   },
   "created_at": "2016-12-15T11:08:58-08:00",
   "event_id": "7988d00a-aca3-4454-9021-652477f4fa78",
   "event_type": "LOGIN",
   "ip_address": "1.1.1.1",
   "type": "event",
   "session_id": null,
   "additional_details": null
}
{
   "source": {
      "type": "user",
      "id": "262207389",
      "name": "user",
      "login": "luser@sumologic.com"
   },
   "created_by": {
      "type": "user",
      "id": "225980941",
      "name": "first last",
      "login": "user1@sumologic.com"
   },
   "created_at": "2016-12-14T16:09:33-08:00",
   "event_id": "d82f1946-2c51-43fe-bfcc-3452f9e2f6ff",
   "event_type": "DELETE_USER",
   "ip_address": "1.1.1.1",
   "type": "event",
   "session_id": null,
   "additional_details": null
}
Sample Query
_sourceCategory=box  type "event_type" login
| json "created_at","ip_address","event_type","created_by.name","created_by.login" as messagetime,src_ip,event_type, src_user,src_login nodrop
| json "source.name","source.login","source.type"  as dest_user,dest_login, item_type nodrop
| where event_type="FAILED_LOGIN"
| count as EventCount by src_user,src_login,src_ip | top 10 src_user,src_login,src_ip by EventCount
Collecting Events for Box
This section provides instructions for setting up event collection from Box for analysis in Sumo Logic. Before you begin setting up log collection, review the required prerequisites and process overview described in the following sections.
The Box API integration ingests events from the Get Events API. It securely stores the required authentication, scheduling, and state tracking information.
Authentication
You'll need a Box App Key, App Secret, and Access Code to provide to Sumo Logic.
Complete the following steps to get the credentials:
- Login into the Box Account.
- Create and register a new app from the App Console. To register the App with Box follow these steps. Select Server Authentication (with JWT) as the authentication method. Note that use of a key pair requires 2-step verification to be enabled on Box.
- Generate
public private key pairas described in the following steps Key Pair and download the JSON file. - Go to the
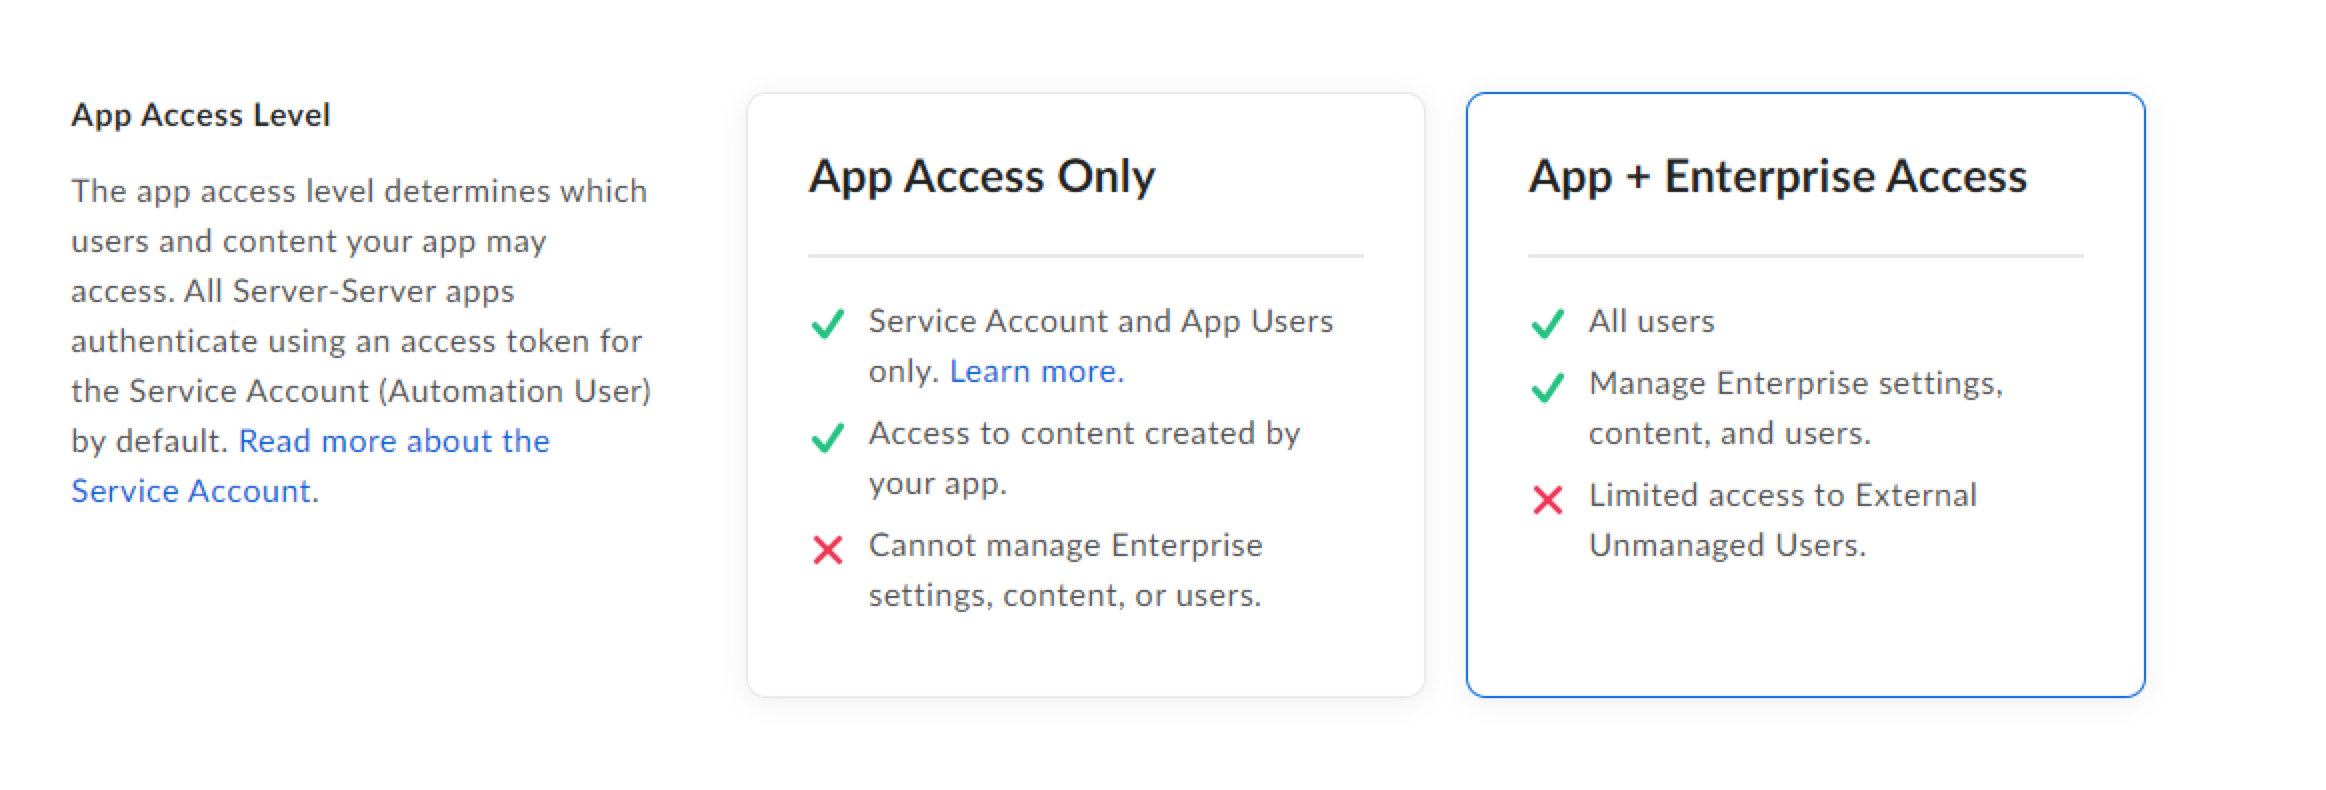
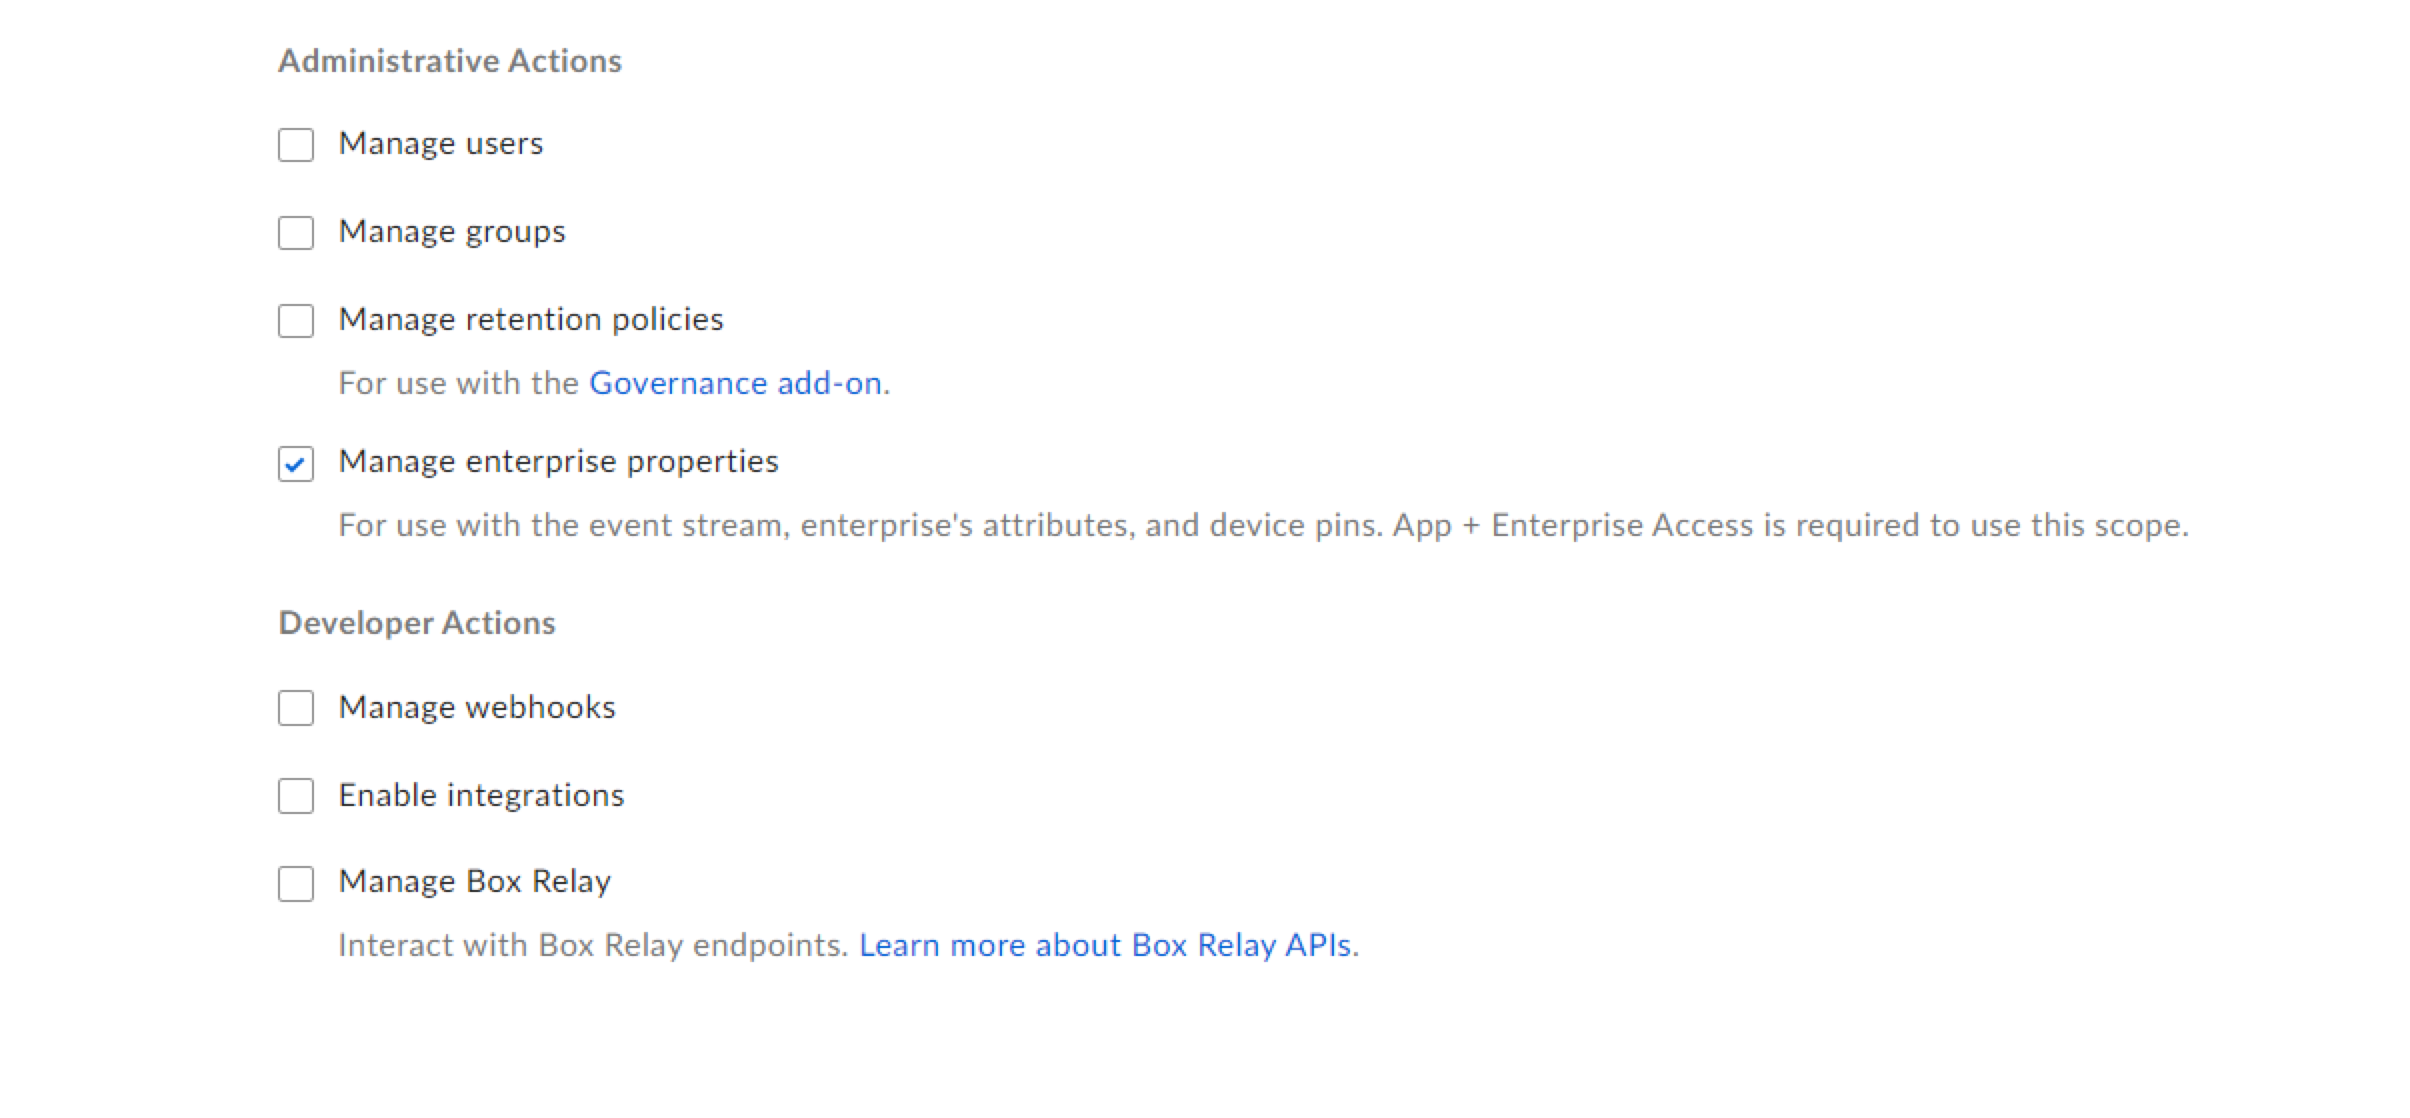
Configurationand changeApp Access LeveltoApp + Enterprise Accessand enableManage Enterprise propertiesinApplication Scopesand save changes as shown below.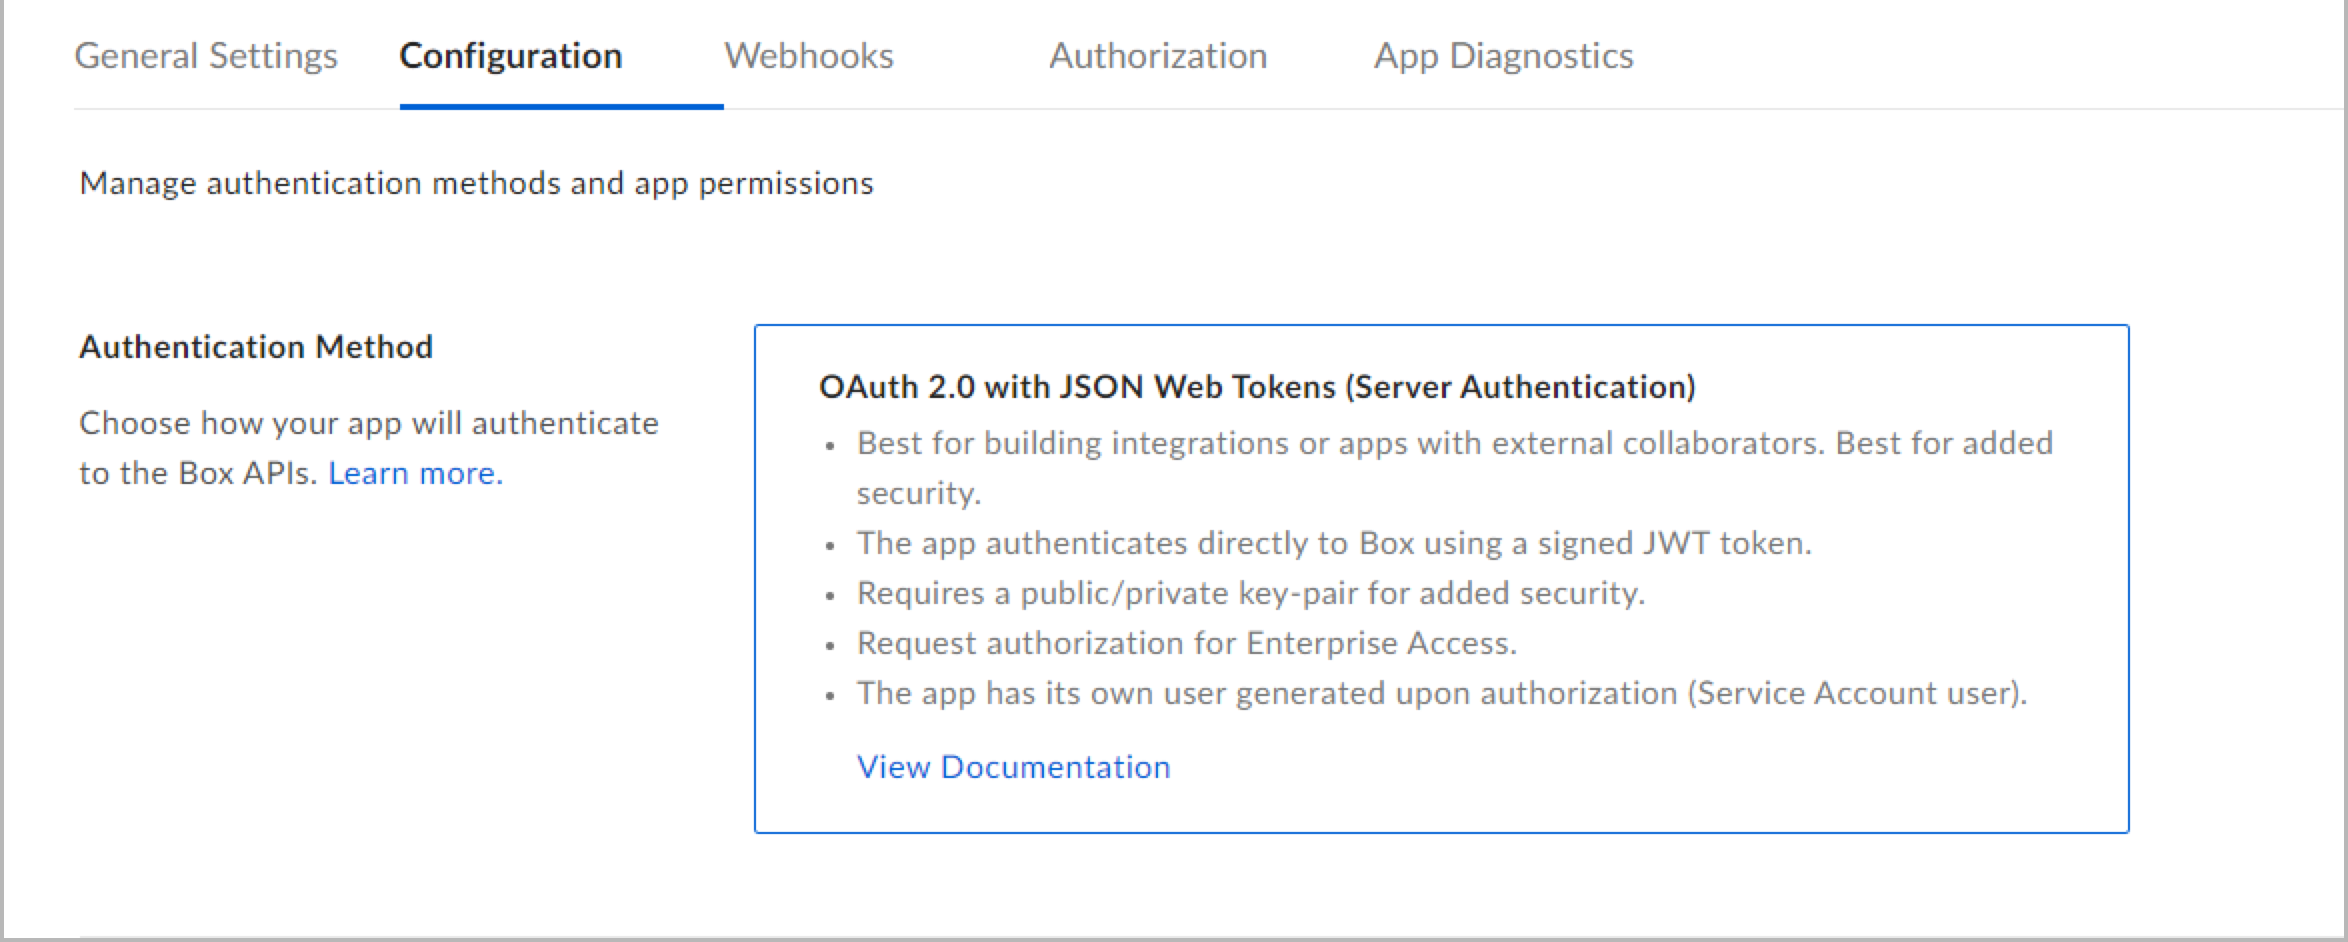
- Authorize your app by following these steps Authorize.
States
A Box Source tracks errors, reports its health, and start-up progress. You’re informed, in real-time, if the Source is having trouble connecting, if there's an error requiring user action, or if it is healthy and collecting by utilizing Health Events.
A Box Source goes through the following states when created:
- Pending. Once the Source is submitted, it is validated, stored, and placed in a Pending state.
- Started. A collection task is created on the Hosted Collector.
- Initialized. The task configuration is complete in Sumo Logic.
- Authenticated. The Source successfully authenticated with Box.
- Collecting. The Source is actively collecting data from Box.
If the Source has any issues during any one of these states, it is placed in an Error state.
When you delete the Source, it is placed in a Stopping state. When it has successfully stopped, it is deleted from your Hosted Collector.
On the Collection page, the Health and Status for Sources is displayed. Use Health Events to investigate issues with collection.
You can click the text in the Health column, such as Error, to open the issue in Health Events to investigate.
Hover your mouse over the status icon to view a tooltip with details on the detected issue.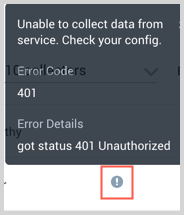
Create a Box Source
When you create a Box Source, you add it to a Hosted Collector. Before creating the Source, identify the Hosted Collector you want to use or create a new Hosted Collector. For instructions, see Create a Hosted Collector.
To configure a Box Source:
- In Sumo Logic, navigate to Manage Data > Collection and open the Collection tab.
- On the Collectors page, click Add Source next to a Hosted Collector.
- Select Box.

- Enter a Name for the Source. The description is optional.
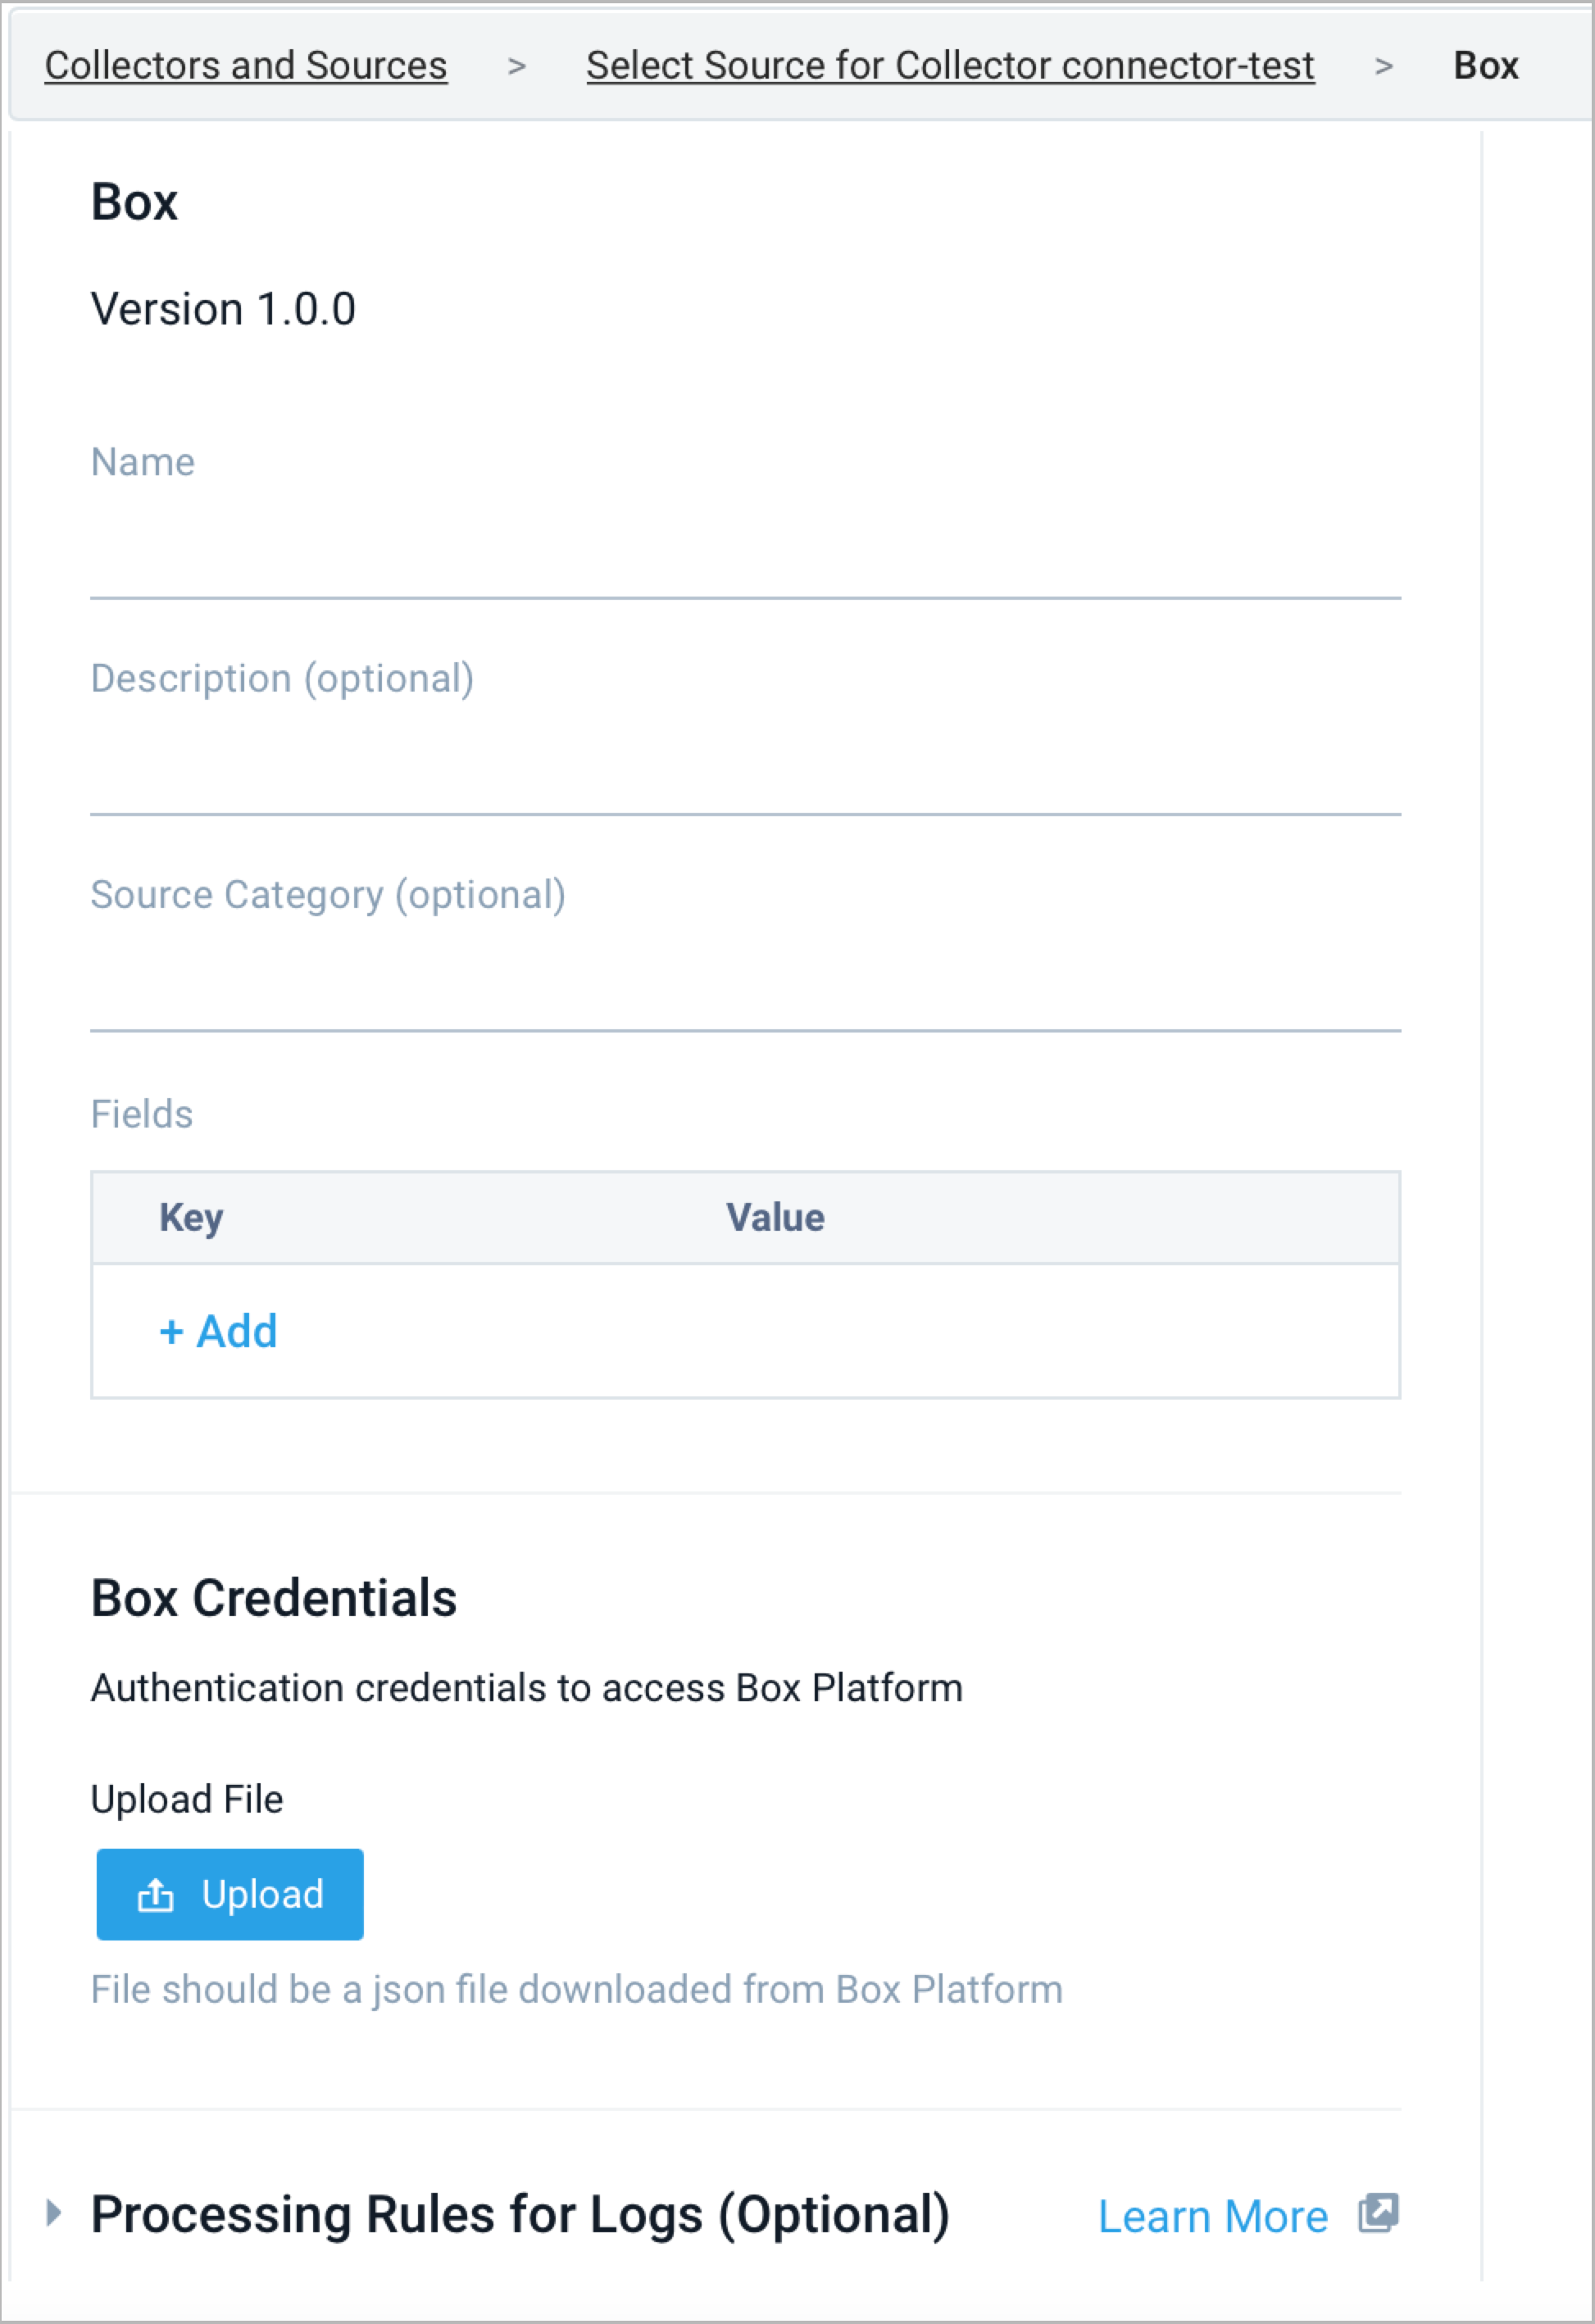
- (Optional) For Source Category, enter any string to tag the output collected from the Source. Category metadata is stored in a searchable field called
_sourceCategory. - Forward to SIEM. Check the checkbox to forward your data to Cloud SIEM Enterprise.
When configured with the Forward to SIEM option, the following metadata fields are set:
| Field Name | Value |
_siemVendor | Box |
_siemProduct | Enterprise Events |
_siemFormat | JSON |
_siemEventID | {event_type} |
- (Optional) Fields. Click the +Add link to add custom log metadata Fields.
- Define the fields you want to associate, each field needs a name (key) and value.
A green circle with a checkmark is shown when the field exists and is enabled in the Fields table schema.
An orange triangle with an exclamation point is shown when the field doesn't exist, or is disabled, in the Fields table schema. In this case, an option to automatically add or enable the nonexistent fields to the Fields table schema is provided. If a field is sent to Sumo that does not exist in the Fields schema or is disabled it is ignored, known as dropped.
- Define the fields you want to associate, each field needs a name (key) and value.
- Upload the JSON file.
- Processing Rules. Configure any desired filters, such as allowlist, denylist, hash, or mask, as described in Create a Processing Rule.
- When you are finished configuring the Source, click Submit.
Error types
When Sumo Logic detects an issue it is tracked by Health Events. The following table shows the three possible error types, the reason the error would occur, if the Source attempts to retry, and the name of the event log in the Health Event Index.
| Type | Reason | Retries | Retry Behavior | Health Event Name |
| ThirdPartyConfig | Normally due to an invalid configuration. You'll need to review your Source configuration and make an update. | No retries are attempted until the Source is updated. | Not applicable | ThirdPartyConfigError |
| ThirdPartyGeneric | Normally due to an error communicating with the third party service APIs. | Yes | The Source will retry for up to 90 minutes, after which it quits. | ThirdPartyGenericError |
| FirstPartyGeneric | Normally due to an error communicating with the internal Sumo Logic APIs. | Yes | The Source will retry for up to 90 minutes, after which it quits. | FirstPartyGenericError |
JSON configuration
Sources can be configured using UTF-8 encoded JSON files with the Collector Management API. See how to use JSON to configure Sources for details.
| Parameter | Type | Required? | Description | Access |
| config | JSON Object | Yes | Contains the configuration parameters for the Source. | |
| schemaRef | JSON Object | Yes | Use {"type":"Box"} for a Box Source. | not modifiable |
| sourceType | String | Yes | Use Universal for a Box Source. | not modifiable |
The following table shows the config parameters for a Box Source.
| Parameter | Type | Required | Default | Description | Access |
| name | String | Yes | Type a desired name of the Source. The name must be unique per Collector. This value is assigned to the metadata field _source. | modifiable | |
| description | String | No | null | Type a description of the Source. | modifiable |
| category | String | No | null | Type the category of the source. This value is assigned to the metadata field _sourceCategory. See best practices for details. | modifiable |
| fields | JSON Object | No | JSON map of key-value fields (metadata) to apply to the Collector or Source. Use the boolean field _siemForward to enable forwarding to SIEM. | modifiable | |
| credentialsJson | String | Yes | Its the authentication credentials to access Box platform. | modifiable |
Box Source JSON example
{
  "api.version":"v1",
  "source":{
    "schemaRef":{
      "type":"Box"
    },
    "config":{
      "name":"box-test-1",
      "fields":{
        "_siemForward":false
      },
      "credentialsJson":"********"
    },
    "state":{
      "state":"Collecting"
    },
    "sourceType":"Universal"
  }
}
Installing the Box App
Now that you have set up collection for Box, install the Sumo Logic App for Box to use the preconfigured searches and dashboards to analyze your data.
To install the app:
Locate and install the app you need from the App Catalog. If you want to see a preview of the dashboards included with the app before installing, click Preview Dashboards.
- From the App Catalog, search for and select the app.
- Select the version of the service you're using and click Add to Library. Version selection is applicable only to a few apps currently. For more information, see the Install the Apps from the Library.
- To install the app, complete the following fields.
- App Name. You can retain the existing name, or enter a name of your choice for the app.
- Data Source. Select either of these options for the data source.
- Choose Source Category, and select a source category from the list.
- Choose Enter a Custom Data Filter, and enter a custom source category beginning with an underscore. Example: (
_sourceCategory=MyCategory).
- Advanced. Select the Location in Library (the default is the Personal folder in the library), or click New Folder to add a new folder.
- Click Add to Library.
Once an app is installed, it will appear in your Personal folder, or another folder that you specified. From here, you can share it with your organization.
Panels will start to fill automatically. It's important to note that each panel slowly fills with data matching the time range query and received since the panel was created. Results won't immediately be available, but with a bit of time, you'll see full graphs and maps.
The Script Source is available for Linux or Windows environments with Java Runtime Environments.
Viewing Box Dashboards
Collaborations and Shares
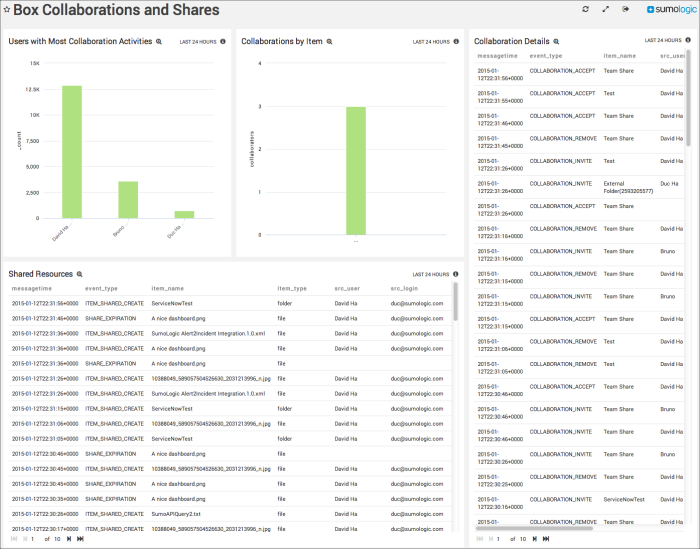
Users with Most Collaboration Activities. Shows the top users with the most collaboration activities and displays them as a column chart for the last 24 hours.
Collaborations by Item. Top items invoked in collaboration activities, displayed as a column chart for the last 24 hours.
Collaboration Details. Displays Box collaboration event information details in an aggregation table with columns for message time, event type, item name, source user, and source login for the last 24 hours.
Shared Resources. Displays the details of shared resources such as message time, event type, item name, item type, source user, and source login in an aggregation table for the last 24 hours.
Resource Access
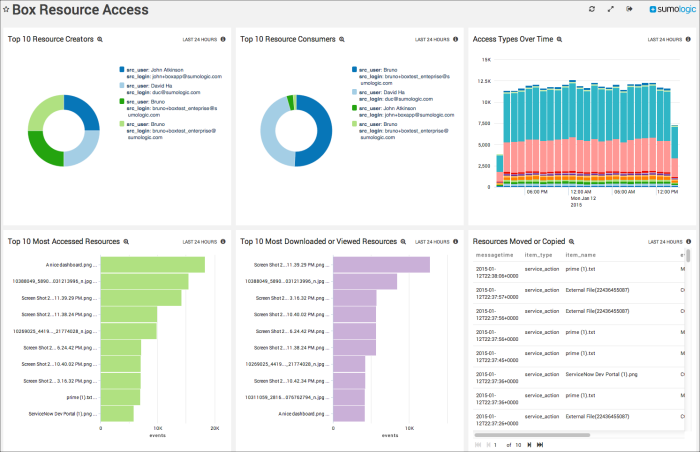
Top 10 Resource Creators. Displays the top 10 resource creators by showing details of Box upload or create events by user and count as a pie chart for the last 24 hours.
Top 10 Resource Consumers. Provides information on the top 10 resource consumers by showing Box download or preview events by user and event count as a pie chart for the last 24 hours.
Access Types Over Time. Shows access event types by count as a stacked column chart using timeslices of one hour on a timeline for the last 24 hours.
Top 10 Most Accessed Resources. Lists the top 10 most accessed resources by name in a bar chart for the last 24 hours.
Top 10 Most Downloaded or Viewed Resources. Lists the top 10 most downloaded or viewed resources by name in a bar chart for the last 24 hours.
Resources Moved or Copied. Displays details on resources that have been copied or moved such as message time, item type, item name, event type, source login, and source user in an aggregation table for the last 24 hours.
User Monitoring
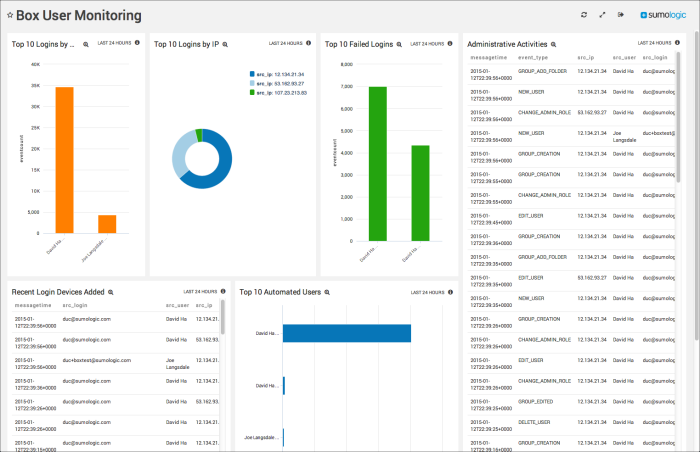
Top 10 Logins by User. Displays details about the top 10 users with the most logins, such as source user, source login, and event count in an aggregation table for the last 24 hours.
Top 10 Logins by IP. Shows the top 10 IP addresses that logged into the account in a pie chart for the last 24 hours.
Top 10 Failed Logins. Provides details on failed logins by user and event count in a column chart for the last 24 hours.
Administrative Activities. Displays administrative details such as message time, event type, source IP address, source user, source login, destination user, and destination login in an aggregation table for the last 24 hours.
Recent Login Devices Added. Reports details on recently added login devices such as message time, source login, source user, and source IP address in an aggregation table for the last 24 hours.
Top 10 Automated Users. Displays information on top automated users by user and event count in a column chart for the last 24 hours. Automated users are devices or applications that login through a user account.