Armis
The Sumo Logic App for Armis offers enhanced visibility into both alerts and device data, making it easier to monitor and manage your device security. The app features dashboards that analyze alerts by severity, status, and type, providing a clear picture of the trend of alerts over time. Additionally, the app allows you to monitor devices by risk level, type, and category, and provides a table view of the latest devices with key information to keep your IT infrastructure secure.
Log Types
The Sumo Logic App for Armis gathers log information from the following two sources.
Alerts. These are notifications or warnings generated when a potential security threat is detected. The alerts provide information about the type of threat, its severity, and other relevant details.
| Path | Type | Description |
|---|---|---|
activityIds | Number | The activity IDs of the alert. |
activityUUIDs | String | The activity UUIDs of the alert. |
alertId | Number | The ID of the alert. |
connectionIds | Number | The connection IDs of the alert. |
description | String | A text description of the alert. |
deviceIds | Number | The device IDs of the alert. |
severity | String | The severity of the alert. |
status | String | The status of the alert. |
time | Date | The date and time the alert occurred. |
title | String | The title of the alert. |
type | String | The type of the alert. |
Device. These logs are generated by the devices being managed by Armis and contain information about device activity, configuration changes, and other relevant details. The device logs help in understanding device behavior and assist in troubleshooting.
| Path | Type | Description |
|---|---|---|
accessSwitch | String | The access switch of the device. |
category | String | The category of the device. |
firstSeen | Date | The first time the device was seen. |
id | Number | The ID of the device. |
ipaddress | String | The IP address of the device. |
ipv6 | String | The IPv6 address of the device. |
lastSeen | Date | The last time the device was seen. |
macAddress | String | The MAC address of the device. |
manufacturer | String | The manufacturer of the device. |
model | String | The model of the device. |
name | String | The name of the device. |
operatingSystem | String | The operating system of the device. |
operatingSystemVersion | String | The operating system version of the device. |
purdueLevel | String | The purdue level of the device. |
riskLevel | String | The risk level of the device. |
sensor | String | The sensor of the device. |
site | String | The site of the device. |
Sample Log Messages
This section contains log messages for both Alerts and Device sources. It helps in monitoring activity and resolving issues.
Sample Alerts Log Messages
{
 "data": {
   "count": 10,
   "next": 10,
   "prev": null,
   "results": [
     {
       "activityUUIDs": [
         "zXBTUoUBAAAAAF_2V6Ae"
       ],
       "alertId": 124,
       "connectionIds": [

       ],
       "description": "The Armis security platform has detected a violation of a policy and generated an alert.",
       "deviceIds": [
         83
       ],
       "severity": "Medium",
       "status": "Unhandled",
       "time": "2022-12-27T06:44:31.638892+00:00",
       "title": "Test Alerts - New Device",
       "type": "System Policy Violation"
     }
   ],
   "total": 125
 },
 "success": true
}
Sample Device Log Messages
{
   "data": {
     "count": 83,
     "next": null,
     "prev": null,
     "results": [
       {
         "accessSwitch": null,
         "boundaries": "N/A",
         "businessImpact": "Unassigned",
         "category": "Handhelds",
         "customProperties": {

         },
         "dataSources": [
           {
             "firstSeen": "2021-07-27T15:15:53+00:00",
             "lastSeen": "2021-07-27T15:15:53+00:00",
             "name": "API",
             "types": [
               "Data Upload"
             ]
           },
           {
             "firstSeen": "2022-10-18T13:10:50.171951+00:00",
             "lastSeen": "2022-10-28T11:02:59.289138+00:00",
             "name": "User",
             "types": [
               "Data Upload"
             ]
           }
         ],
         "firstSeen": "2021-07-27T15:15:53+00:00",
         "id": 2,
         "ipAddress": "10.100.100.111",
         "ipv6": "fe82:3::1ff:fe23:4567:890e",
         "lastSeen": "2022-10-18T13:07:46.713618+00:00",
         "macAddress": "BC:BC:BC:BC:AC:AB",
         "manufacturer": "Apple",
         "model": "iPhone 6SP",
         "name": "test_device alt1",
         "operatingSystem": "iOS",
         "operatingSystemVersion": "16.0",
         "riskLevel": 9,
         "sensor": {
           "name": "API",
           "type": "API"
         },
         "site": {
           "location": "No location",
           "name": null
         },
         "tags": [

         ],
         "type": "Mobile Phones",
         "userIds": [

         ],
         "visibility": "Full"
       }
     ],
     "total": 83
   },
   "success": true
 }
Sample Queries
This section contains the sample queries of both the Alerts and Device.
_sourceCategory=ArmisDashboards alertId
| json "alertId","activityUUIDs","connectionIds","description","deviceIds","severity","status","time","title","type" as alertId,activityUUIDs,connectionIds,description,deviceIds,severity,status,time,title,type nodrop
| where severity matches"{{Severity}}" and  status matches"{{Status}}" and type matches"{{Type}}"
| extract field=deviceIds "(?<ids>\b\d+\b)" multi
| where "{{Site}}" = "*" or [subquery: (_sourceCategory=ArmisDashboards id)
  | json "id","site.name" as ids, site
  | where site matches "{{Site}}"
  | compose ids]
| count_distinct(alertId)
_sourceCategory=ArmisDashboards id
| json "id","name","manufacturer","model","riskLevel","sensor","site.name","type","category","operatingSystem" as id, name, manufacturer, model, riskLevel, sensor, site, type, category, operatingSystem nodrop
| where site matches "{{Site}}" and manufacturer matches "{{Manufacturer}}" and type matches "{{Type}}"
| count_distinct(id)
Collecting Logs for Armis API
This section explains how to collect logs from Armis API and ingest them into Sumo Logic. Refer to the Armis API Cloud-to-Cloud Integration to create the source and use the same source category while installing the app.
Installing the Armis App
Locate and install the app from the App Catalog. If you want to see a preview of the dashboards included with the app before installing, click Preview Dashboards.
To install the app, follow the steps below:
- From the App Catalog, search for the app and select it.
- Select the version of the service you're using and click Add to Library.
Version selection is applicable only to a few apps currently. For details, see the Install the Apps from the Library.
- To install the app, enter the following fields.
- App Name. You can retain the existing name, or enter a name of your choice for the app.
- Data Source. Select either of these options for the data source:
- Choose Source Category and then choose a source category from the list.
- Select Enter a Custom Data Filter and type in a custom source category that starts with an underscore. For Example,
_sourceCategory=MyCategory.
- Advanced. Select the Location in Library (the default is the Personal folder in the library), or click New Folder to add a new folder.
- Click Add to Library.
Once an app is installed, it will appear in your Personal folder, or other folder that you specified. You can share it with your organization.
The panels will begin to fill automatically. It's worth noting that each panel gradually fills with data that matches the time range query and has been received since the panel was created. The results will not be available right away, but with some patience, you will be able to view full graphs and maps.
Viewing the Armis Dashboards
All dashboards have a set of filters that you can apply to the entire dashboard, as shown in the following example. Click the funnel icon in the top dashboard menu bar to display a scrollable list of filters that are applied across the entire dashboard.
You can use filters to drill down and examine the data on a granular level. Filters include client country, client device type, client IP, client request host, client request URI, client request user agent, edge response status, origin IP, and origin response status.
Each panel has a set of filters that are applied to the results for that panel only, as shown in the following example. Click the funnel icon in the top panel menu bar to display a list of panel-specific filters.
Alerts Overview Dashboard
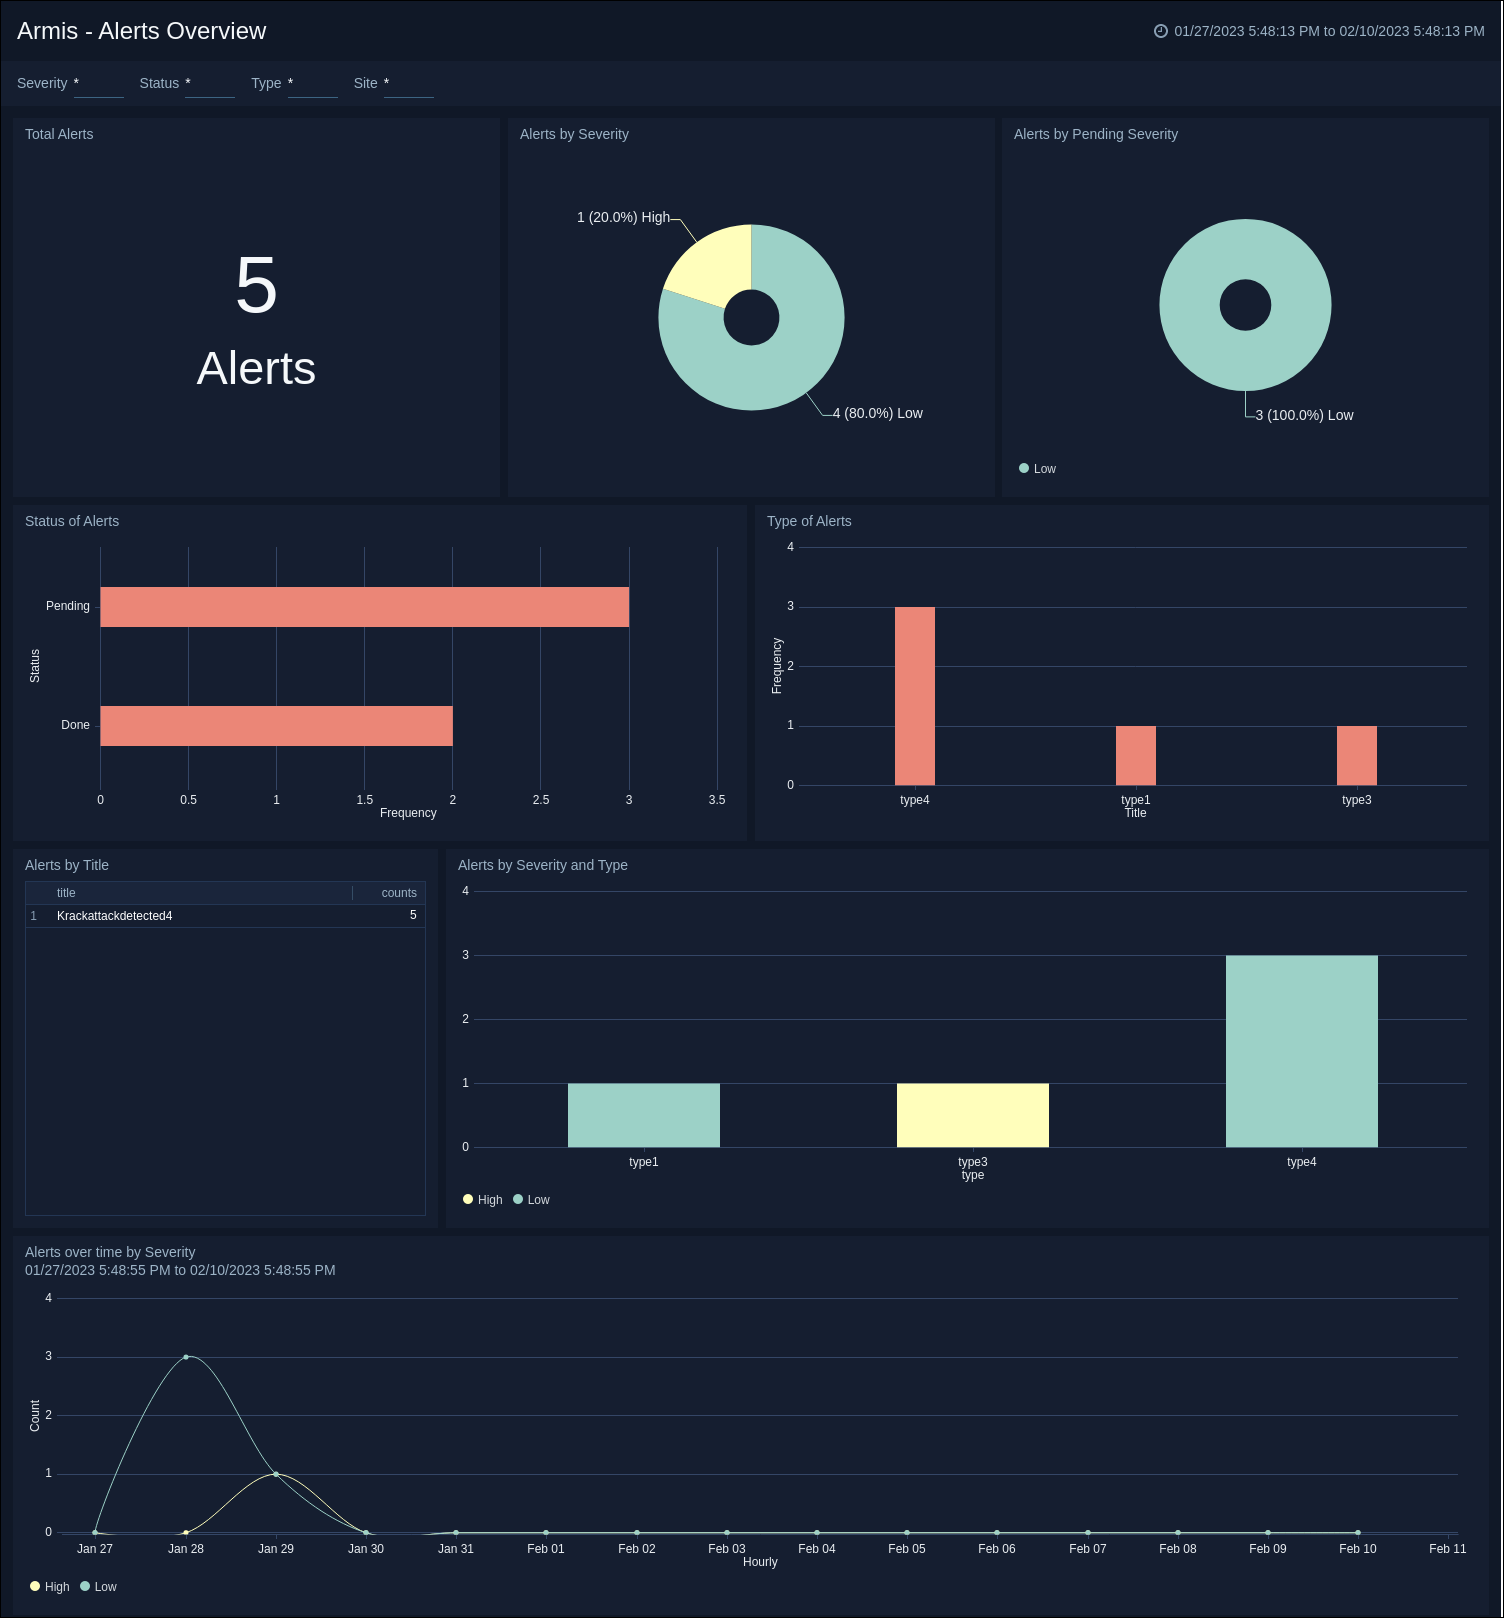
Armis - Alerts Overview dashboard. The dashboard provides a comprehensive analysis of alerts, by categorizing them based on their severity, status, type, and presenting a trend of alerts over a specified period of time.
Device Overview Dashboard
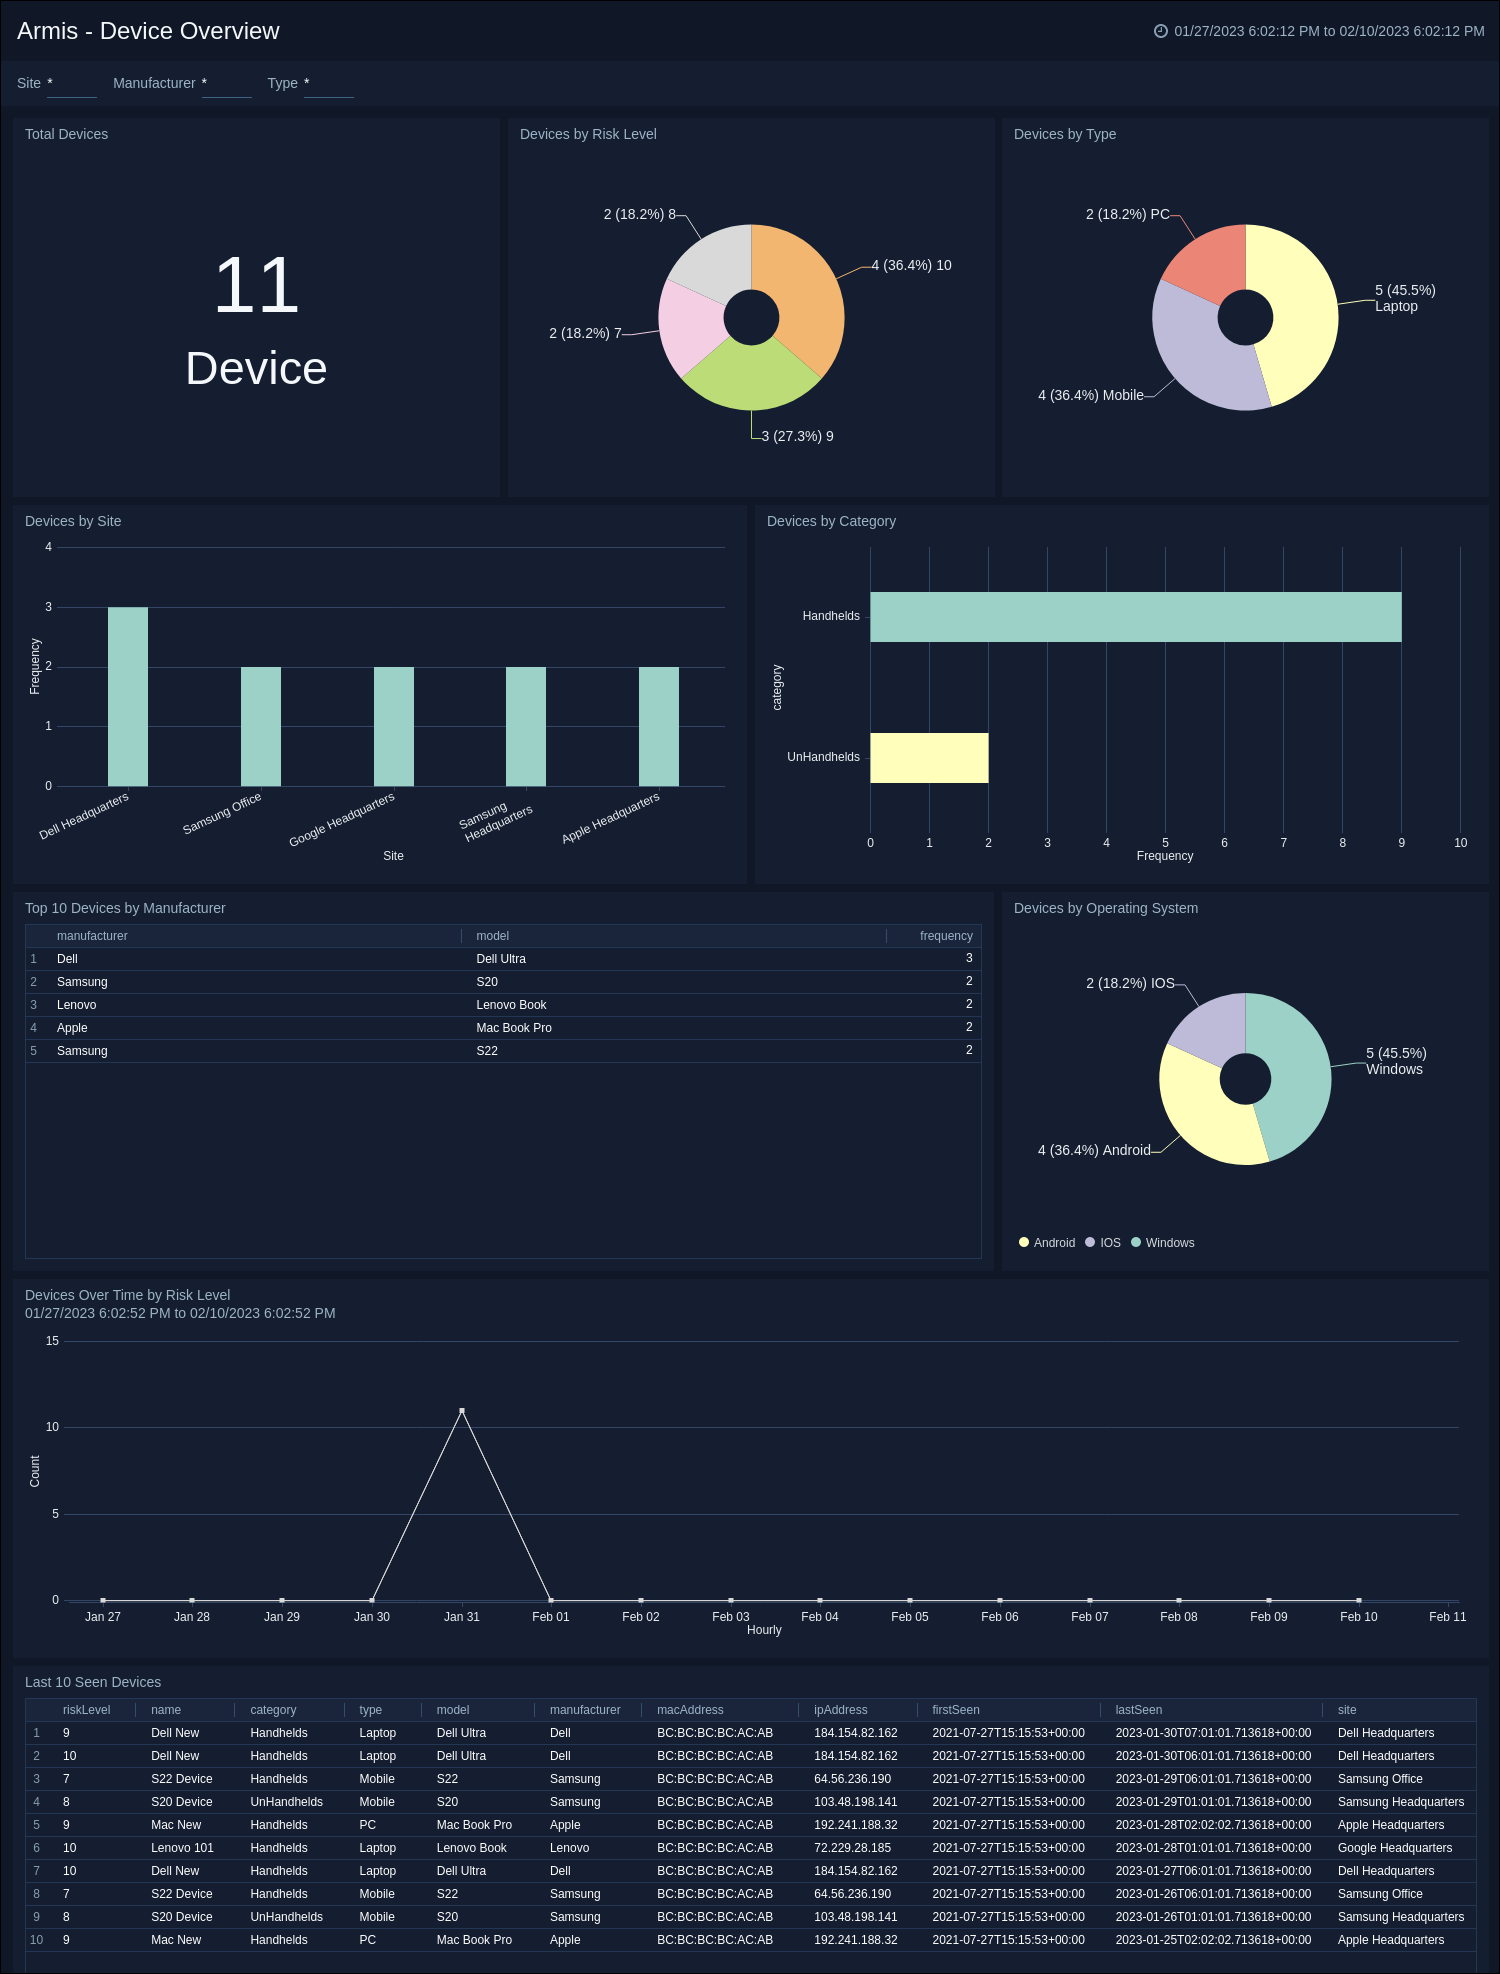
Armis - Device Overview dashboard. The dashboard provides a table view of last-seen devices with key information to protect your IT infrastructure and offers visibility into devices based on risk levels, types, and categories.