This is an archive of the 2017 Sumo Logic Service Release Notes.
To view the full archive, click here.
December 20, 2017 (Apps)
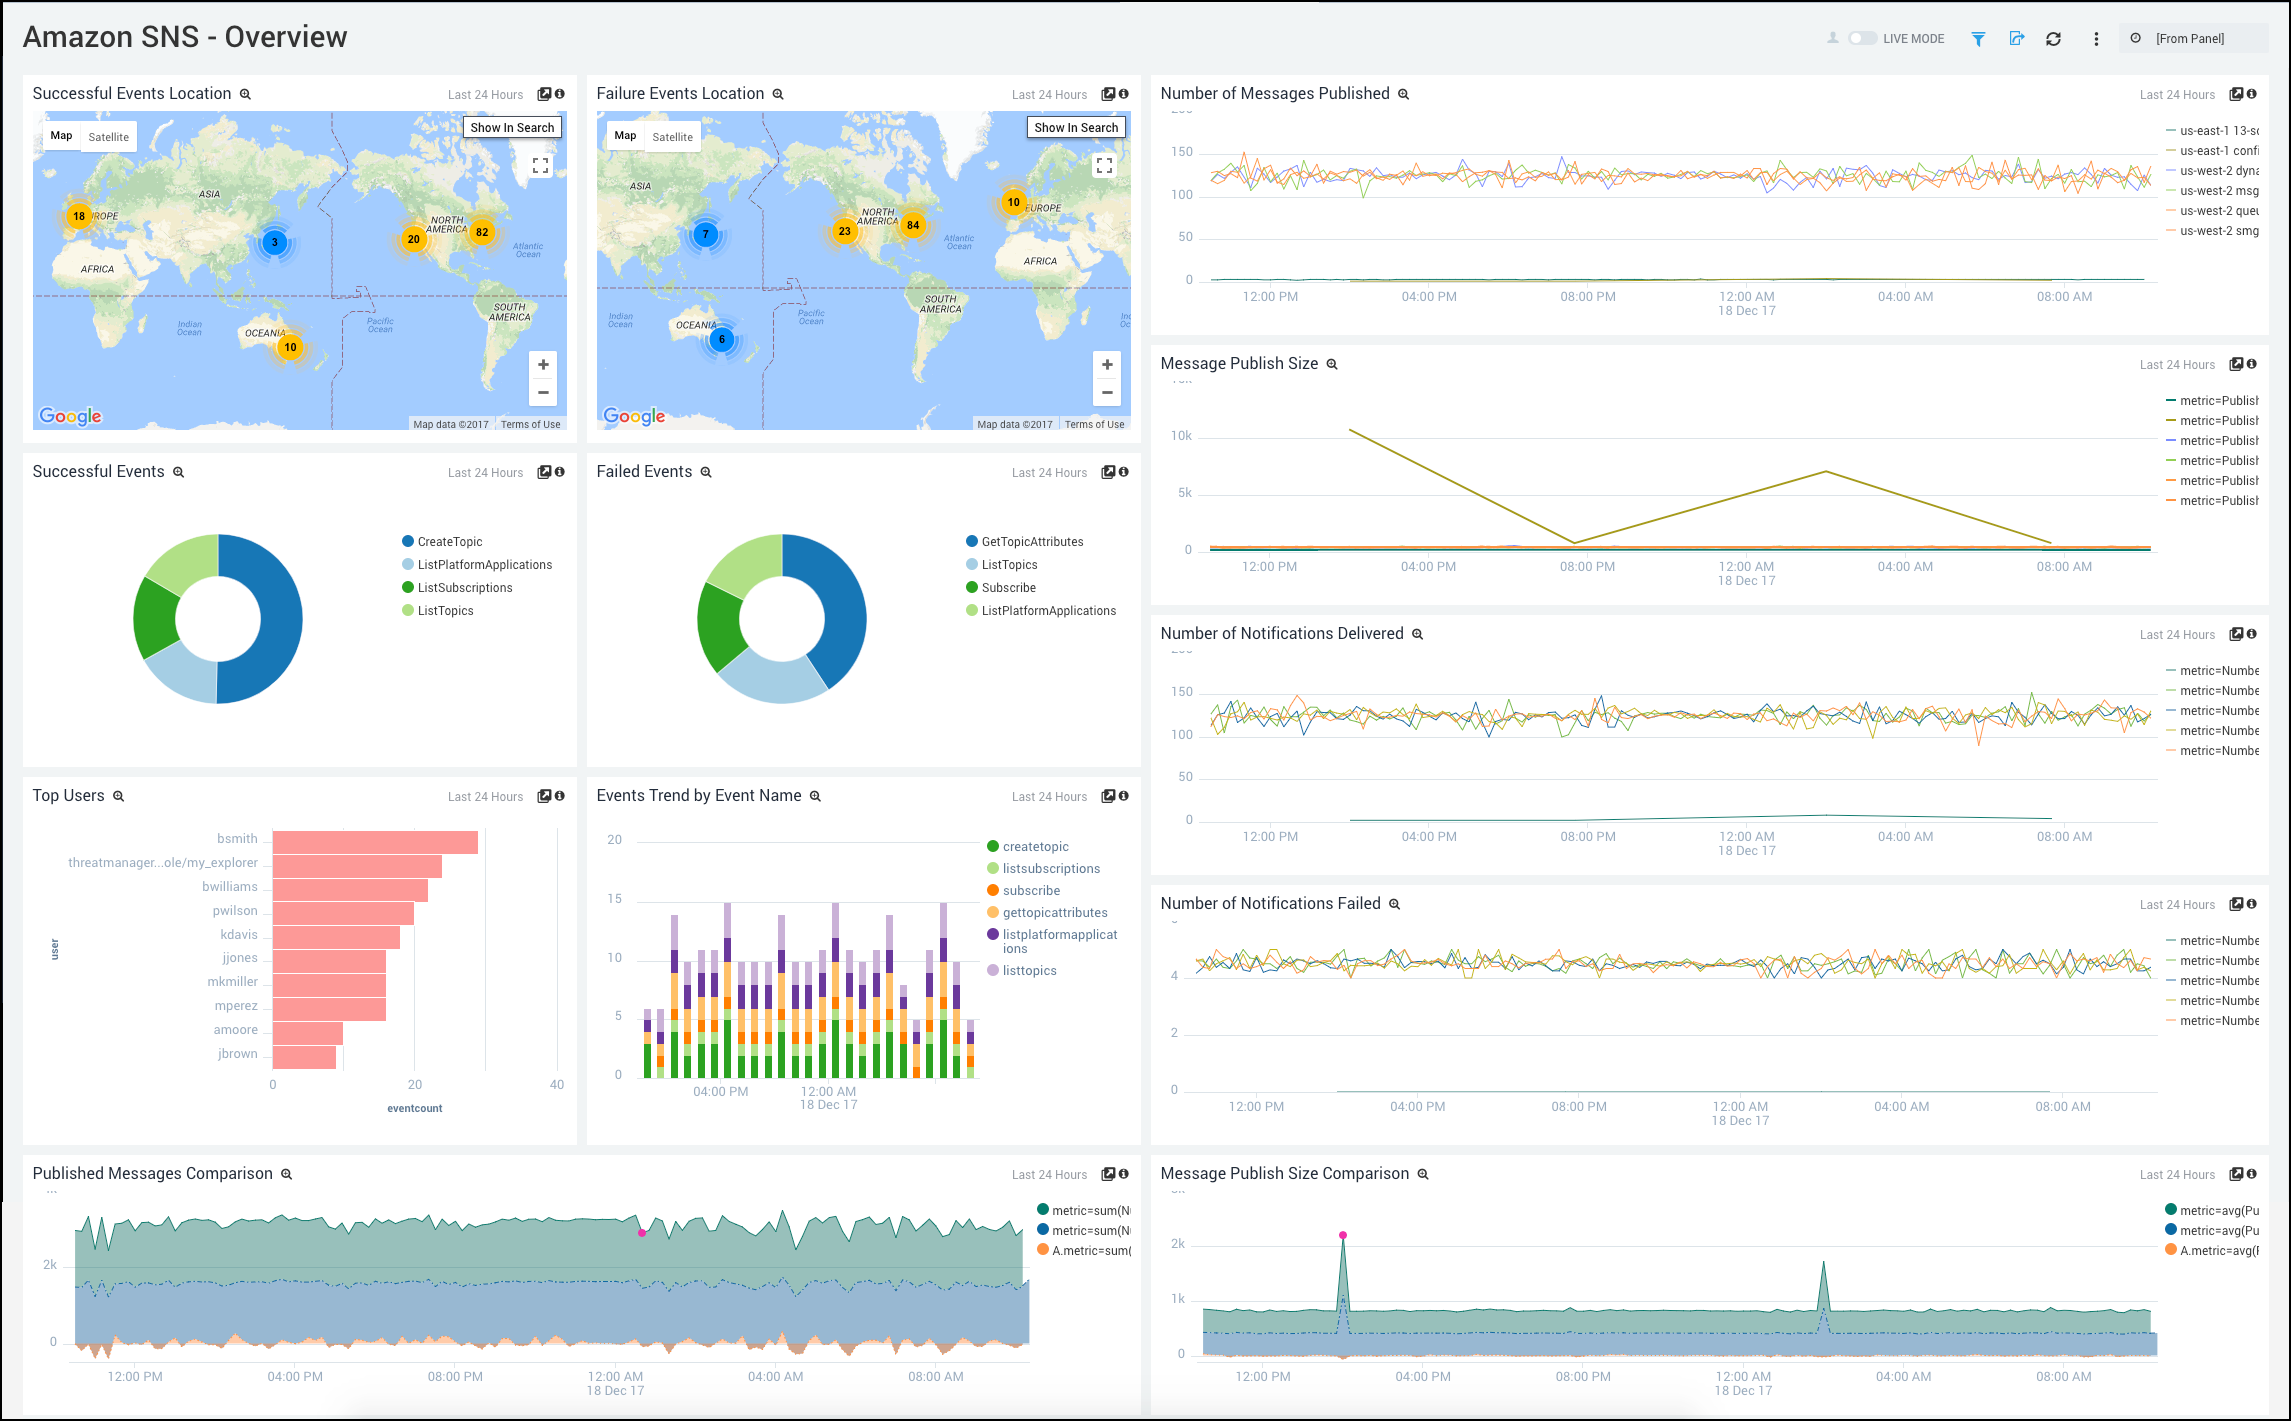
New Beta App - The Sumo Logic App for Amazon SNS is now available. It is a unified logs and metrics (ULM) App that provides insights into the operations and utilization of your SNS service. The preconfigured dashboards help you monitor the key metrics by application, platform, region, and topic name, view the SNS events for activities, and help you plan the capacity of your SNS service.
December 5, 2017 (Dashboards)
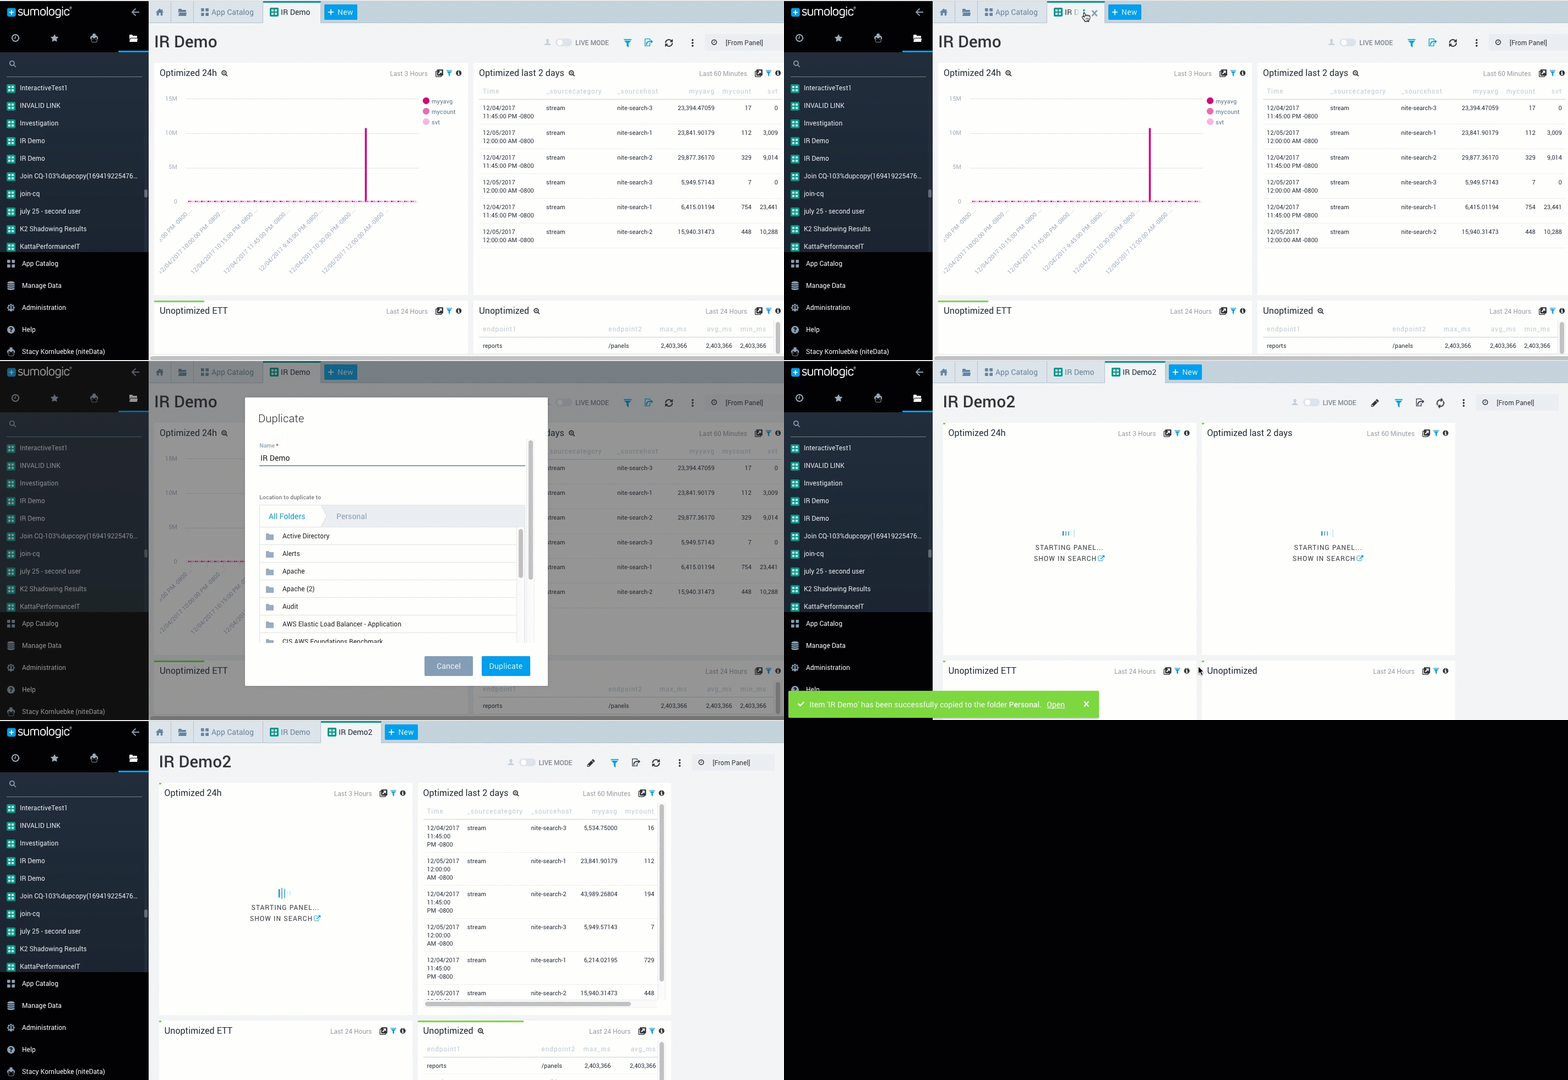
Enhancement - You can now duplicate dashboards from the dashboard tab. Choose a name for the duplicate and save it to a folder.
December 5, 2017 (Live Tail)
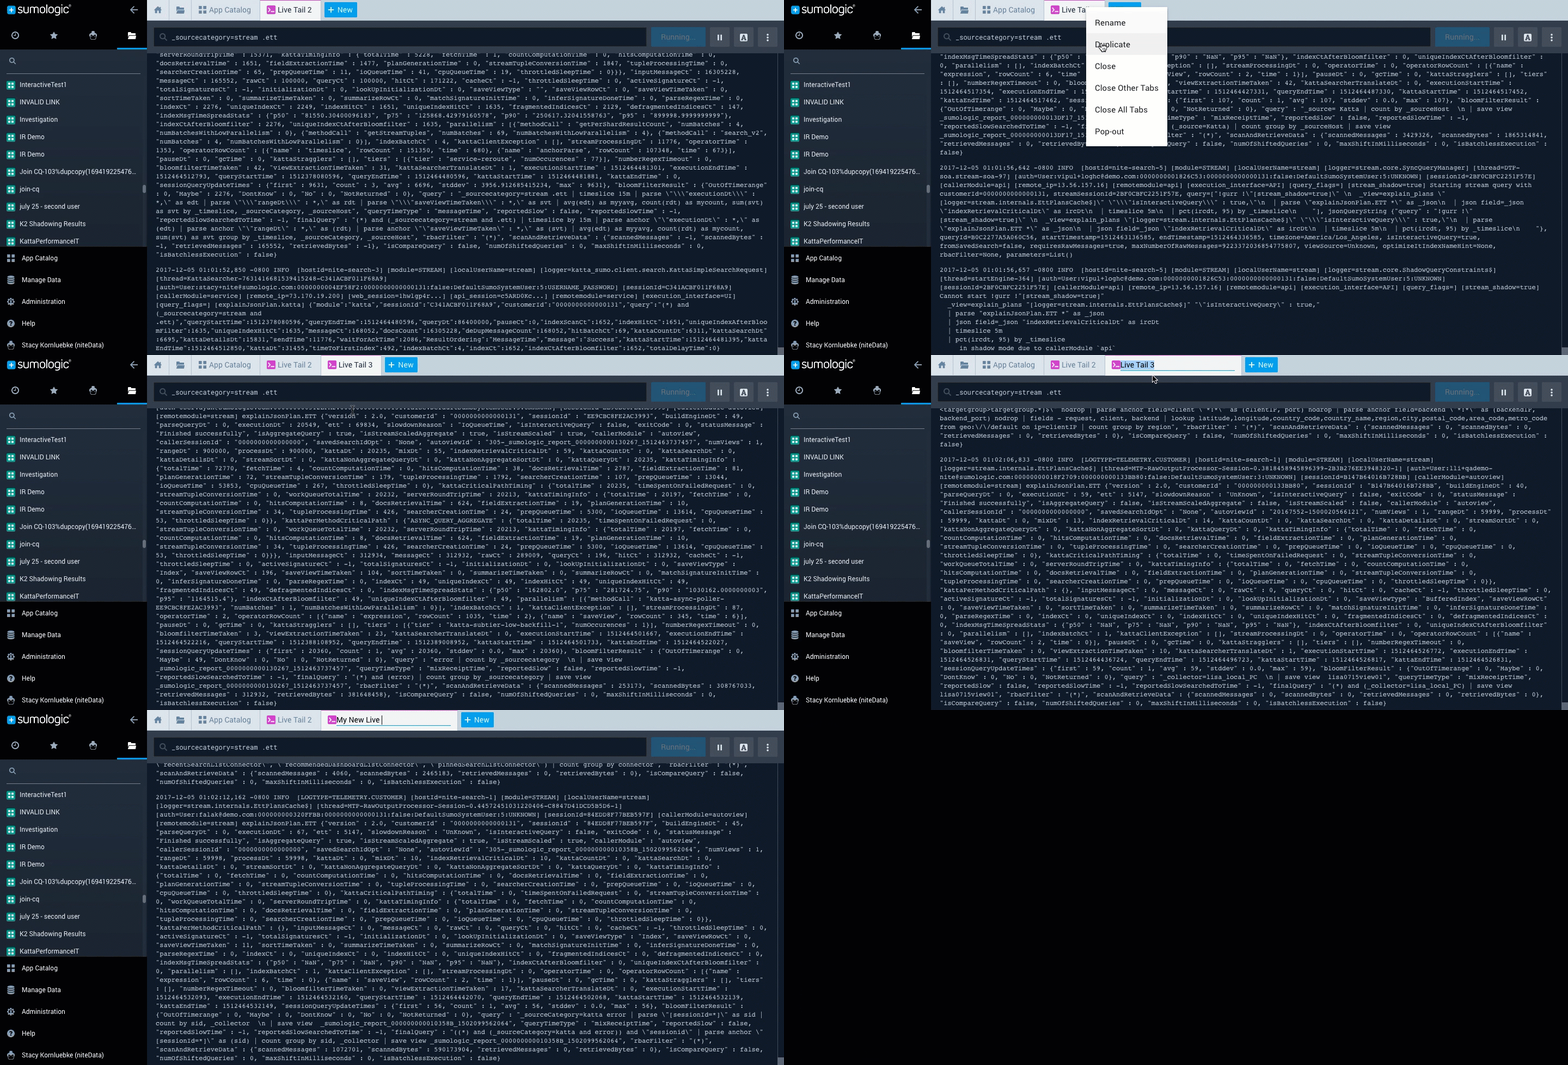
Enhancement - Duplicate option now available for Live Tail sessions.
Bug Fix - Rename option no longer disabled for Live Tail when maximum tab limit reached.
December 5, 2017 (Metrics)
Enhancement - New error messages for pct operator when conditions are invalid, such as “Percentile argument greater than 100”.
Enhancement - Duplicate metrics query option now available.
Enhancement - Math expressions such as min, max, abs, and round are now case insensitive to match the log search experience.
Bug Fix - Host Metrics ingest now works with the Setup Wizard.
Bug Fix - Negative values for log and sqr in queries now result in error messages because they are not valid values for these operators.
December 5, 2017 (Search)
Bug Fix - Exporting a search experience improved.
Bug Fix - To save on naming issues, duplicate imported searches now forced to have a different name than the existing search.
December 5, 2017 (Security)
TLS 1.0 Protocol Disabled - We have disabled support for TLS 1.0. You must now use TLS 1.1 and up. Unless you are using IE 10 or below we do not expect this change to impact you.
December 5, 2017 (User Interface)
Enhancement - To save space on your tabs, Sumo no longer labels duplicate search tabs as “Copy of”. Now duplicate searches are labeled Search and a value, similar to duplication in Metrics.
Bug Fix - You can now scroll off screen and still select the New Tab icon (+).
Bug fix - Collection status page now loads quickly for the Internet Explorer Browser.
December 1, 2017 (Apps)
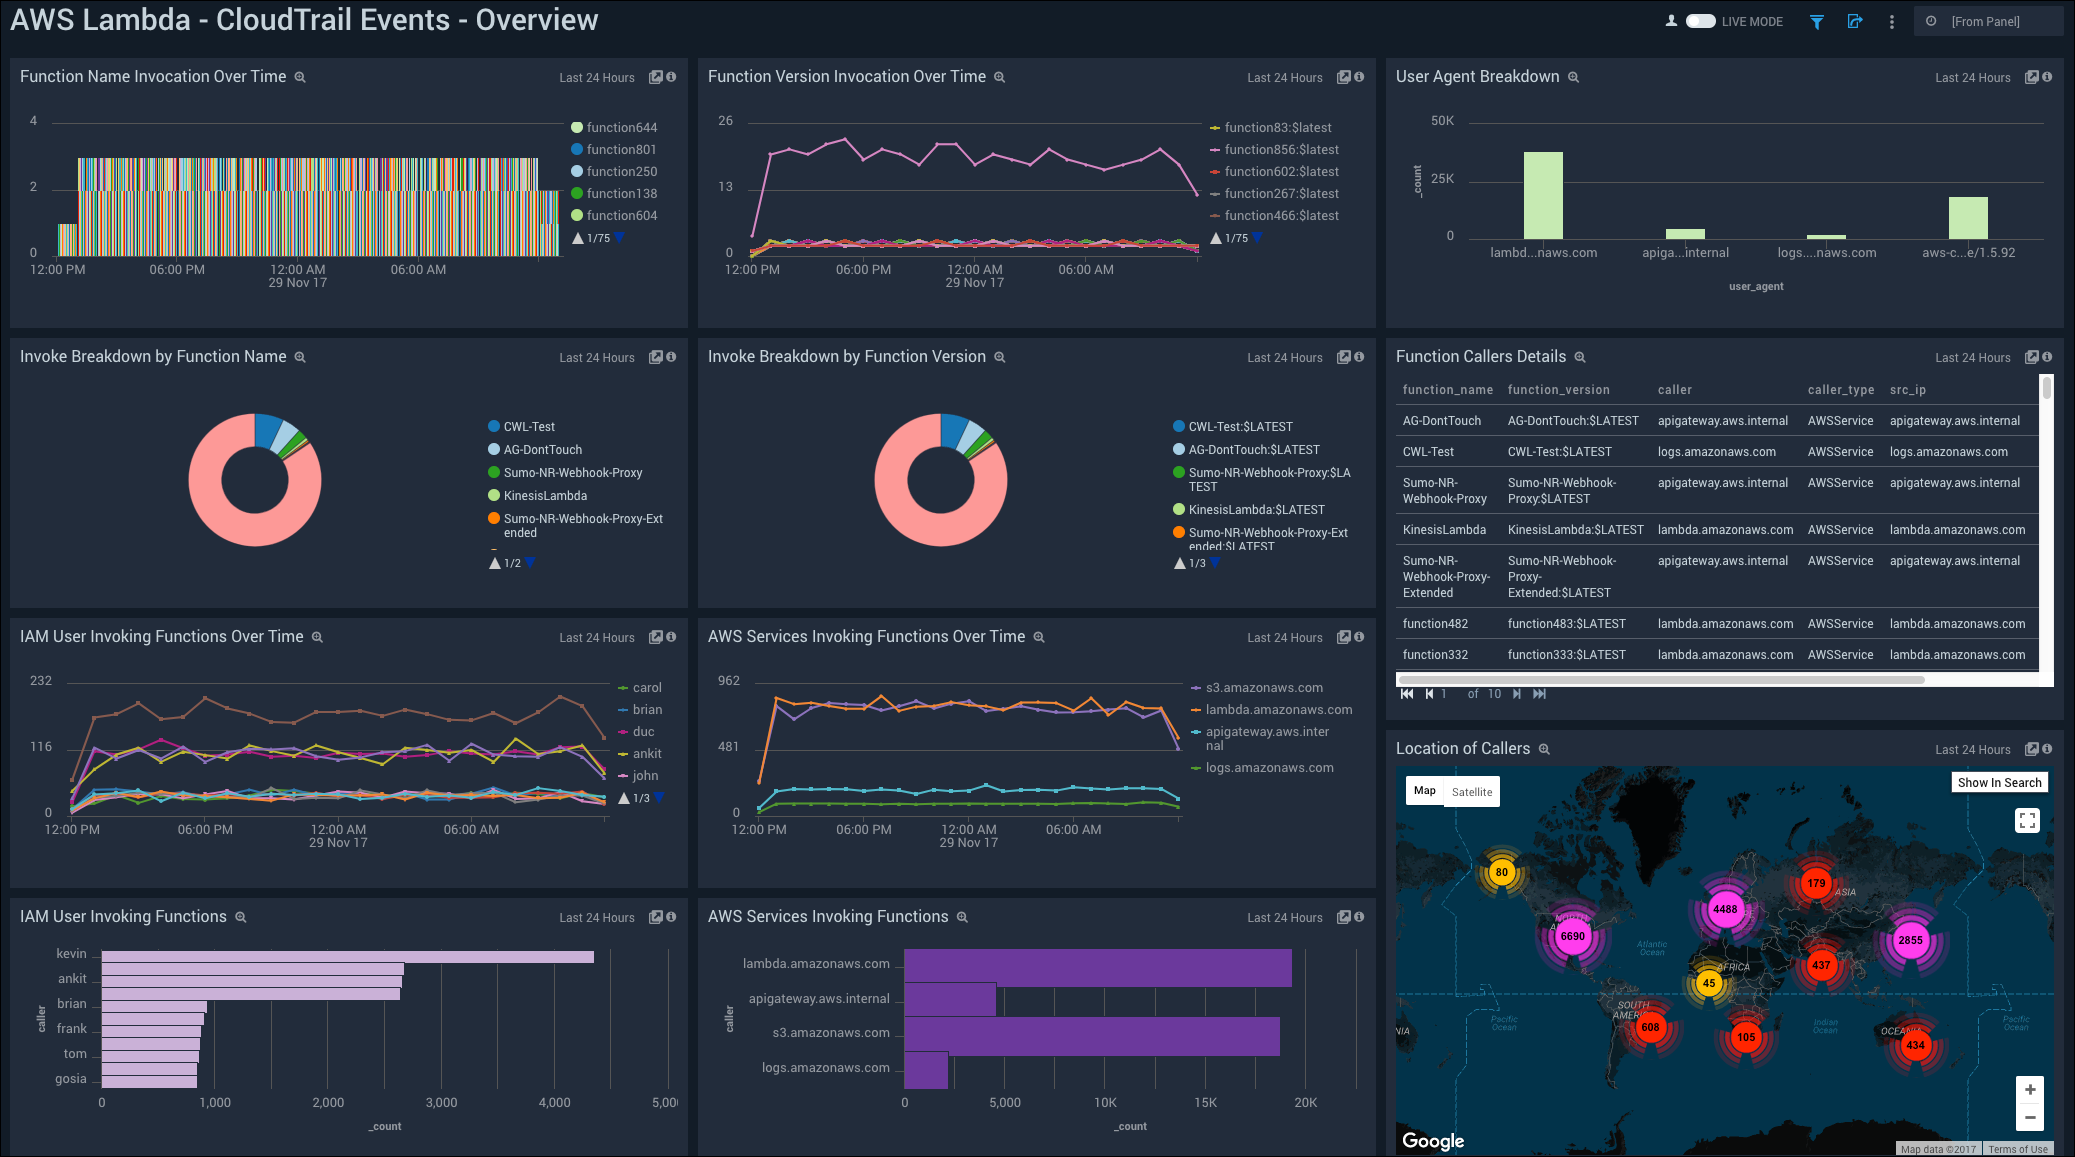
Apps Update - The Sumo Logic App for AWS Lambda helps you monitor the operational and performance trends in all the Lambda functions in your account. The App now supports a new data source, CloudTrail Lambda Data Events and has pre-built dashboards for that source.
November 29, 2017 (Apps)
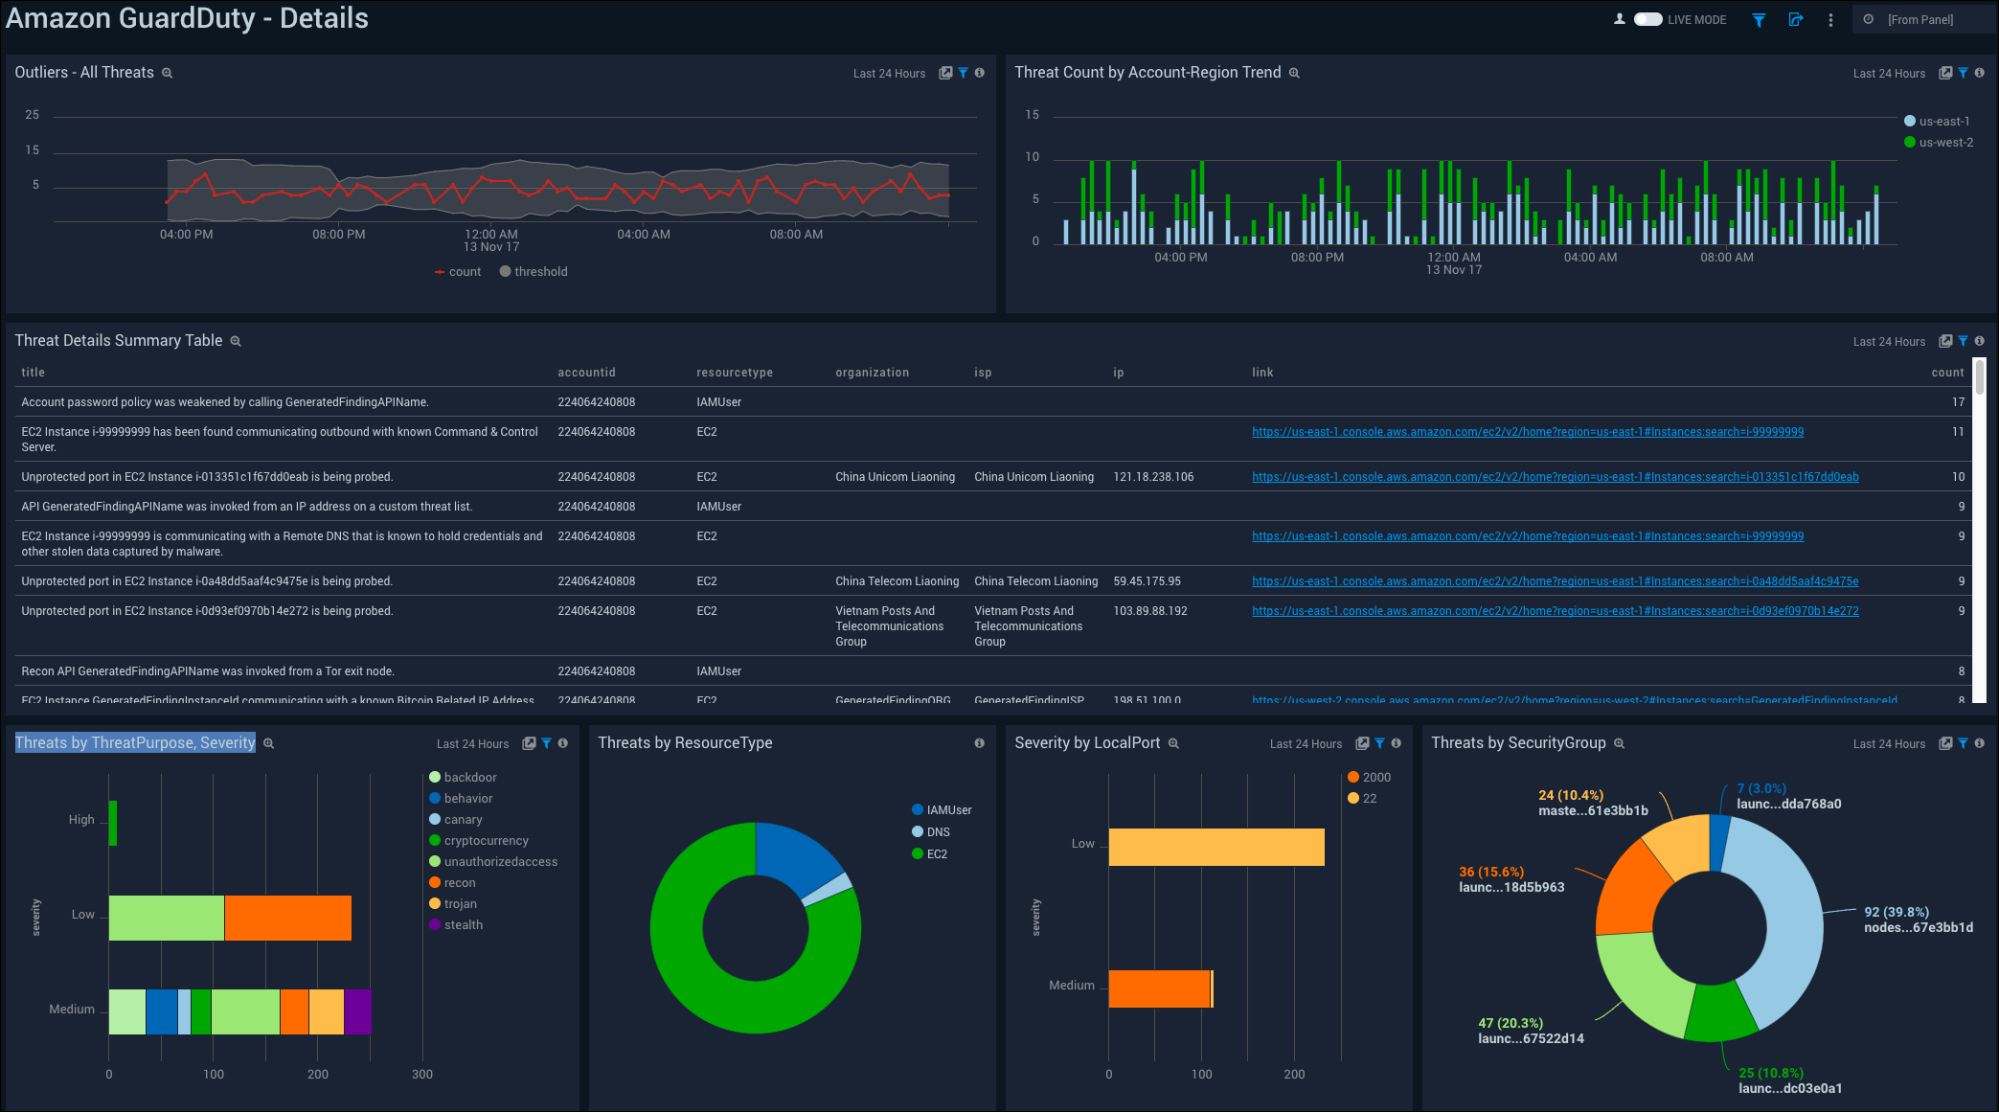
New App - The Amazon GuardDuty Sumo Logic app provides insights into the activities in your AWS account based on the findings from Amazon GuardDuty. The App includes preconfigured dashboards that allow you to detect unexpected and potentially malicious activities in your AWS account by providing details on threats by severity, VPC, IP, account ID, region, and resource type.
November 27, 2017 (Search)
Update - fields operator for defining the order of the columns. Along with choosing which fields are displayed in the results, you can now use the fields operator to order the columns in the result. The order of the columns in the result would be the order you specified with the fields operator.
November 22, 2017 (Apps)
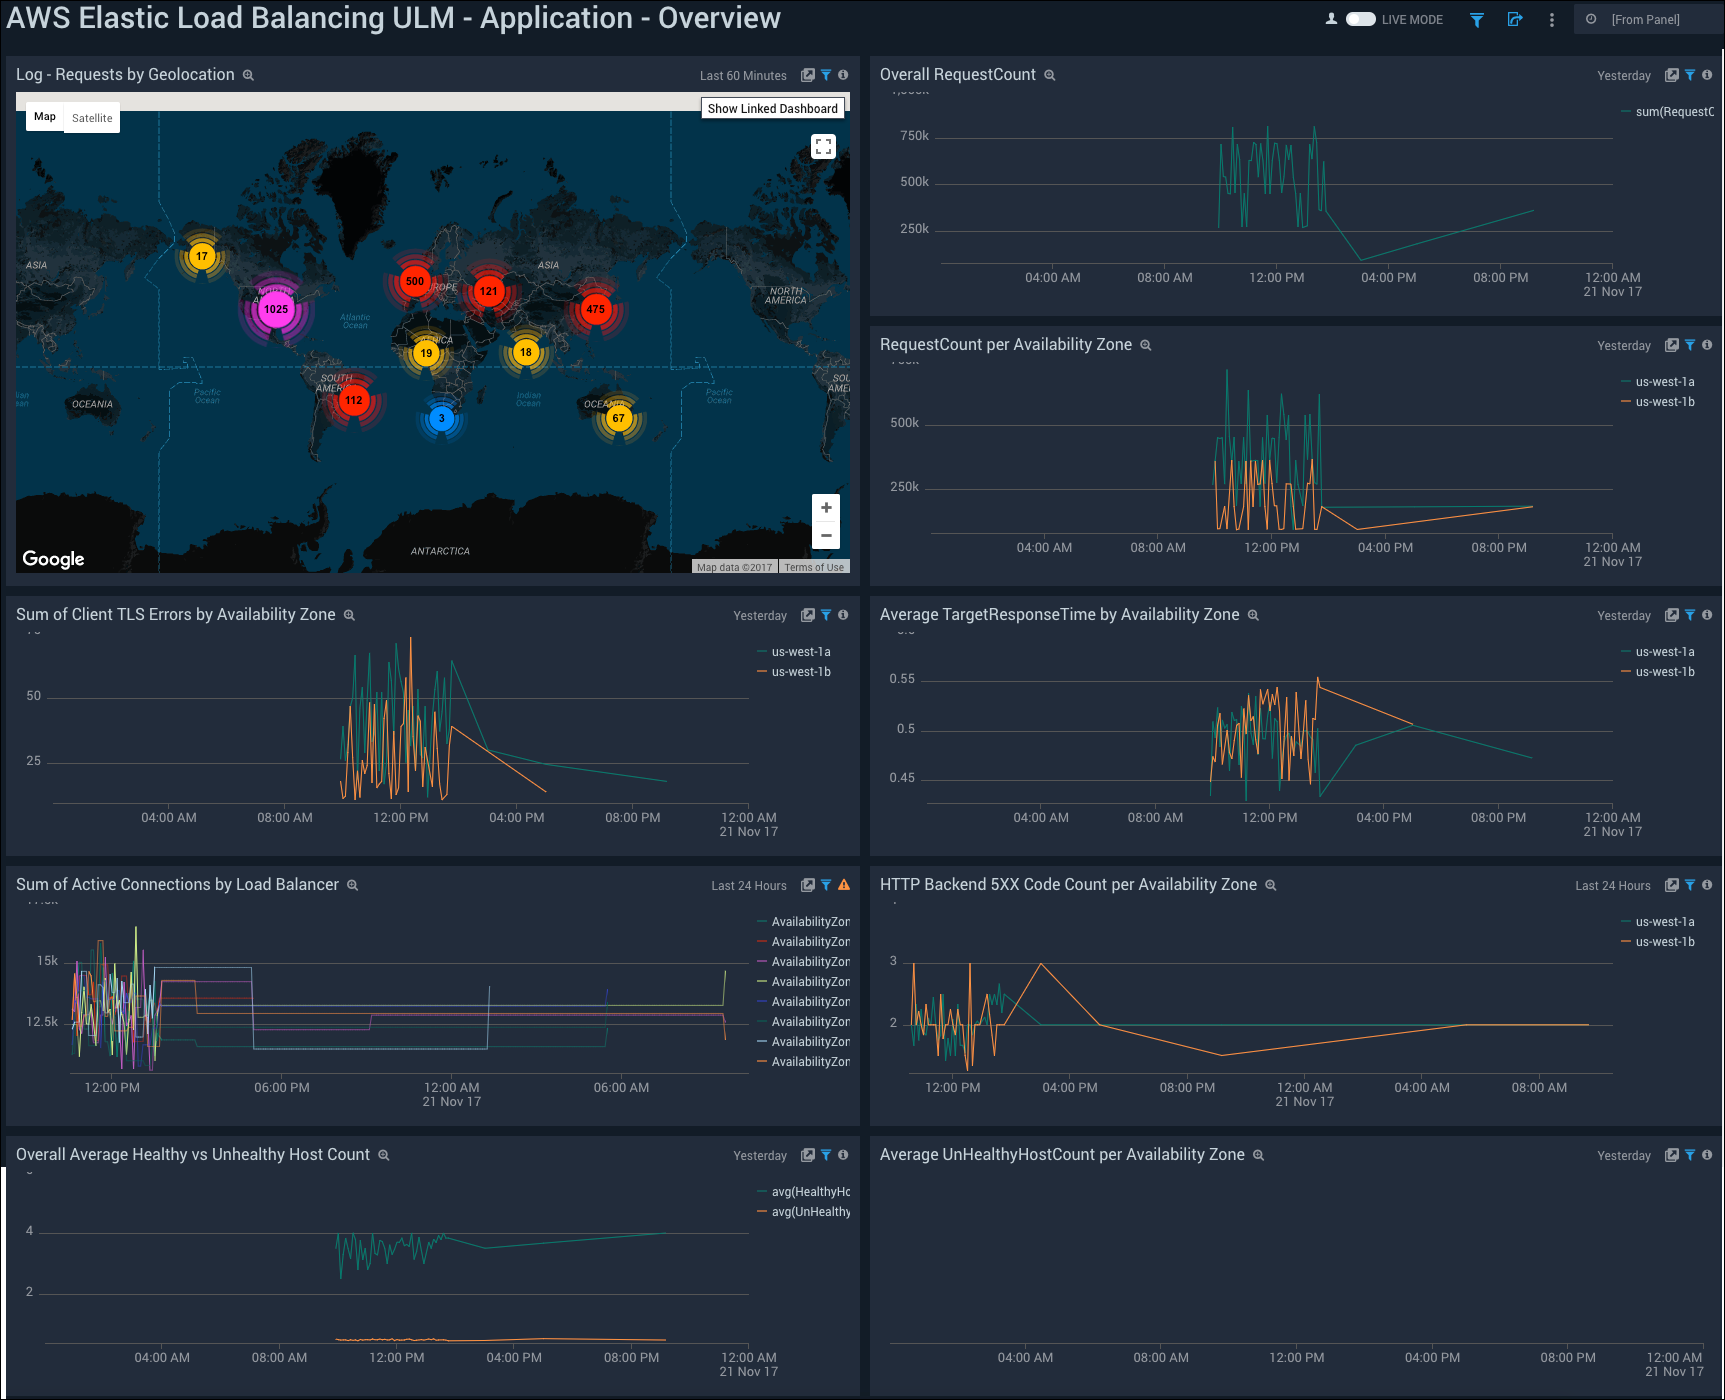
New Beta App - The Sumo Logic App for AWS Elastic Load Balancing ULM - Application is now available. It is a unified logs and metrics (ULM) App that gives you visibility into the health of your Application Load Balancer and target groups. Use the preconfigured dashboards to understand the latency, request and host status, threat intel, and HTTP backend codes by availability zone and target group.
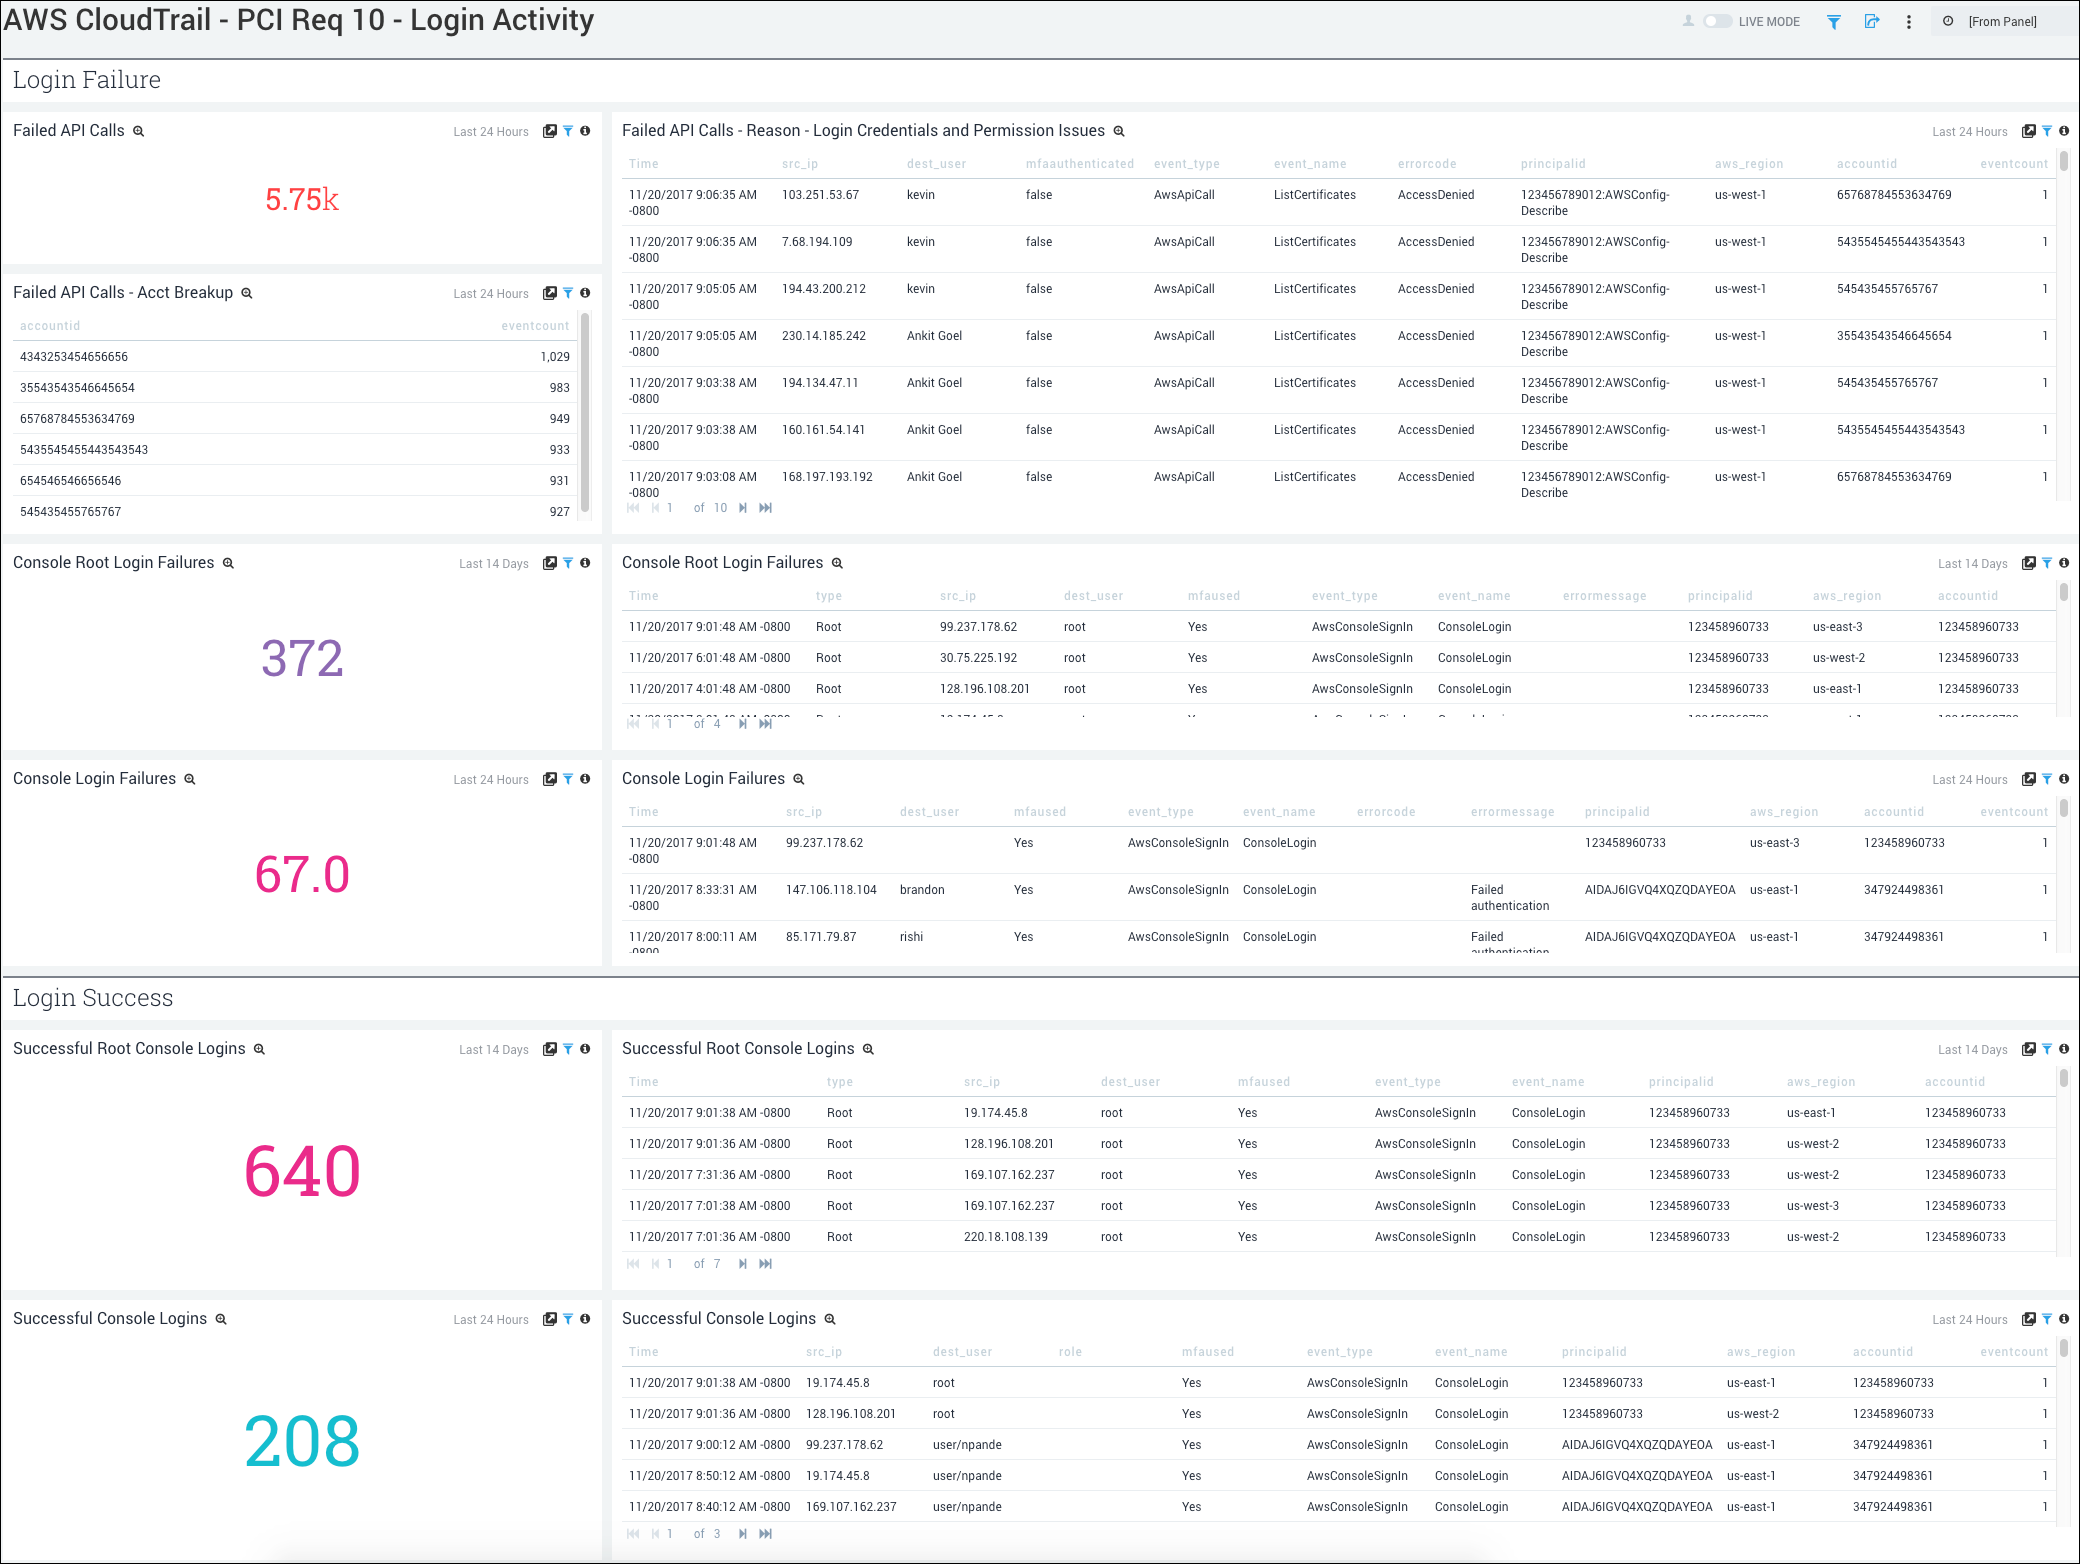
New panels added to the PCI Compliance for CloudTrail App - The PCI Compliance for AWS CloudTrail App is now updated to include the details of create and delete group, added and removed users, and password events in the PCI Req 08 - Account, System Monitoring dashboard; policy operations in the PCI Req 08, 10 - Privileged Activity dashboard; and console root logins in the PCI Req 10 - Login Activity dashboard.
November 21, 2017 (Apps)
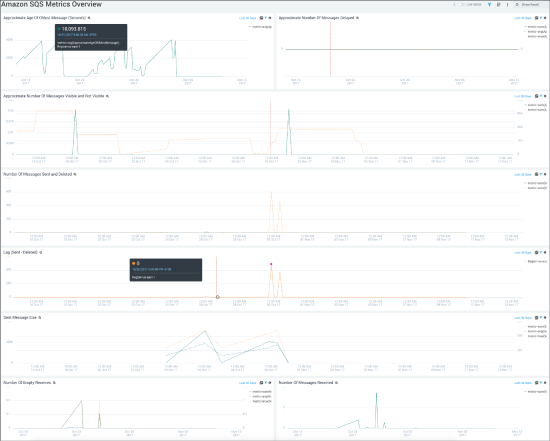
New Beta App - Sumo Logic has a beta app for Amazon SQS, a unified logs and metrics (ULM) app that provides operational insights into your Amazon Simple Queue Service (SQS) use. The pre-configured dashboards help you monitor the key metrics, view the SQS events for queue activities, and help you plan the capacity of your SQS service.
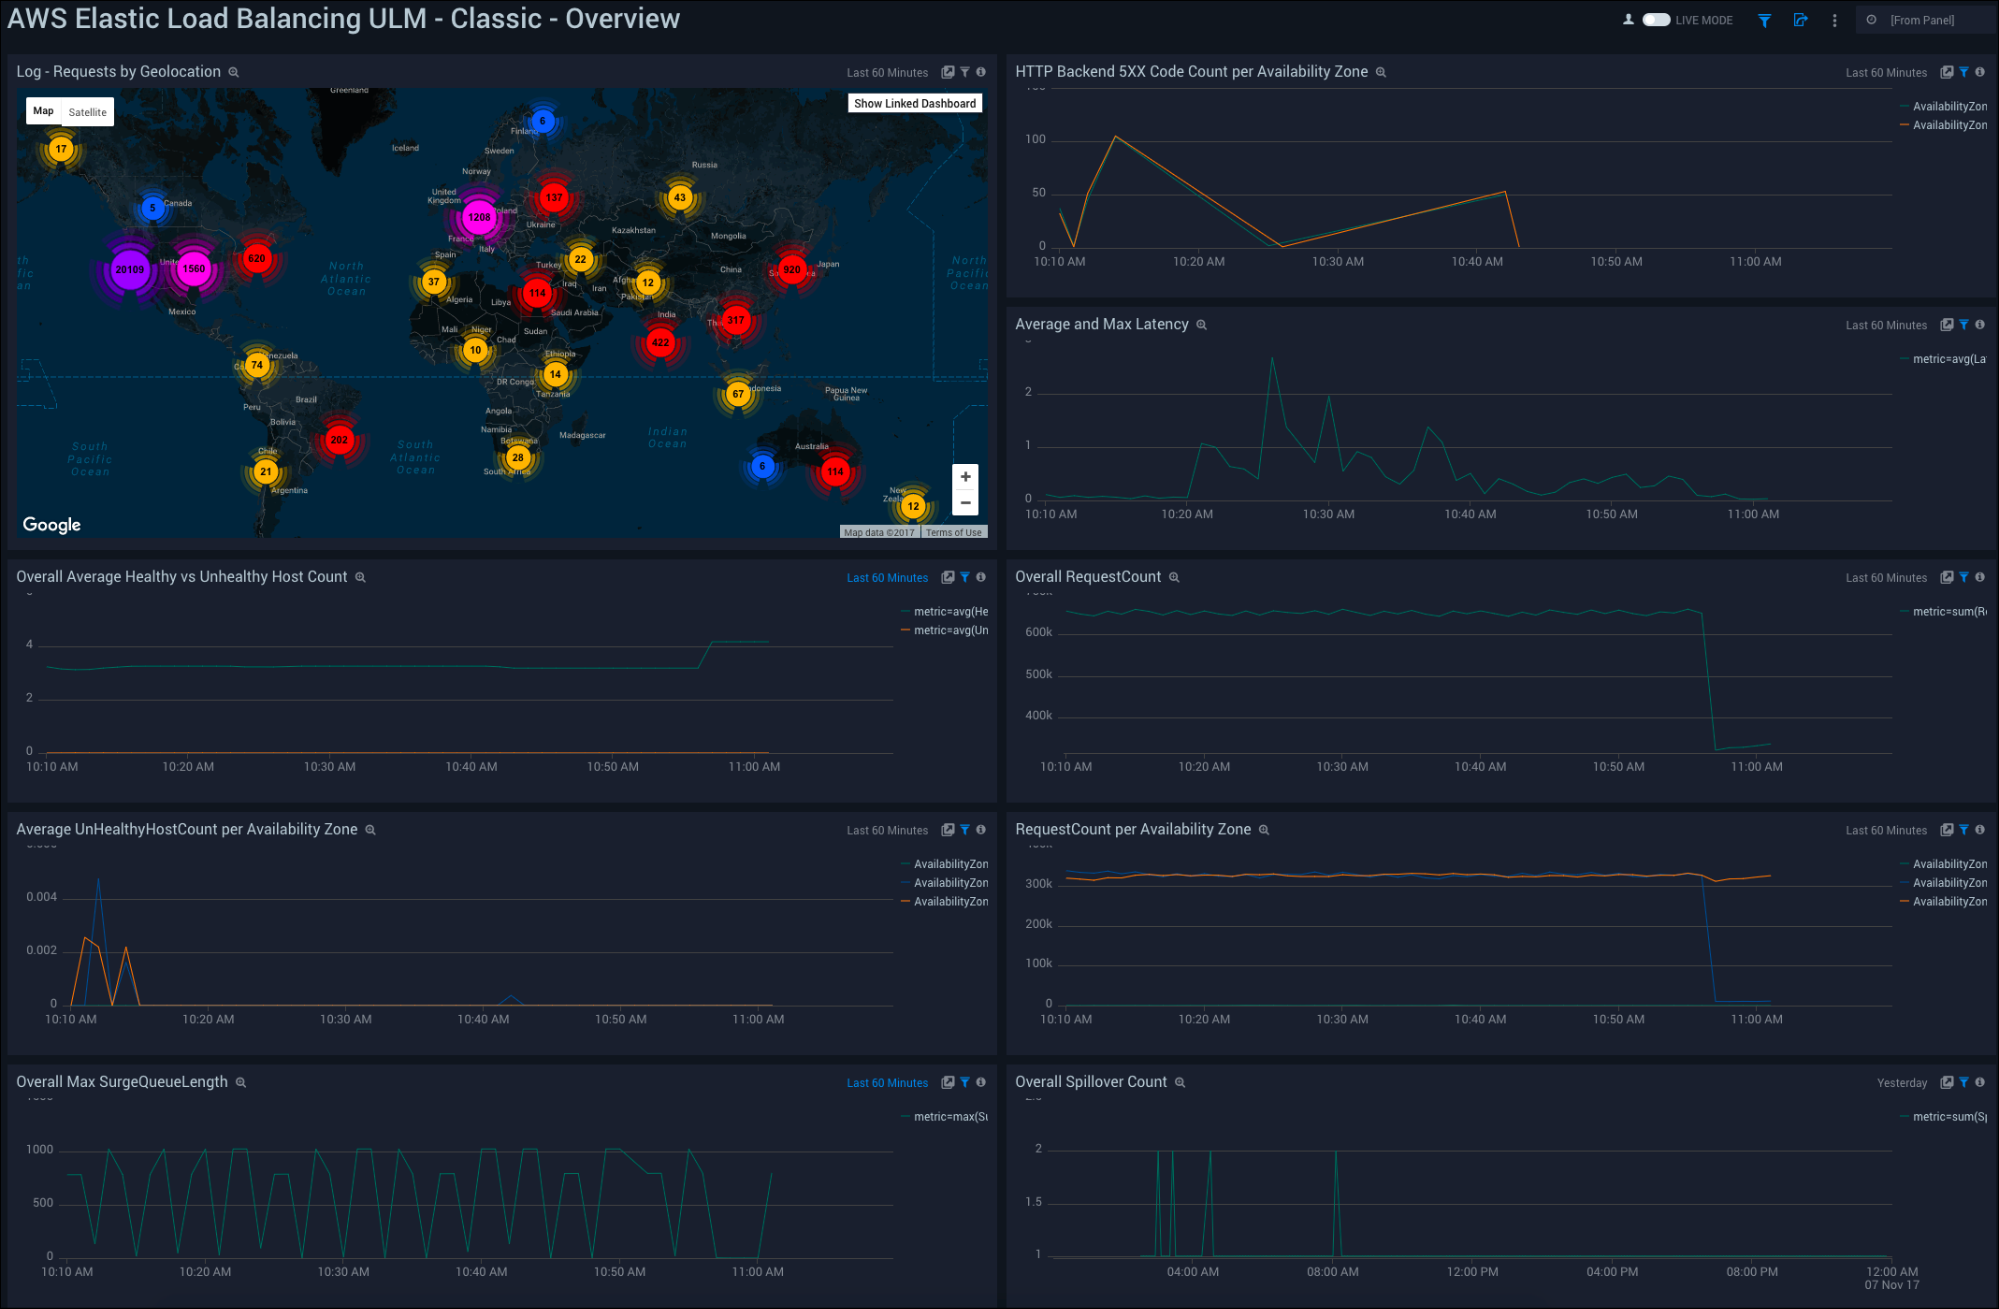
New Beta App - Sumo Logic has a beta unified logs and metrics (ULM) app for AWS Elastic Load Balancing ULM - Classic. You can use the searches and dashboards to track ELB information on the latency, HTTP backend codes, requests, and host status, to investigate issues in the load balancer.
November 21, 2017 (Dashboards)
Bug Fix - Dashboards with the same name now delete properly.
Bug Fix - Drill down metrics name consistent with panel name on dashboard panel.
Bug Fix - Dashboards now display properly, even when tabs are closed.
Bug Fix - Share dashboards with filters option only available when filters are present.
Bug Fix - Clicking the Zoom into Panel option consistently opens a new panel.
November 21, 2017 (Metrics)
Bug Fix - Update dashboard option for metrics charts is fixed.
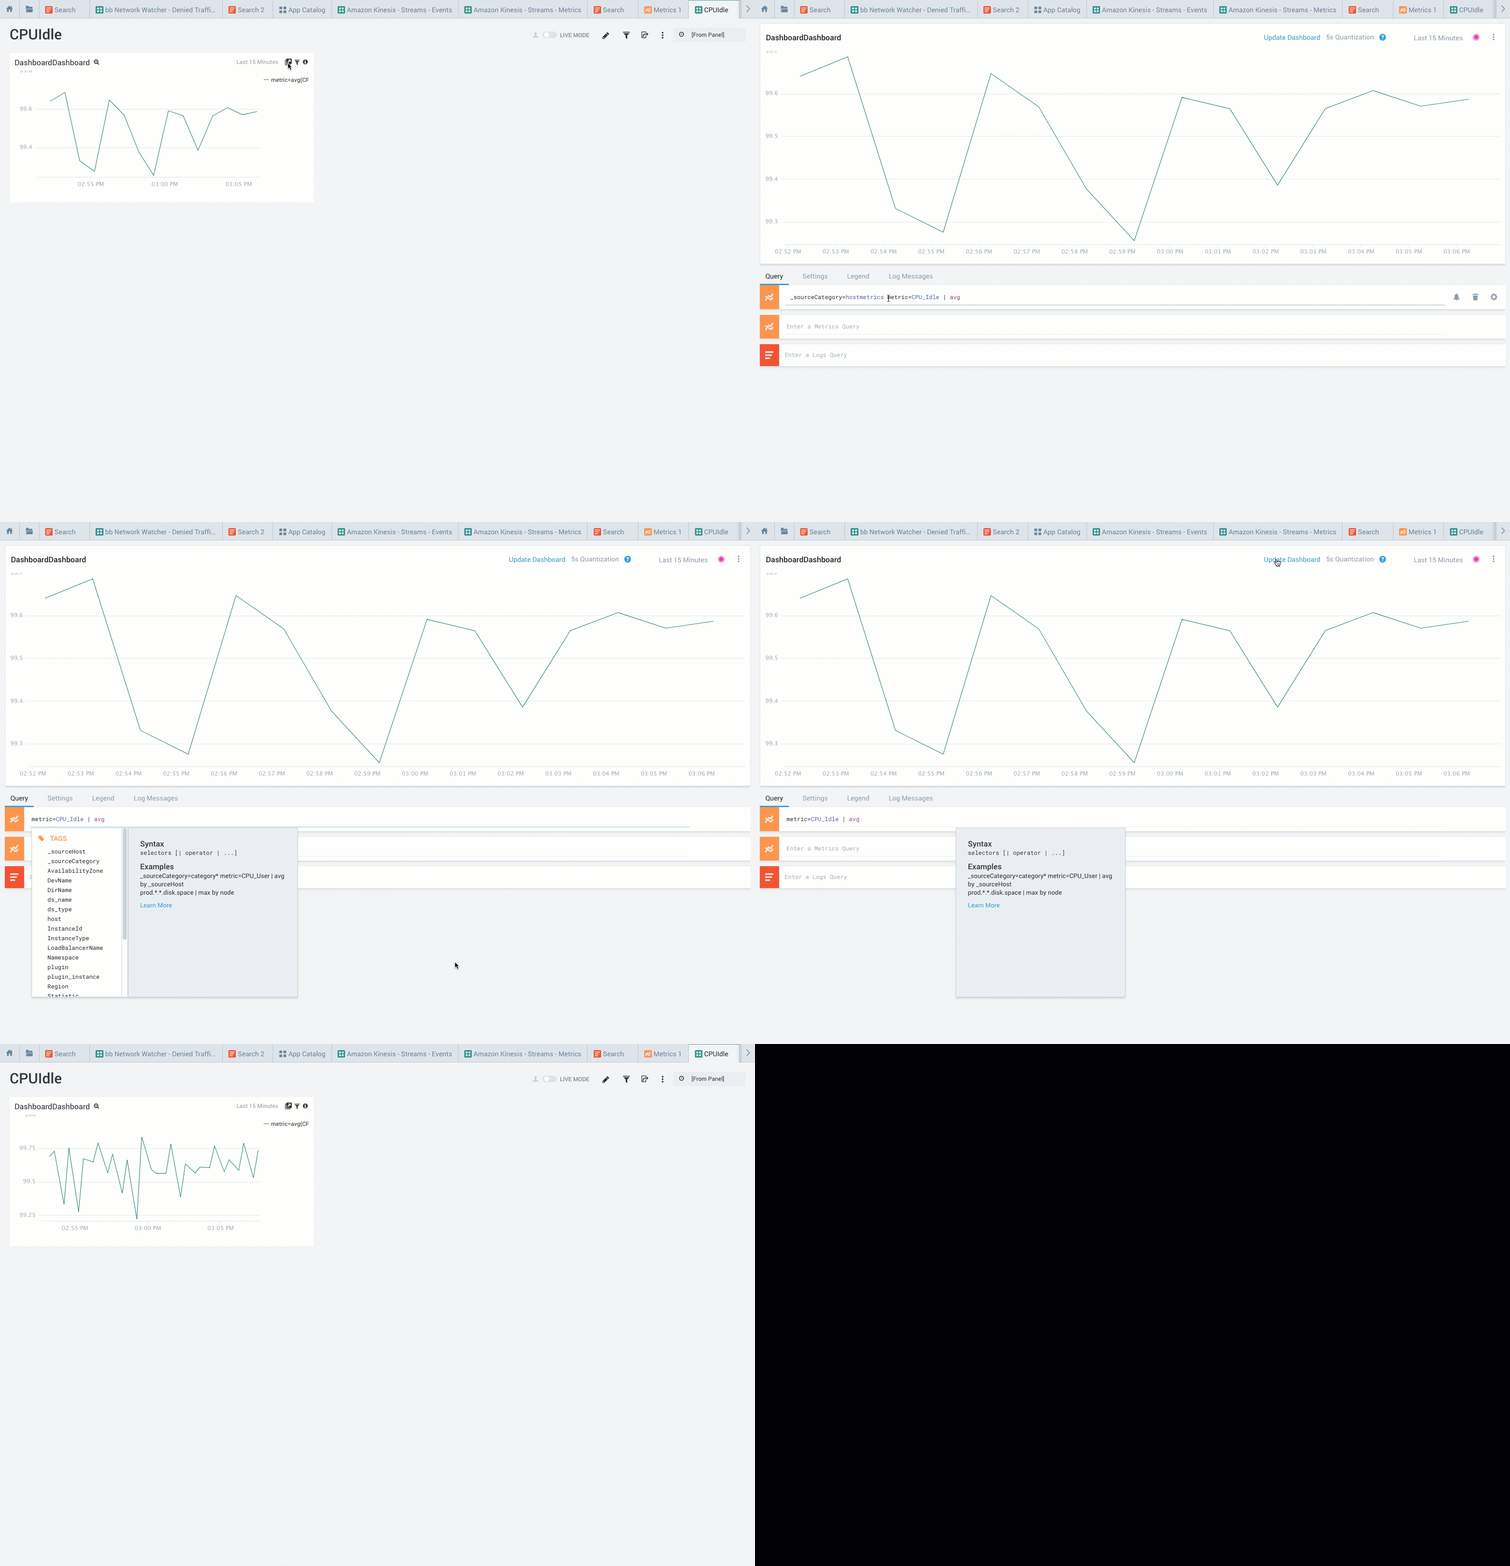
Update - Metrics Introduction now references new UI layout, error messages updated, and revised and improved metrics query performance.
Bug Fix - Aggregate group-by key is no longer case sensitive.
Bug Fix - You now go to the metrics page after clicking "Exit Setup Wizard" if you are working with a metrics source.
Bug Fix - Division by zero not shown in metrics time series to improve visualizations.
Bug Fix - Dashboards shared with“World” now open in incognito mode.
Bug Fix - Removing filter refreshes screen.
November 21, 2017 (Search)
Update - Improved error messages for exporting a search.
November 21, 2017 (User Interface)
Update - Country and states list updated for Activate Your Account.
Bug Fix - SAML sign-in redirects user to correct page on sign-out.
Bug Fix - Show Password Policy only displays when user has Manage password policy capability.
Bug Fix - Appropriate content shows when deleting a user.
Bug Fix - Accounts page is now more exact.
Bug Fix - Multiple tabs can now open during a search.
Bug Fix - Error now shows when you attempt to name a dashboard, search, or folder with an existing name.
Bug Fix - User role creation validates for invalid characters.
November 7, 2017
There is a new app for Amazon Kinesis - Streams, updates to dashboards, new metrics operators, fix to sources, and some user interface changes as part of this update.
November 7, 2017 (Apps)
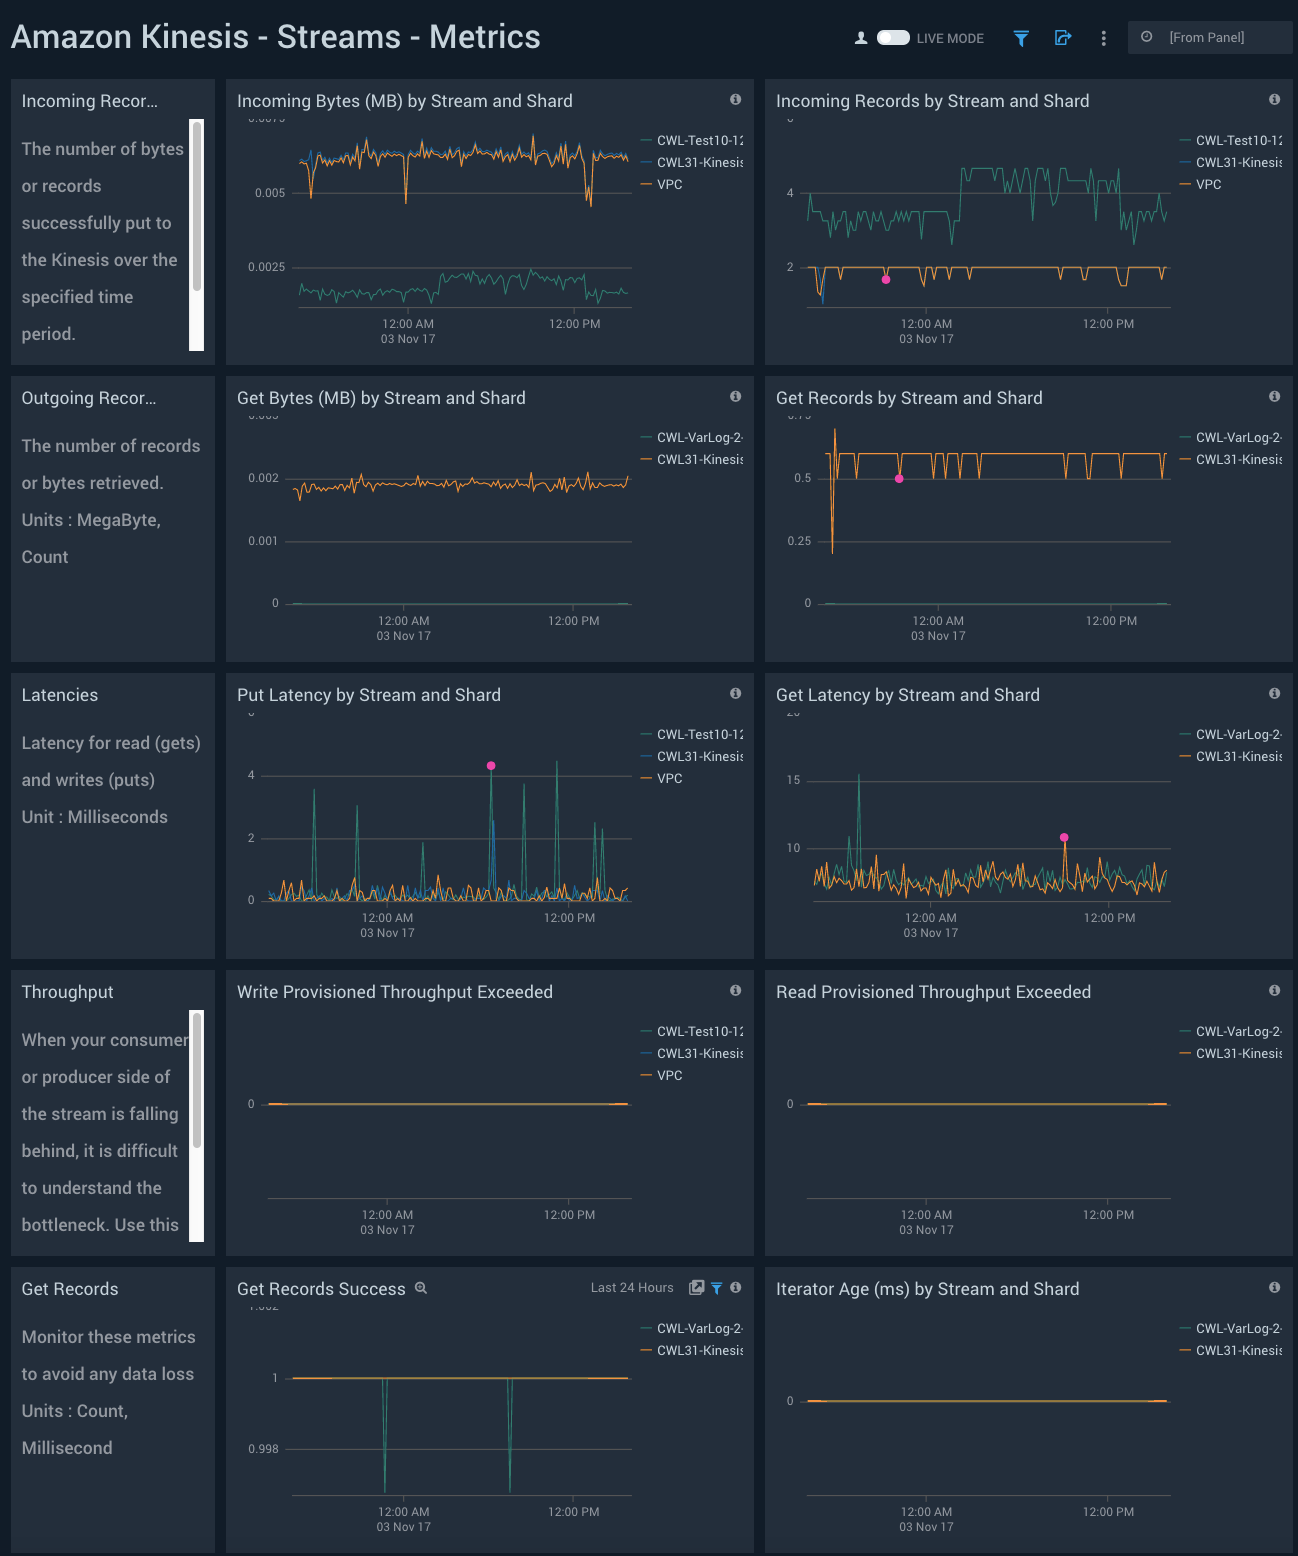
New Beta App - The Sumo Logic App for Amazon Kinesis - Streams is now available for Beta testing. This is a unified logs and metrics (ULM) App which provides information on the events and metrics of Kinesis Streams. The preconfigured dashboards help you monitor the events, API calls, errors, incoming and outgoing records, latencies, and throughput of Kinesis Streams.
November 7, 2017 (Dashboards)
Bug Fix - Dashboard with single panels no longer have display error when adding a new panel.
Bug Fix - Dashboard changes now reflected on sidebar without a hard refresh.
November 7, 2017 (Metrics)
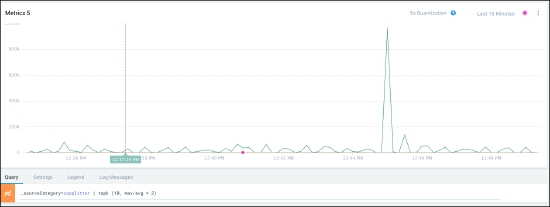
New Operators - New topk, bottomk, and filter operators available filter your metrics query. You can now reduce your time series down and simplify your visuals with these operators. For example, you can find the top 10 time series with the highest average.
Bug Fix - Drill down metrics name is now consistent with monitor name on dashboard panel.
November 7, 2017 (Sources)
Bug Fix - Docker Stats Source error message now displays correctly.
November 7, 2017 (User Interface)
Reminder - Migrate to the new UI as soon as possible. The classic UI will no longer be available after Dec 15.
Enhancement - Asterisk is now shown in the saved search tab to indicate that there are unsaved edits.
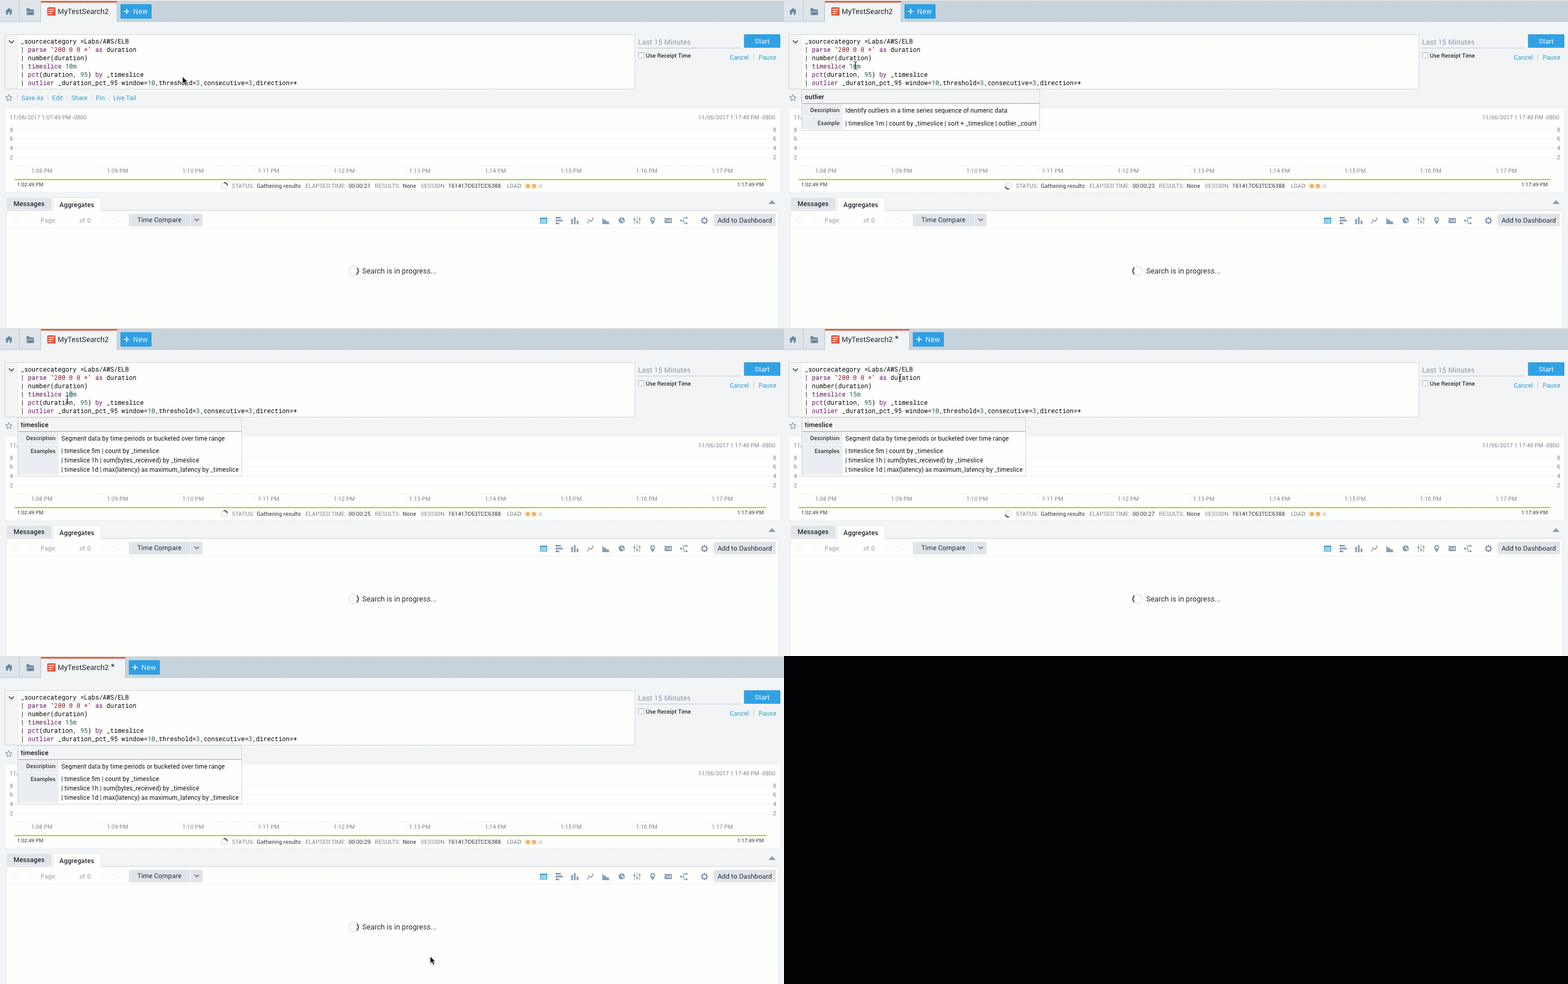
Enhancement - Scrollbar is now wider to make it easier to use. Bug Fix - In-product notification icons now display correctly.
October 31, 2017
Amazon DynamoDB App. The Sumo Logic App for Amazon DynamoDB is now available. This is a unified logs and metrics (ULM) App which provides operational insights into your DynamoDB solution. The App includes Dashboards that allow you to monitor key metrics, view the throttle events, errors, latency, and help you plan the capacity of your DynamoDB solution.
October 27, 2017
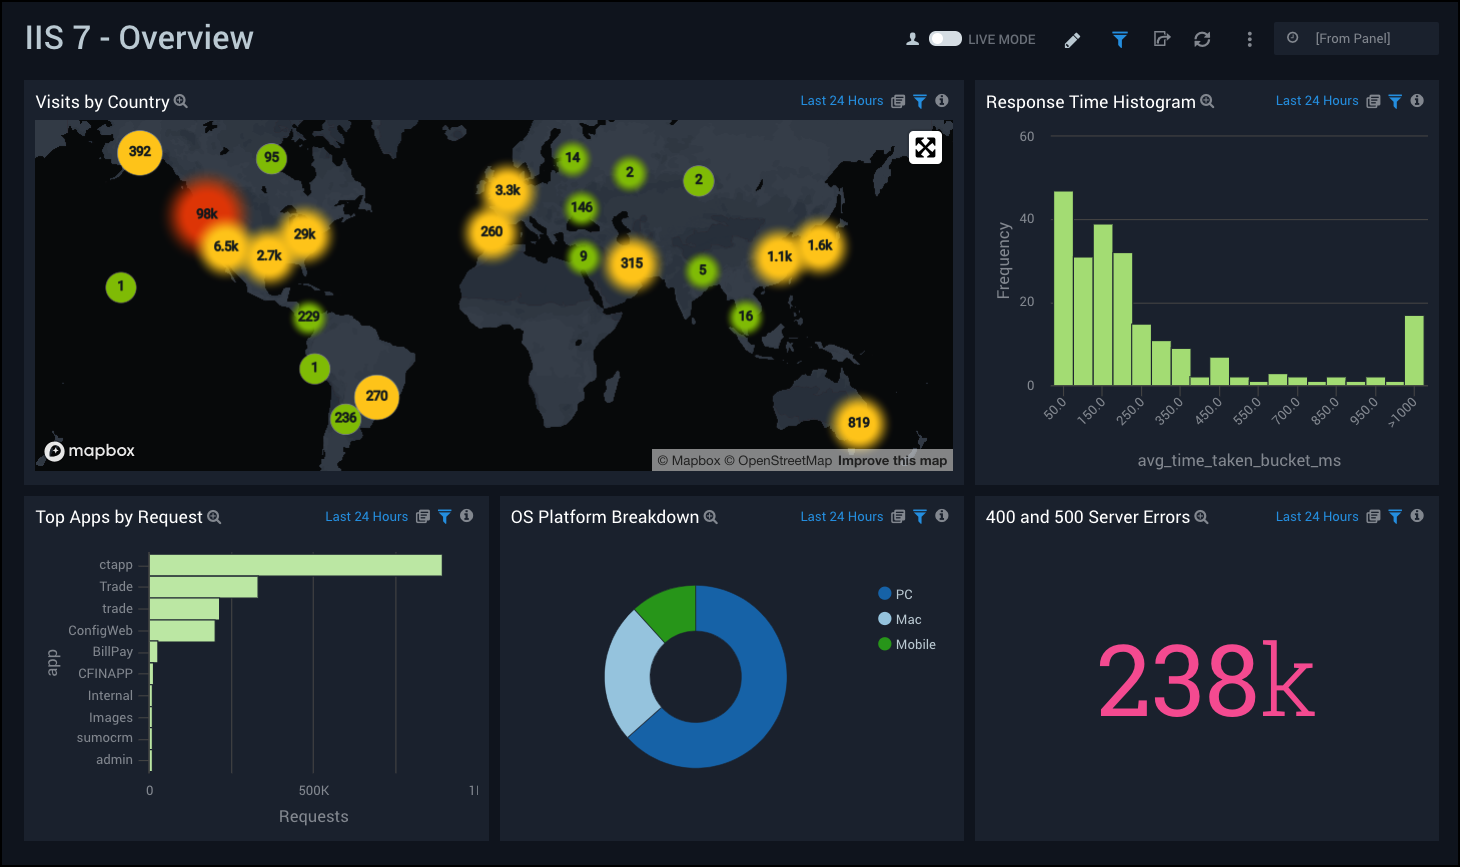
Keyboard shortcuts enhanced. We have expanded the shortcut options for duplicating a query in the new UI. If you used option+shift+n in the classic UI to duplicate a query and time range, you can now use following more specific keyboard shortcuts in the new UI:
| Shortcut | Description |
| alt+shift+n | Duplicate only the current query in new tab. |
| alt+shift+t | Duplicate only the current time range in a new tab. |
| alt+shift+q | Duplicate both the current query and time range in new tab. |
October 17, 2017
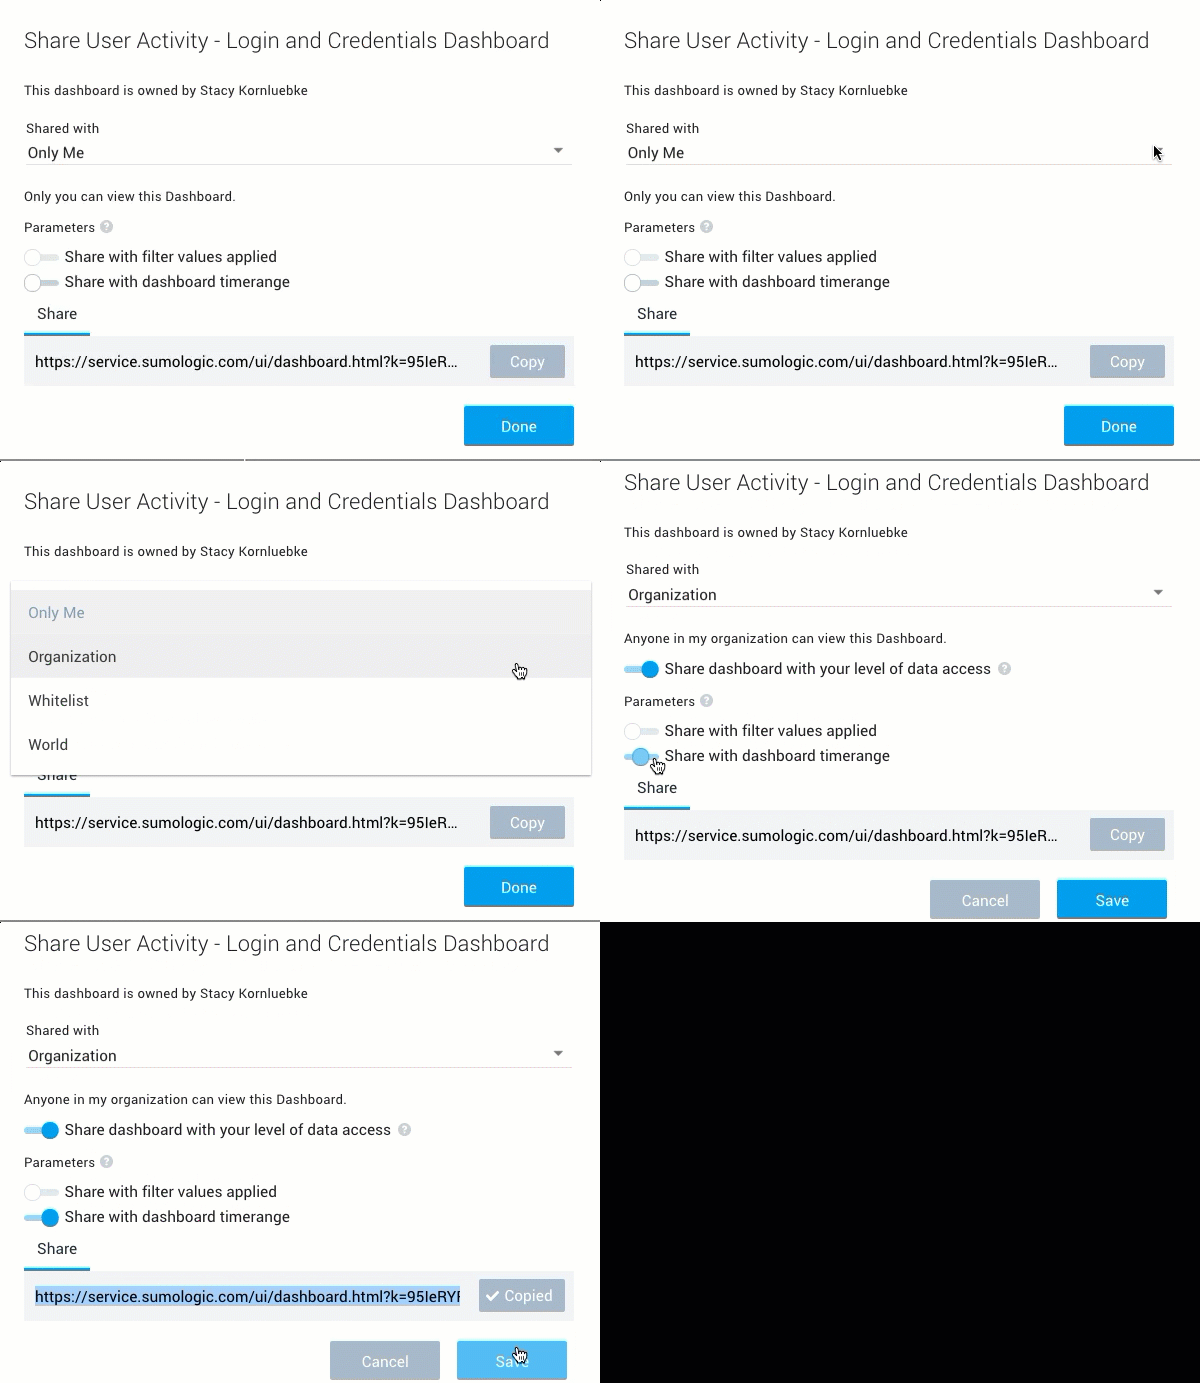
Dashboard sharing enhancements. You can now share a dashboard with static timeranges provided in the URL itself, allowing you to share a snapshot in time of a dashboard with other users. For details, see sharing or embedding a dashboard.
October 13, 2017
Windows Event Log Source Host Change. All Windows Event Logs contain a built-in "Computer" field, which is captured by the Computer = "..."; text you see in the Sumo messages.
Problem. We discovered an issue that caused sourceHost to be assigned incorrectly to a value that didn’t match the Computer field for the event.
Resolution. We have fixed this issue and now assign the Computer = "..."; field as _sourceHost.
Impact: Minimal. If you have queries and scheduled searches for Windows Event Logs that depend on _sourceHost values, you need to verify the change has no impact.
October 10, 2017
AND, OR, and NOT supported in Metrics Queries. Logical operators are now supported in the metrics query language to let you specify complex Boolean expressions for metrics. For example, you can now say nodes not “forge” by stating: !node=forge and you can specify two specific clusters with OR. For more information, see Creating a Metrics Query and Visualization.
September 18, 2017
Sumo Kubernetes Fluentd plugin. You can use the plugin to collect system, kubelet, Docker daemon, and container logs from Kubernetes. For more information, see Kubernetes.
September 14, 2017
Metrics alerting enhancements. You can now set alerts on Metrics JOIN queries. For example, if you have a query to calculate a baseline in comparison to today's network traffic:
- Choose your metric for CPU usage by application and the source hosts you want to track:
metric=CPU_user _sourceHost=my_host - Take an average of that metric.
metric=CPU_user _sourceHost=my_host | avg - See differences between your metric and your average.
(#A - #B)/#B
- Create an alert to let you know when that those differences reach a particular range.
September 12, 2017
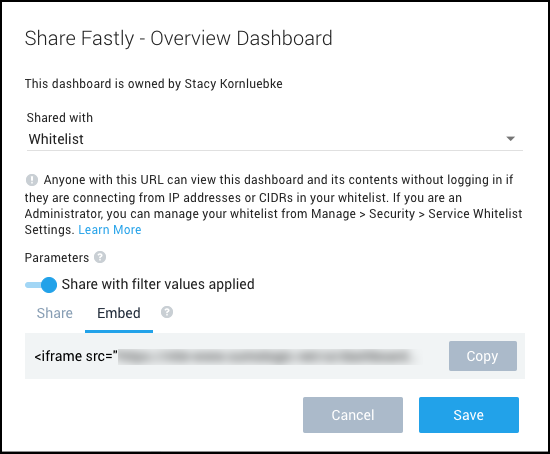
Dashboard sharing enhancements. You can now share a dashboard with specific filters provided through the URL itself. You can also embed a dashboard in an external website as an iFrame. For more information, see the section on sharing or embedding a Dashboard.
September 11, 2017
Azure Audit. The Sumo Logic App for Azure Audit is now updated to include the Activity Logs from Event Hub, along with the existing collection from Azure Insight API using Sumo Powershell scripts. For more details, see collect logs for Azure Audit from Event Hub. All the pre-configured dashboards in the App, except the Azure Audit - Active Directory dashboard, support logs from both Event Hub and Insight API. This update also includes minor bug fixes and query optimization.
September 1, 2017
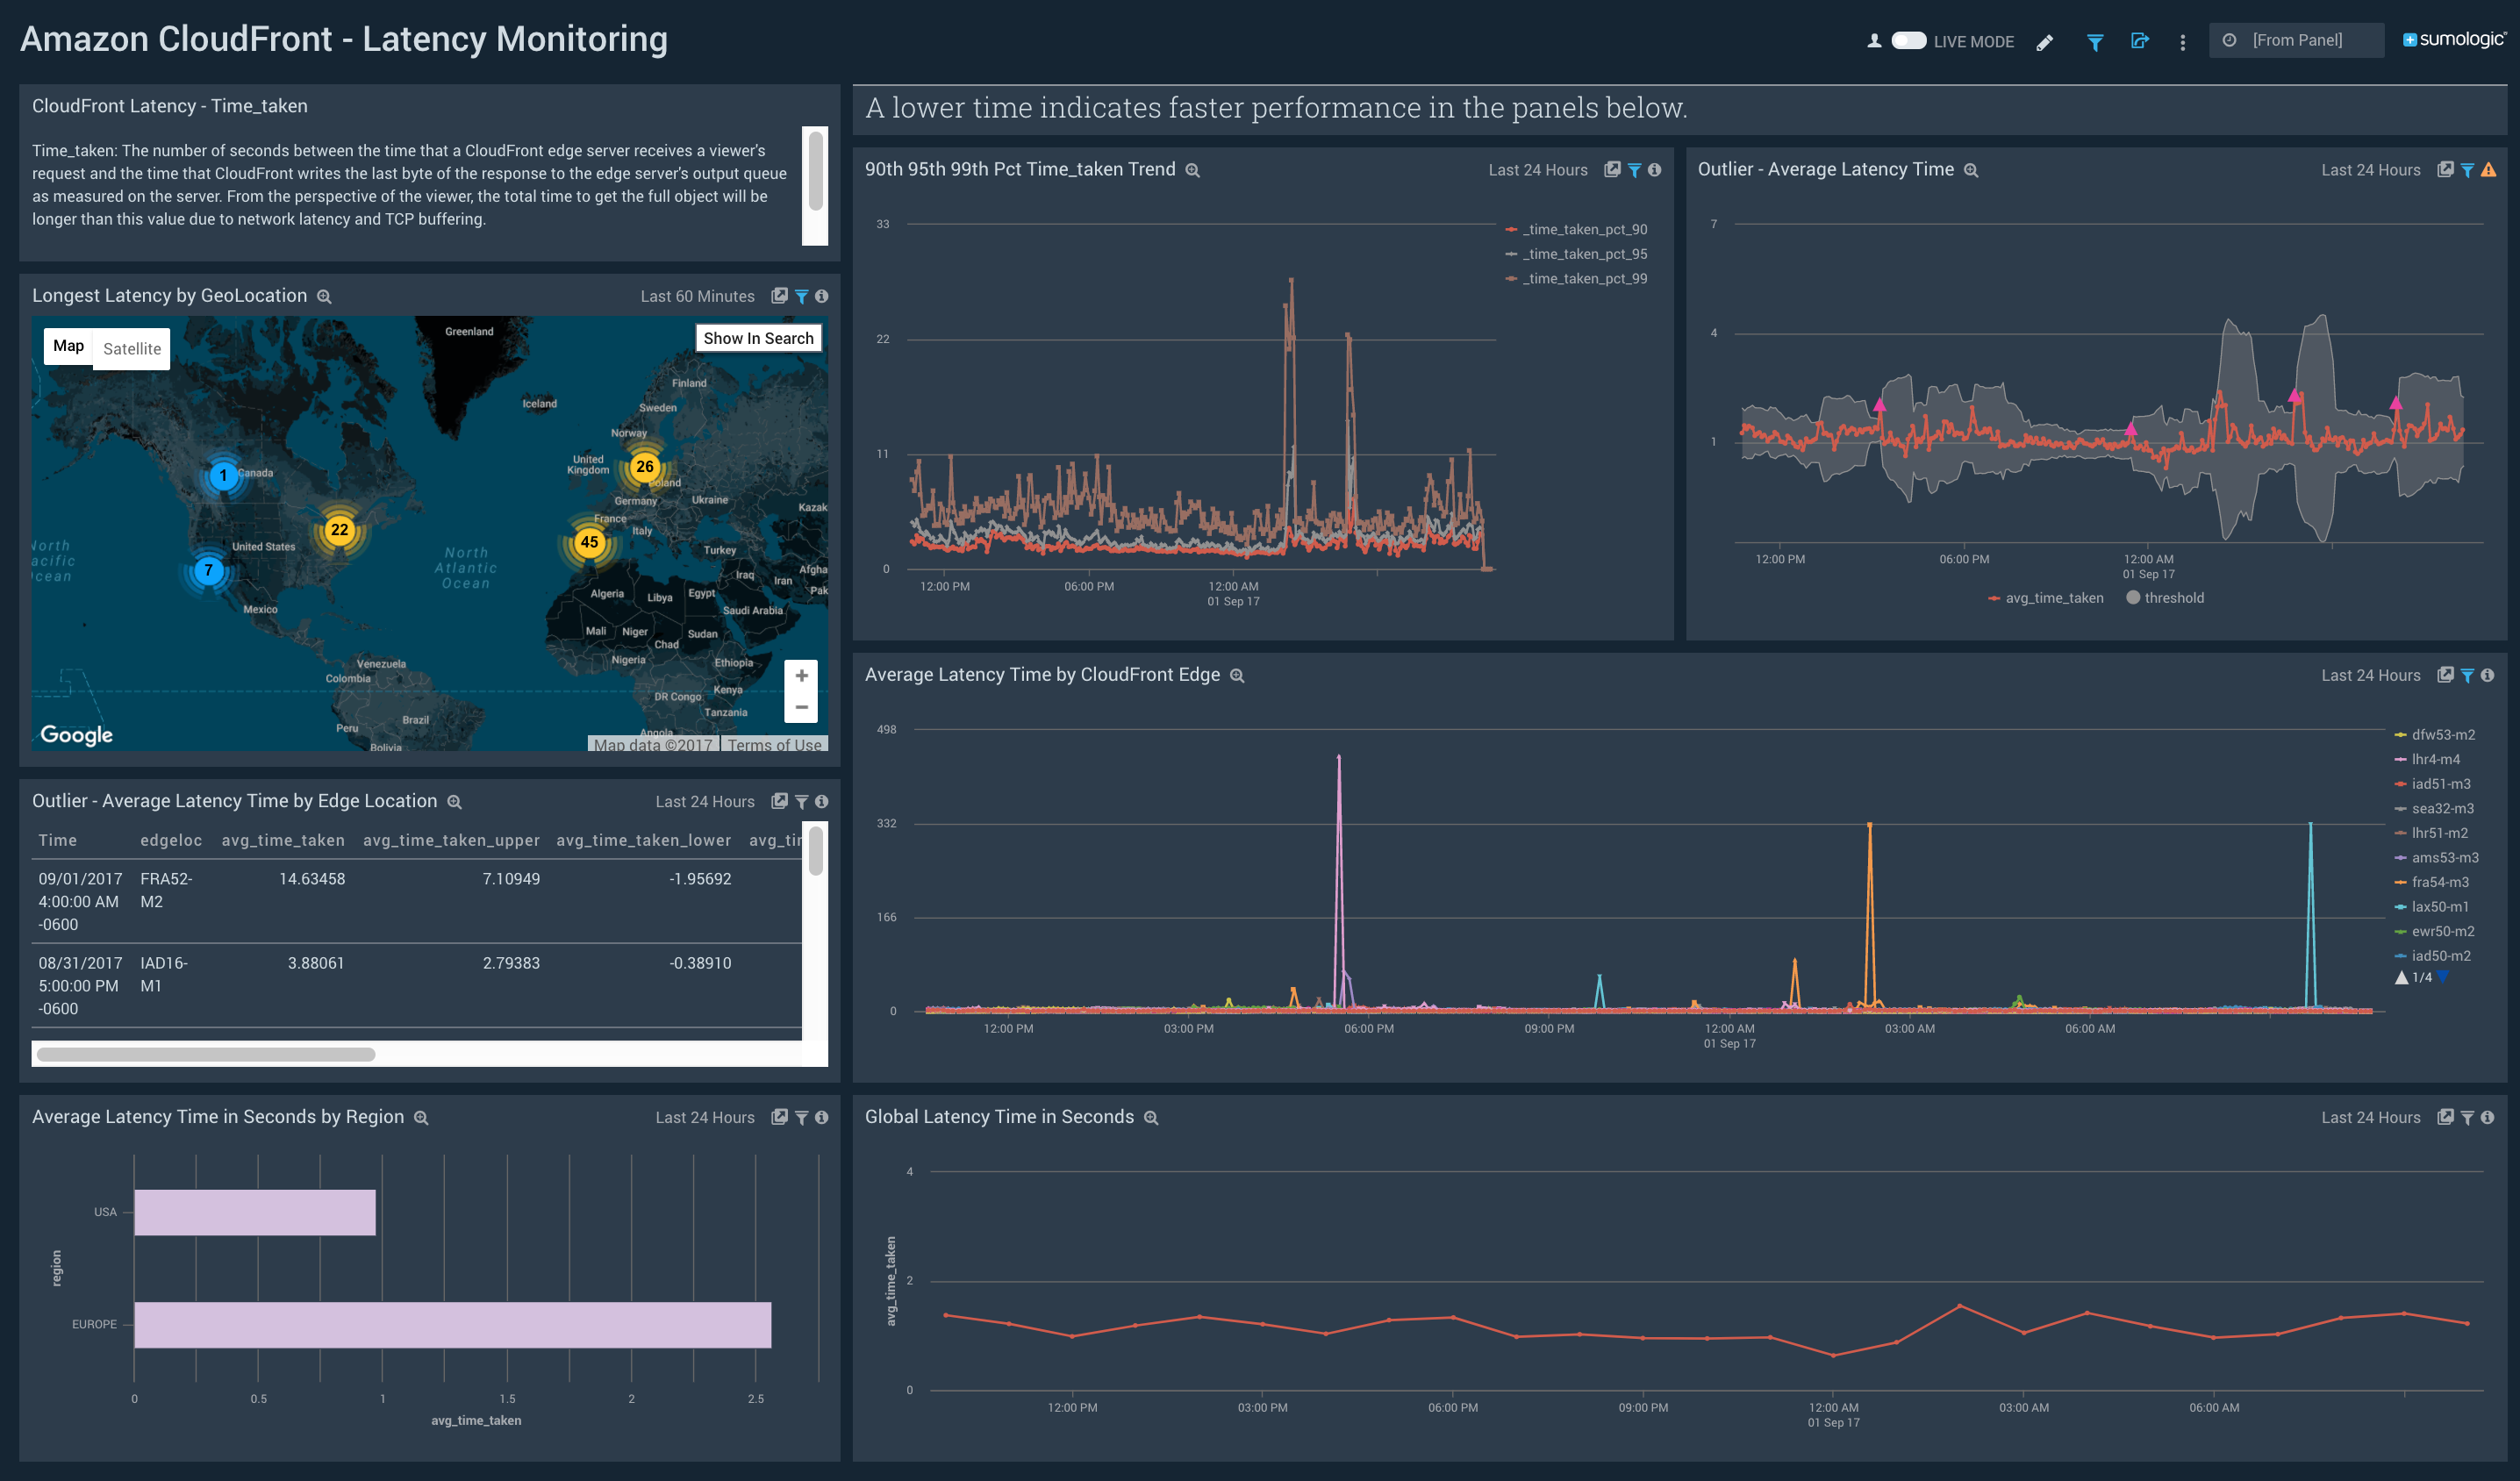
Amazon CloudFront. The Sumo Logic App for Amazon CloudFront is now updated to include the Latency Monitoring dashboard. You can use this dashboard to monitor the Latency time, locations, trend, and outlier.
August 29, 2017
Google Cloud Platform Source. Google Cloud Platform (GCP) is now available as a data source. If you are using GCP services, all log data for these services is collected and exposed through the Google Cloud Stackdriver service. You can export in real time all of the data collected by Stackdriver to Google Cloud Pub/Sub. We use this Pub/Sub integration to push logs to our platform in real time.
Salesforce. The Sumo Logic App for Salesforce is now updated. The queries are optimized for better performance, and minor defects are fixed. This update has no impact on the dashboard panels.
Apps generally available. We are proud to announce that the Sumo Logic Apps for Cylance, Zscaler - Web Security, Auth0, CrowdStrike - Falcon Platform, and Amazon Inspector are out of Beta and are now generally available.
August 22, 2017
parseDate Released. A new operator, parseDate, extracts a date or time from a string and converts it to an epoch timestamp. For more information, see parseDate.
August 18, 2017
Real-time threat assessment. Threat Intel Quick Analysis and Threat Intel for AWS apps now support using Continuous Queries (CQs) for scanning for malicious Indicators of Compromise (IOCs) in real time using the lookup operator.
August 15, 2017
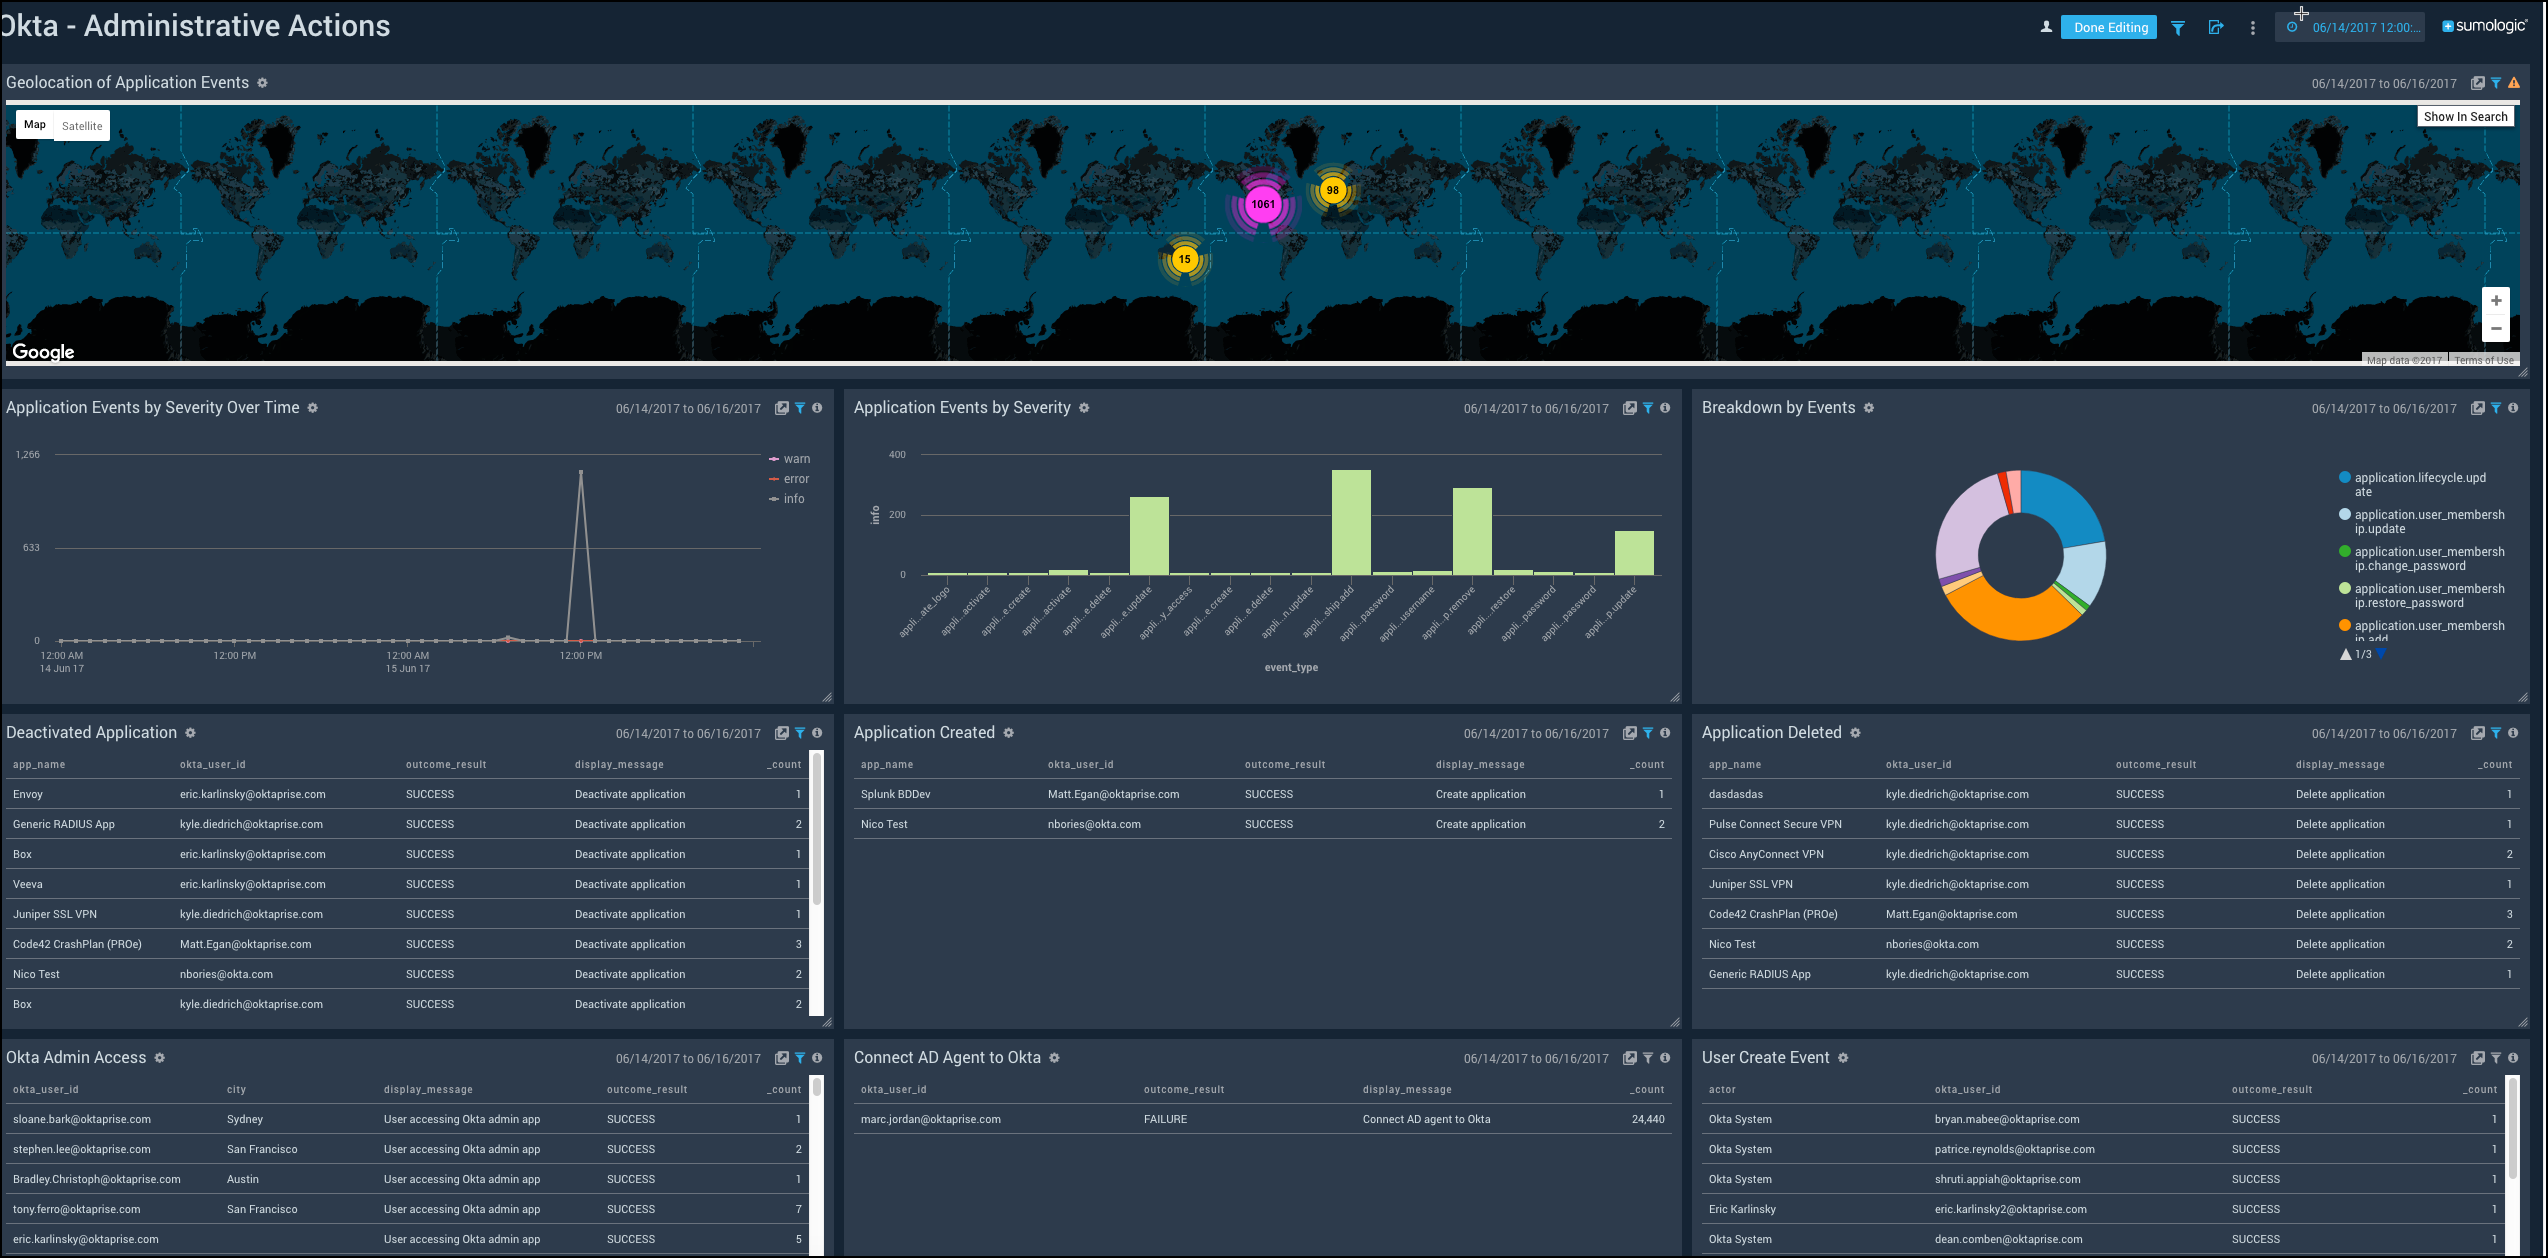
Okta App. The Sumo Logic App for Okta is now available. This app helps you monitor the admin actions, failed logins, successful logins, and user activities to your applications through Okta. The App consists of dashboards that give you visibility into the applications, accesses, user events, and Multi-Factor Authentication (MFA).
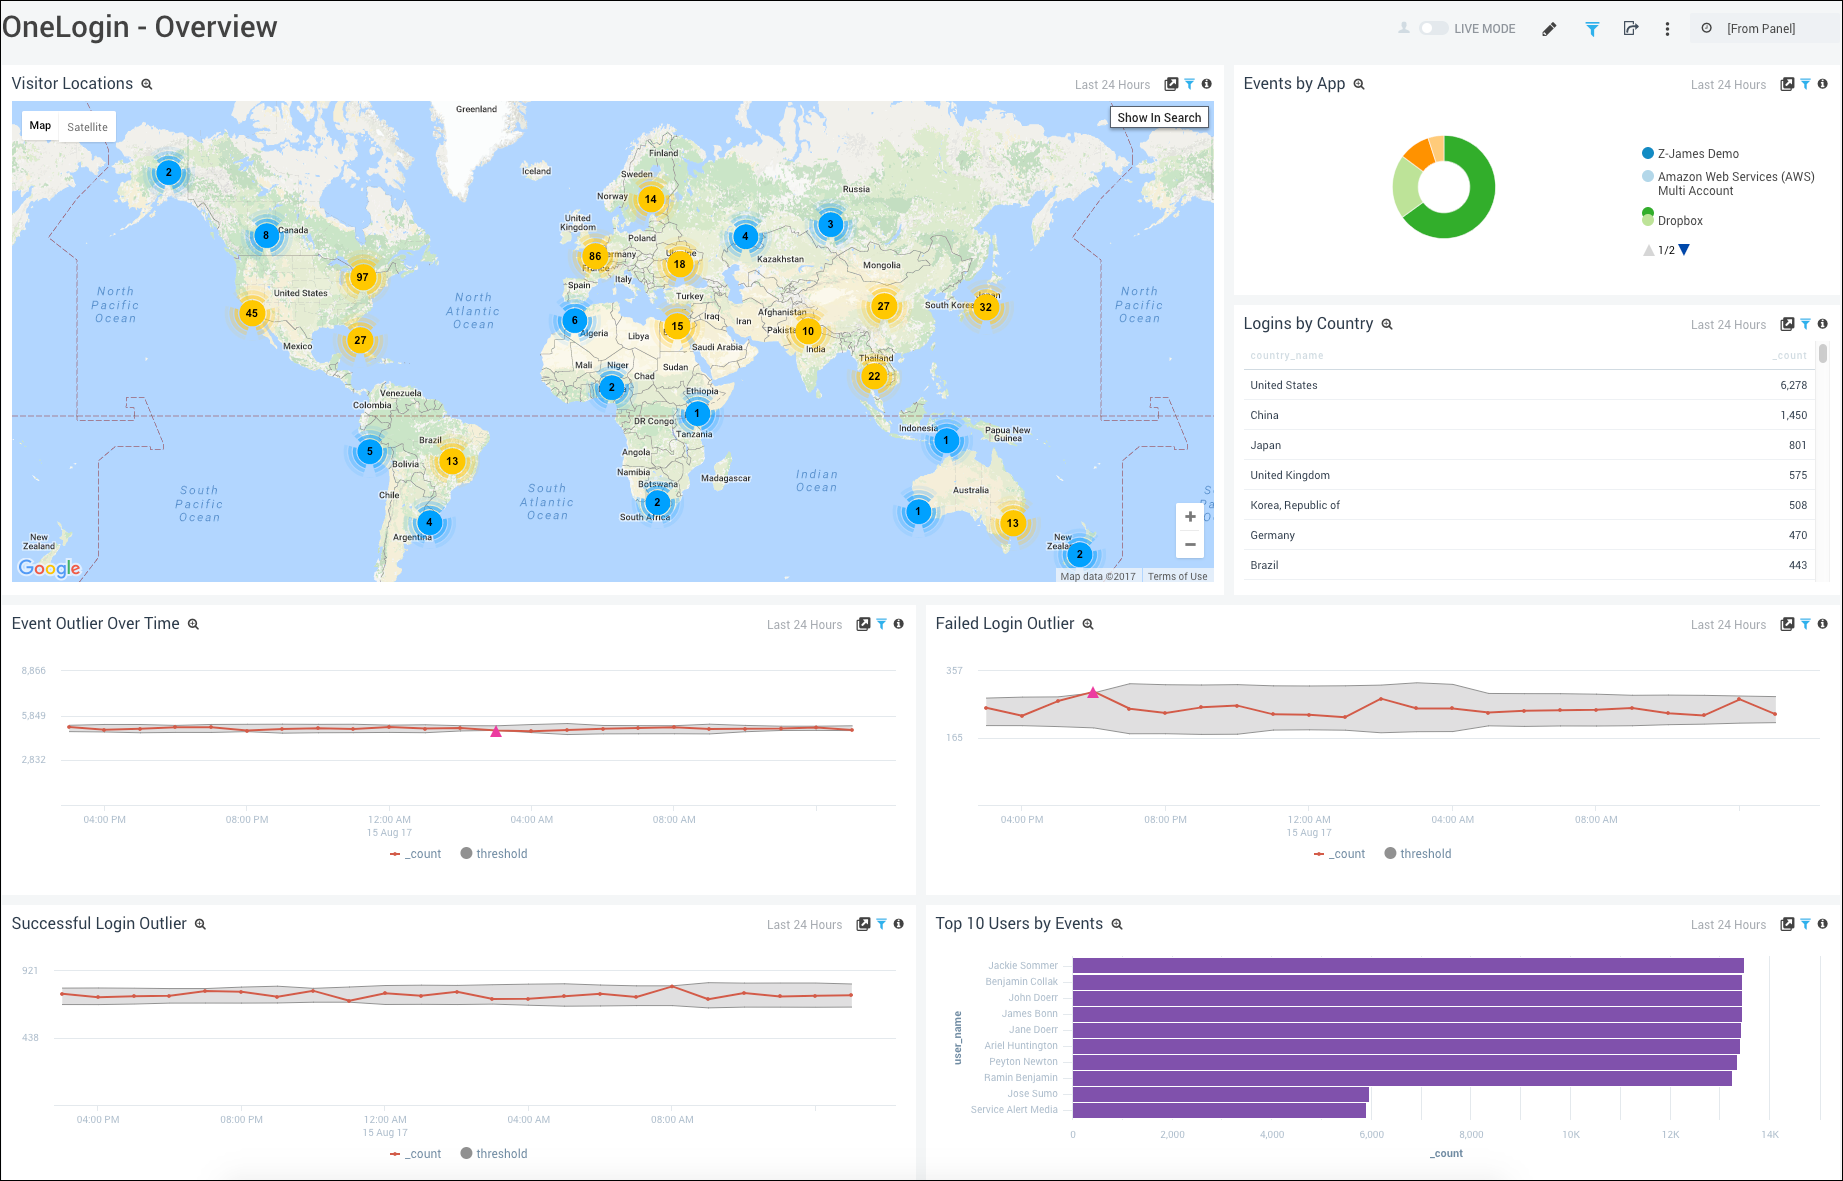
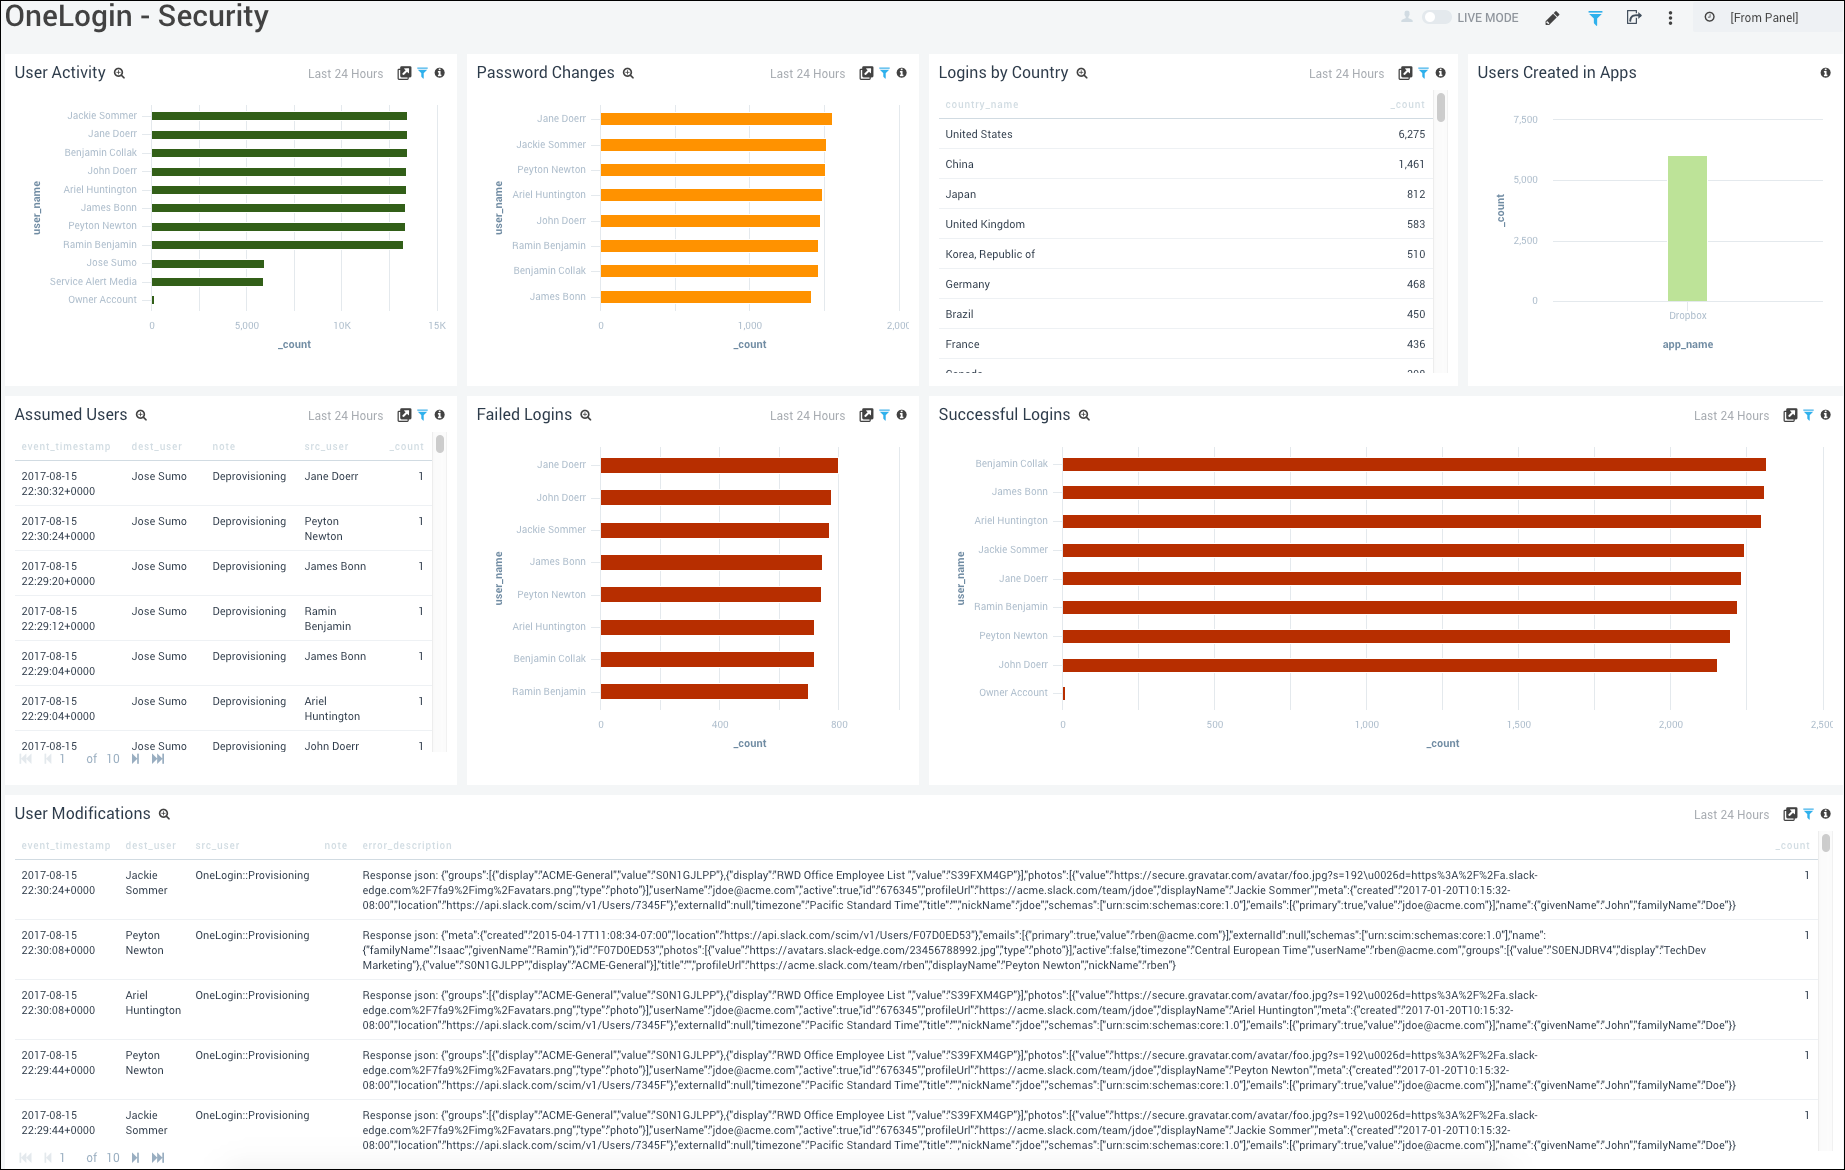
OneLoginApp Dashboards. The dashboards of Sumo Logic App for OneLogin are now updated. This update offers Successful Login Outlier panel in the Overview dashboard, and Successful Logins panel in the Security dashboard.
Apps generally available. We are happy to announce that the Sumo Logic Apps for Amazon RDS Metrics, CIS AWS Benchmark - Monitoring, Amazon ECS), AWS Elastic Load Balancer - Application are out of Beta and are now generally available.
July 24, 2017
eval metrics operator. The eval operator evaluates a time series based on a user-specified math expression. For more information, see Metrics Operators.
Numeric literals and supported multiplier suffixes. A number, or numeric literal, in the Sumo Query language is a set of digits containing no spaces, with an optional decimal point. Numeric literals can end with a "multiplier suffix," which is a shorthand way to express scalar numeric values multiplied by common factors. For more information on supported multiplier suffixes for numeric literals, see Field Expressions.
July 17, 2017
Custom labels for metrics time series. The default label for time series is a comma-separated list of the dimensions included in the query. The resulting labels can be lengthy and inconvenient to scan. To shorten the labels and make them more meaningful in your metrics visualizations and in dashboards, you can apply a naming convention for custom time series labels on a per-query basis. The labels can include text and also parameters that are enclosed in double curly braces.
July 9, 2017
The ability to save LogReduce results to a baseline has been deprecated.
June 29, 2017
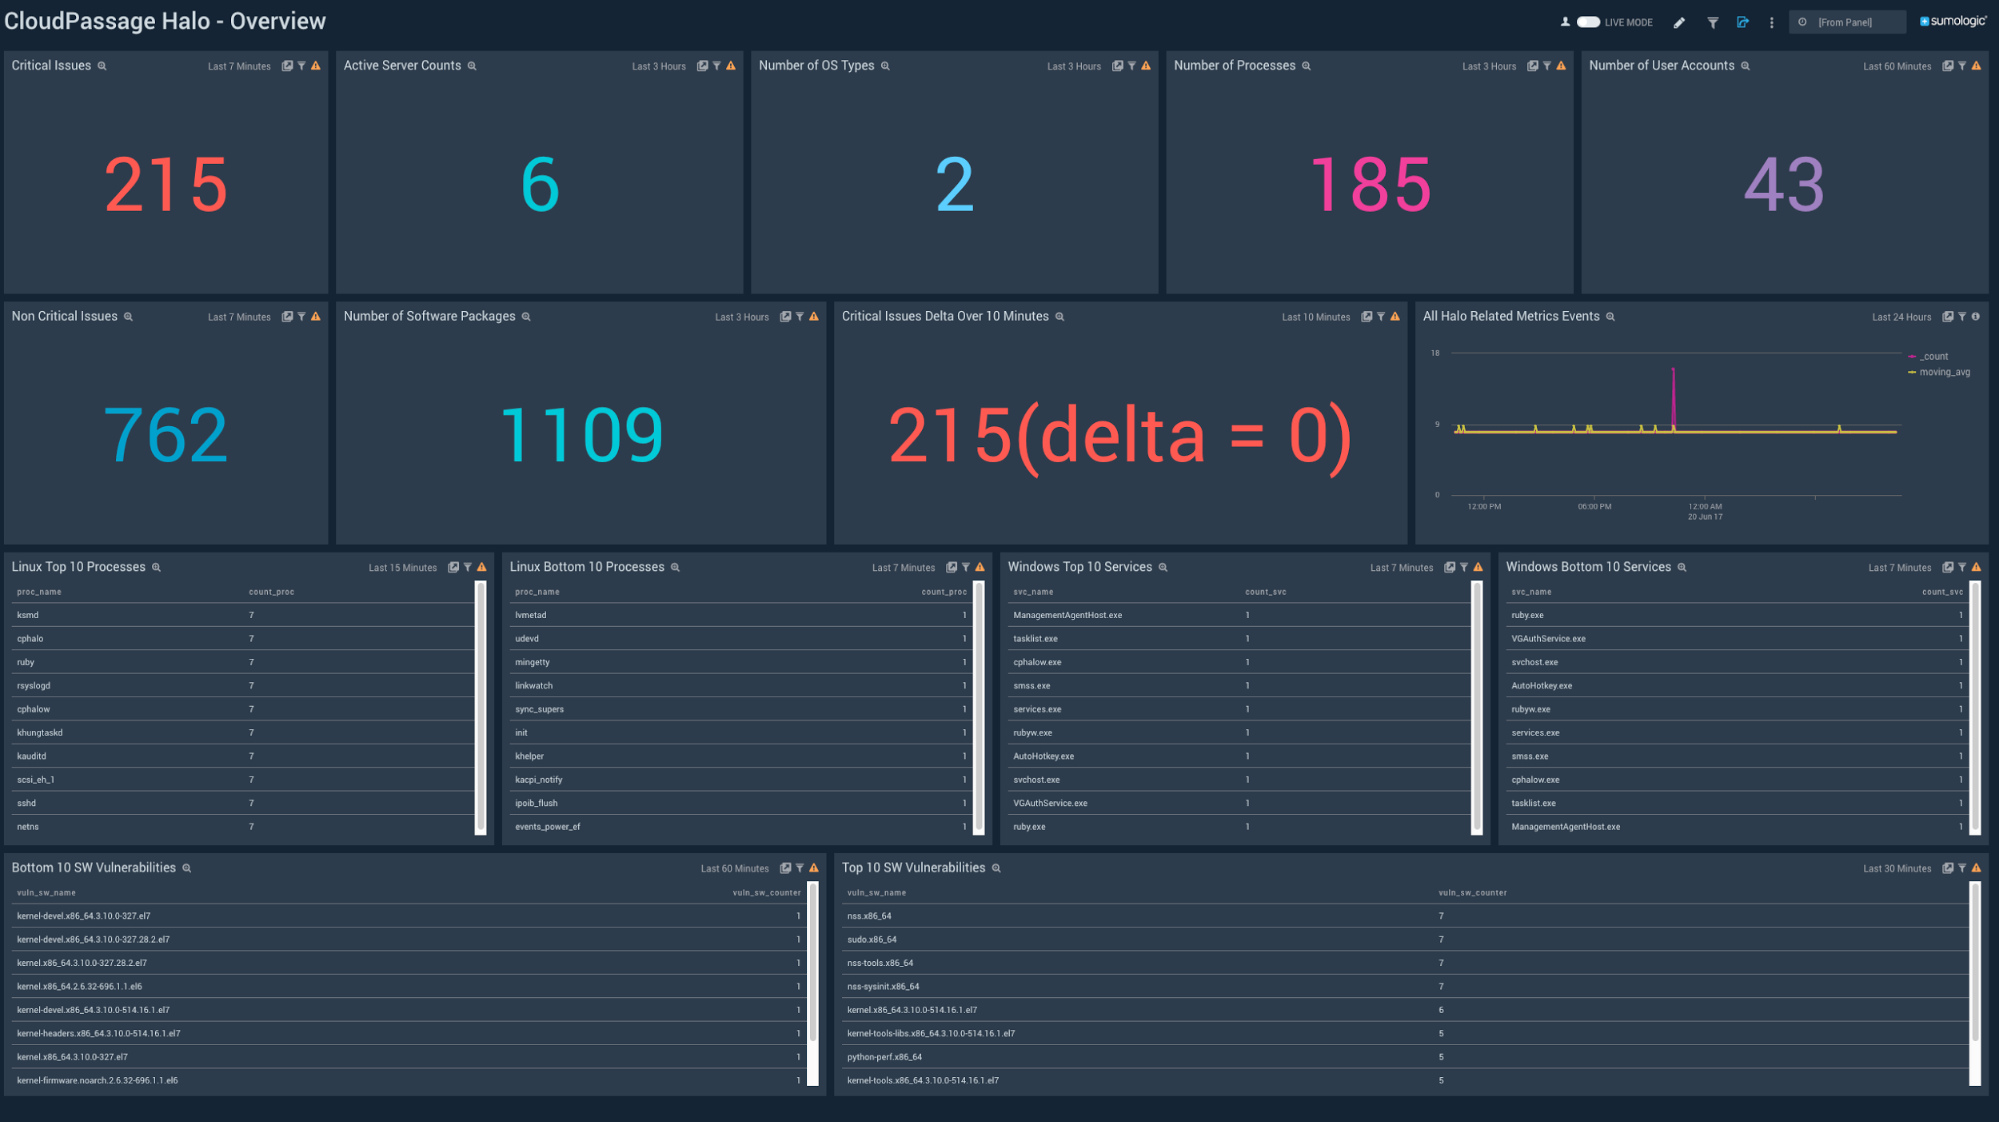
CloudPassage Halo App. The Sumo Logic App for CloudPassage Halo is now available. This app helps you detect security violations and look for threats across your complex infrastructure, through the analysis of massive volumes of Halo event data. CloudPassage’s Halo platform records over eighty different types of security events about your Halo-managed infrastructure, whether you deploy into public cloud environments or your private data center. These events deliver information about your infrastructure and include critical security alerts for firewall changes, access changes, configuration changes, and file integrity changes, and more.
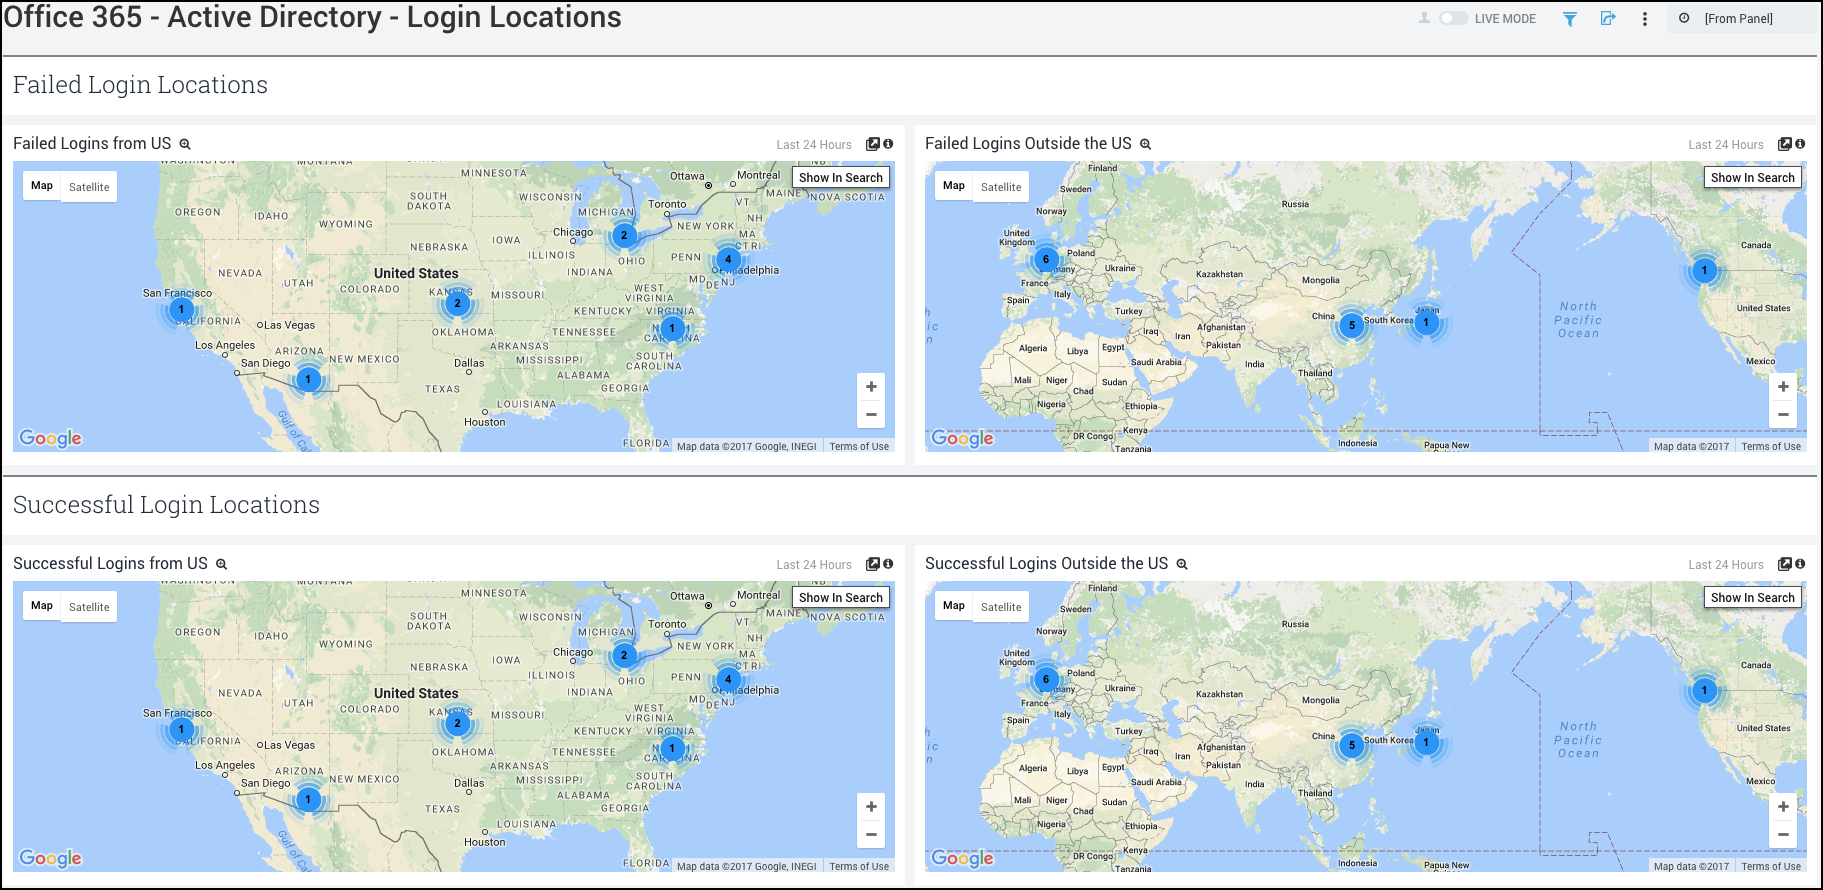
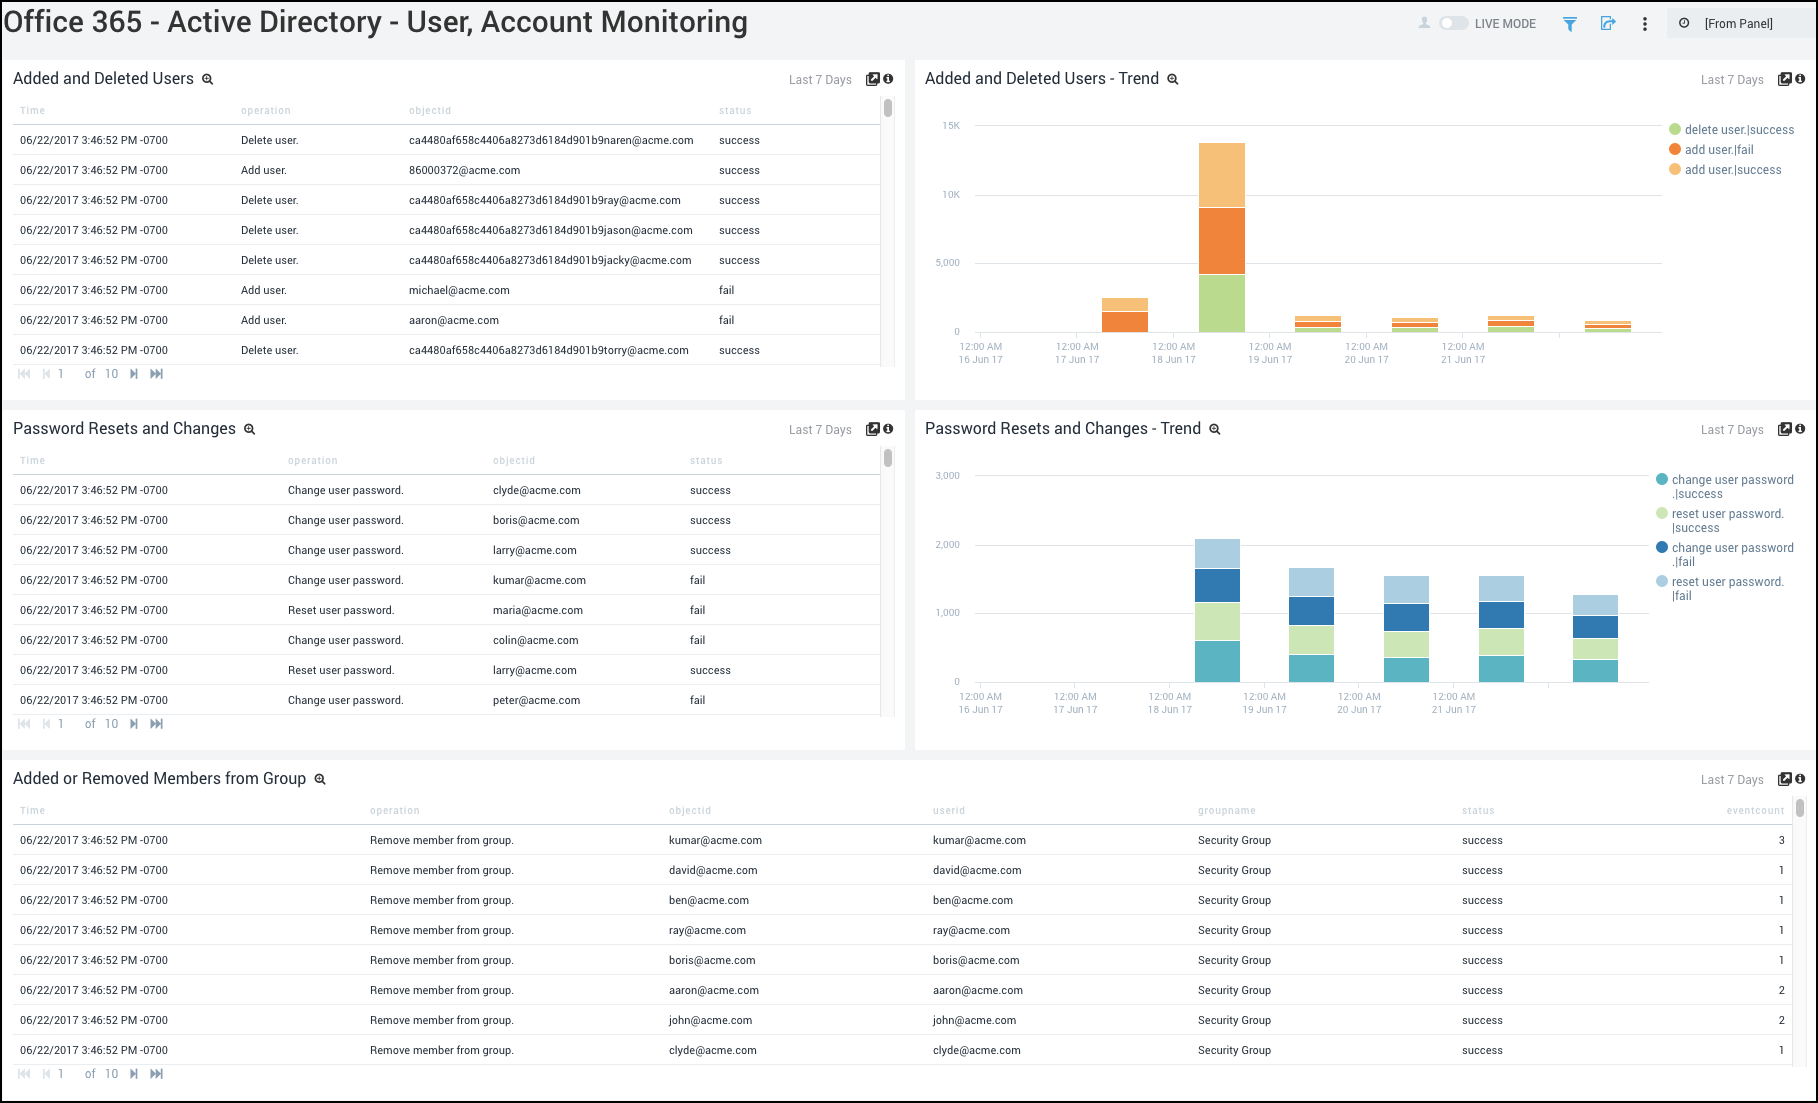
Microsoft Office 365 App Dashboards. The Sumo Logic App for Microsoft Office 365 App Dashboards is now updated. This update offers new dashboards for Azure Active Directory to help you monitor logins, login locations, and for user and account monitoring.
June 23, 2017
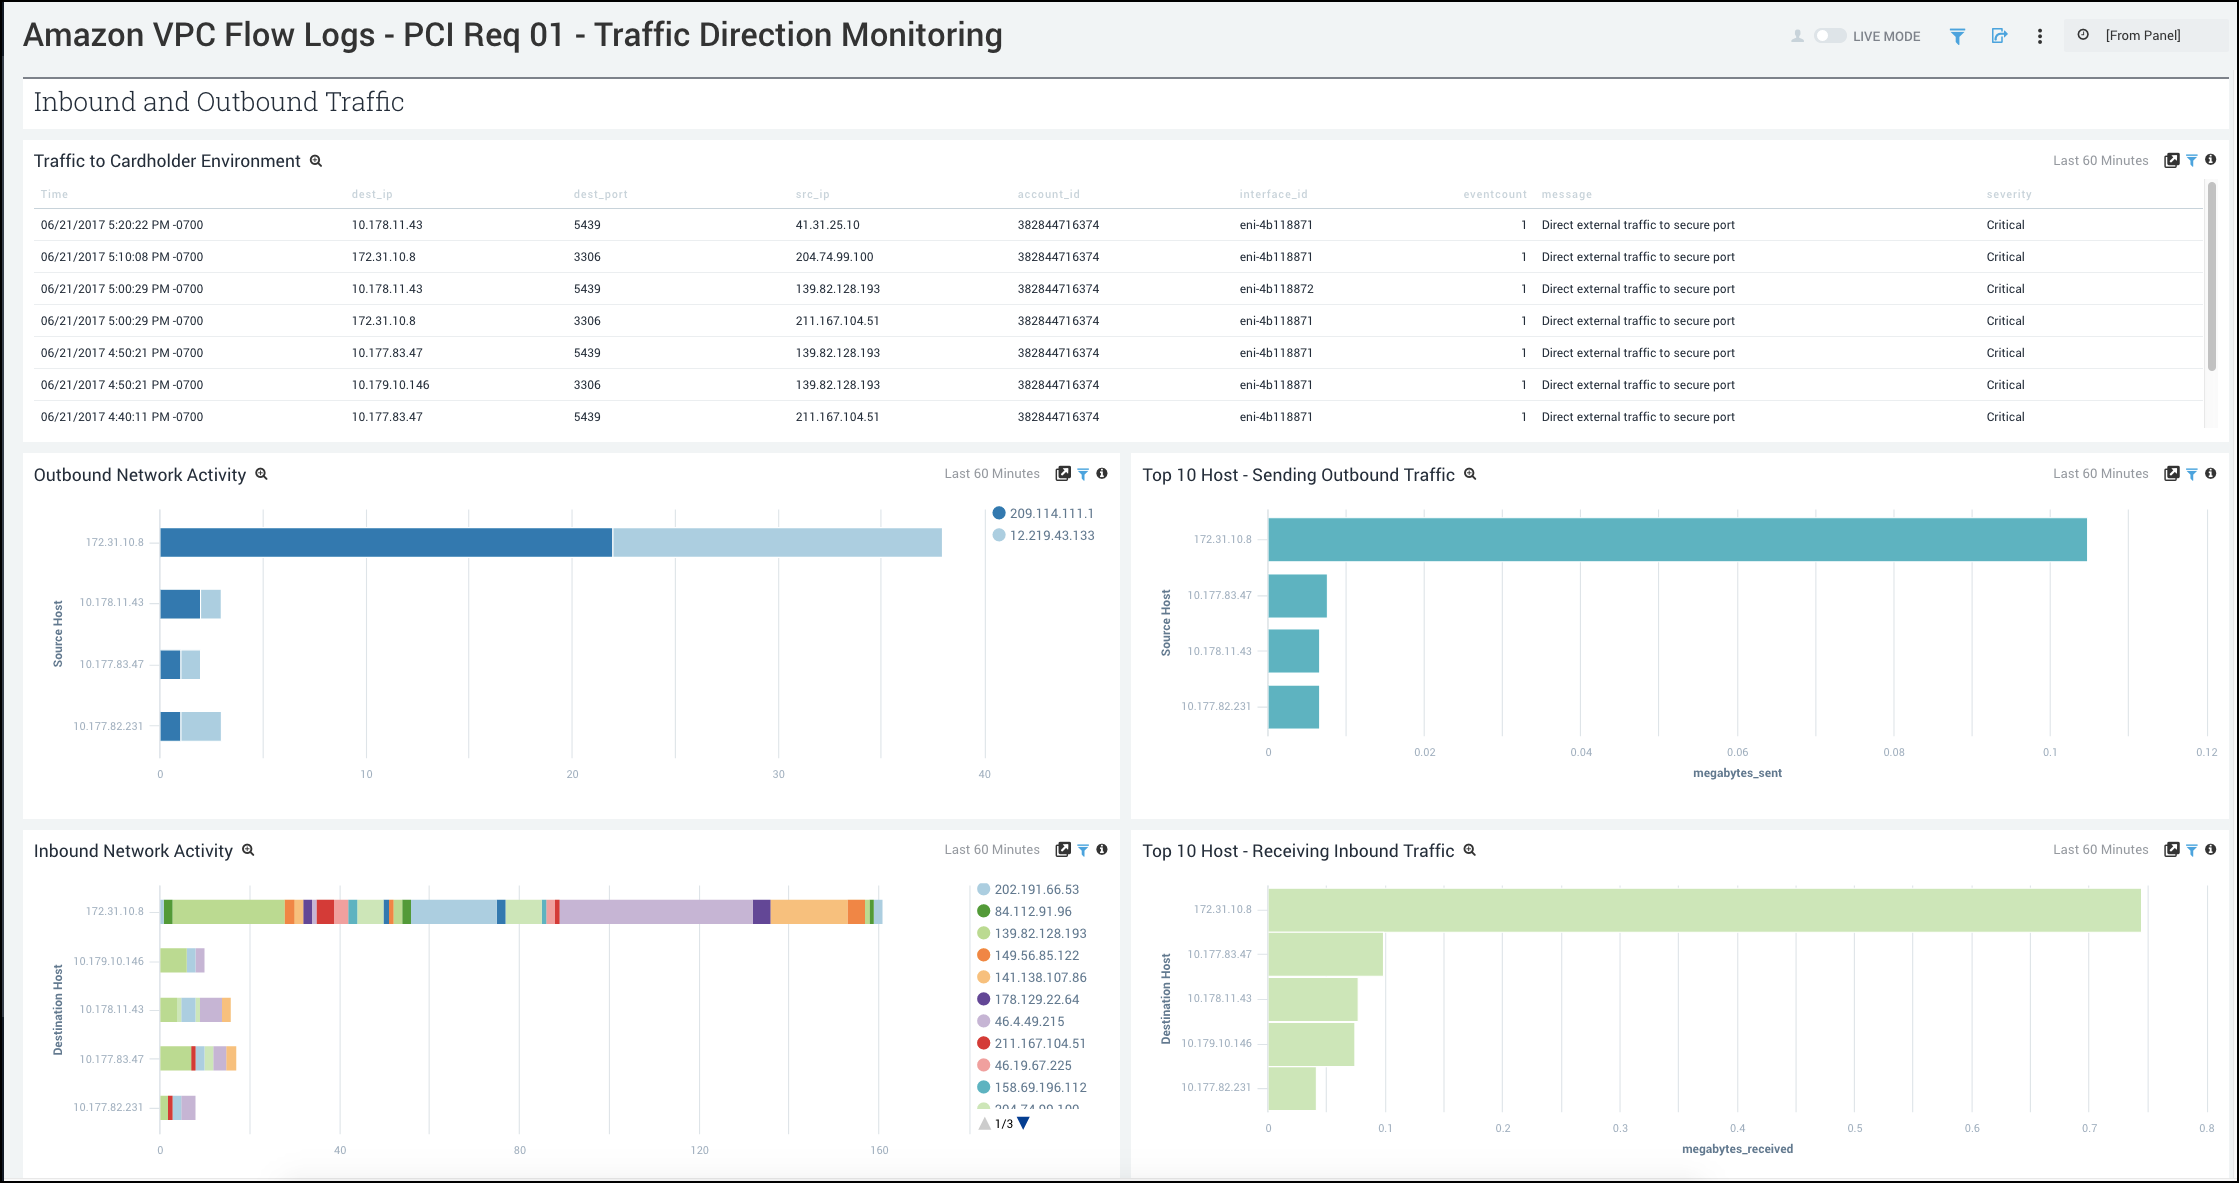
PCI Compliance for Amazon VPC Flow Log App. The Sumo Logic App for Payment Card Industry (PCI) Compliance for Amazon VPC Flow App is now available. This app offers dashboards to help you monitor that network traffic, network activities, and network security are within your expected ranges. The PCI Compliance for Amazon VPC Flow App covers PCI requirements 01, 02 and 04.
June 21, 2017
Non-aggregate query speedup. The histogram rendering time is reduced, charting your messages faster.
Removal of 100k pause. Non-aggregate queries are no longer limited to 100k messages at a time.
Be aware of the following changes that come with these enhancements:
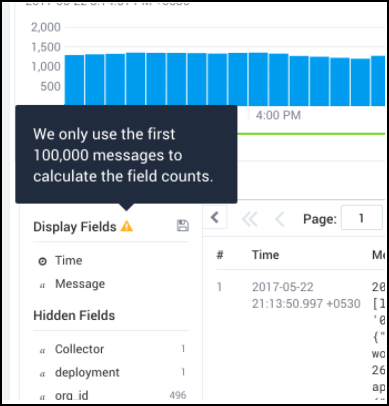
- Field counts still cap at 100k messages. When the message count reaches more than 100k, you will see a message: “We only use the first 100,000 messages to calculate the field counts.”
- Field counts may still be loading. Field counts load asynchronously, and may still be loading after the histogram renders.
- Receipt time still has 100k pause. If your search uses receipt time, you will still see the 100k message limit.
- Oldest message sorts first when you reach 100k messages. Although you can have more than 100k messages in the histogram, the oldest message that will be shown is the 100k message. To get around this issue and see the range you want on the histogram, you can: Reduce the timerange and return the search. Shift+click on the histogram bar to drilldown into a specific timerange.
June 19, 2017
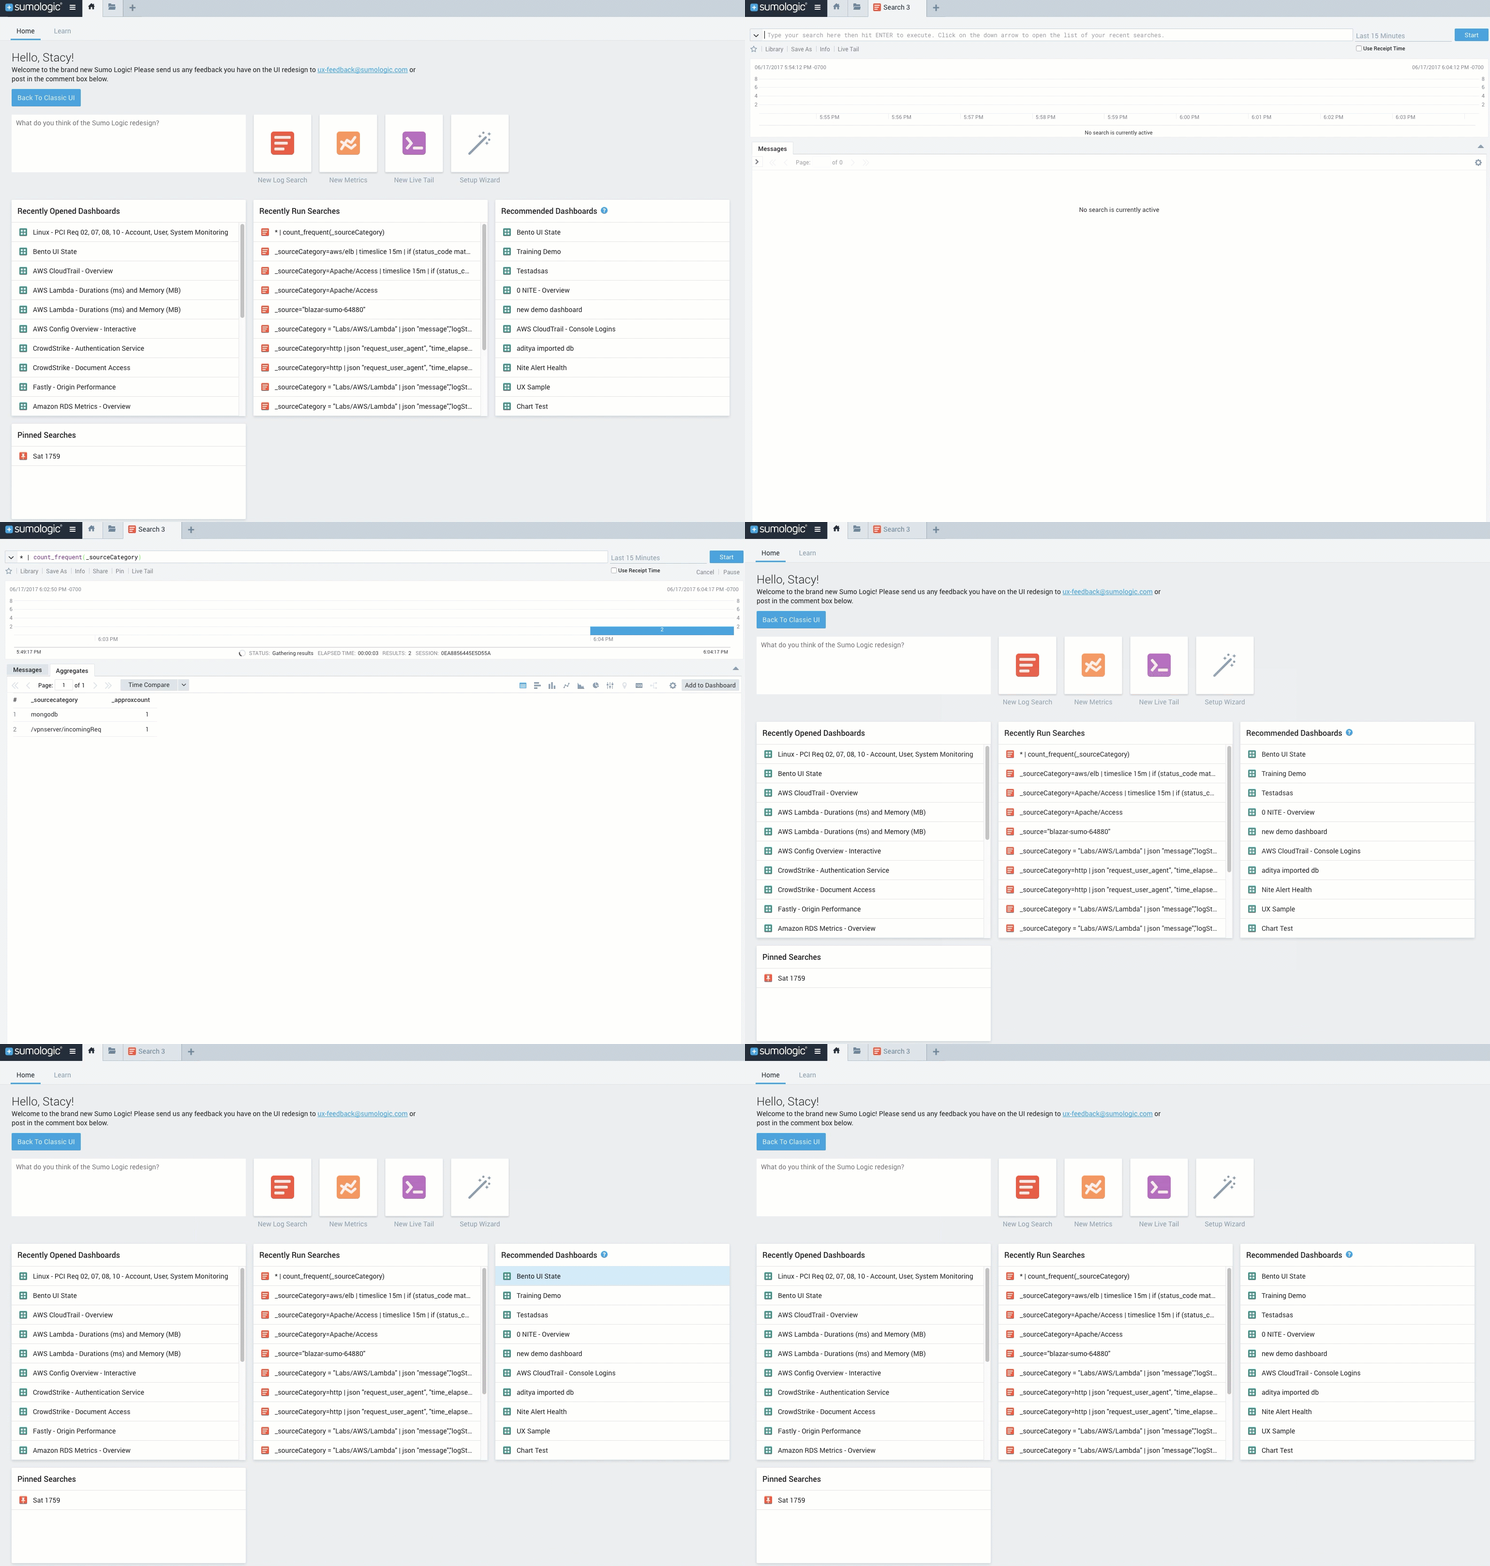
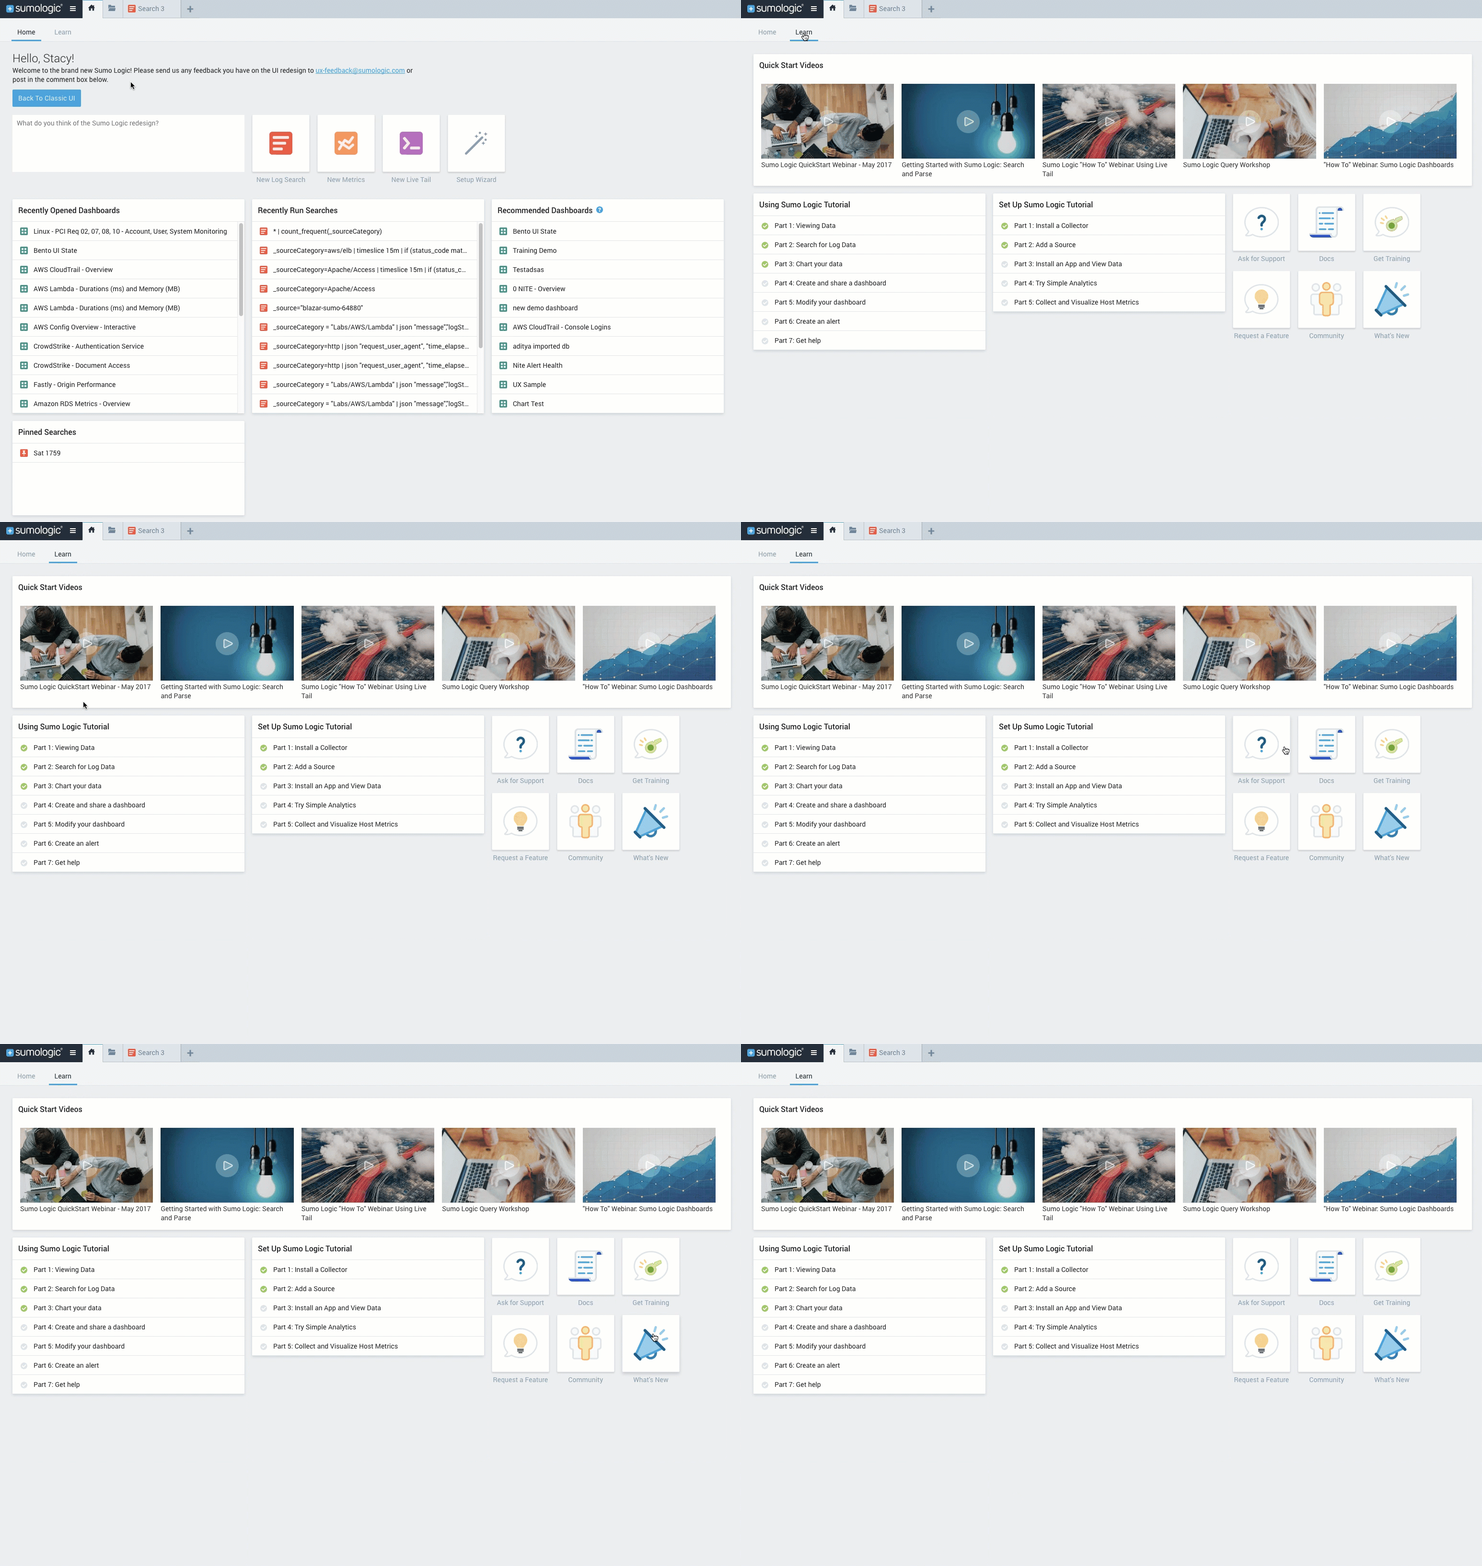
New Home page experience. Welcome to the Home page for the new Sumo UI. You can immediately launch searches, metrics, Live Tail, and the Setup Wizard directly from Home without having to wrestle with keyboard shortcuts or menu navigation.
You can also access:
- Recently Opened Dashboards. Easily access the dashboards you’ve run recently to check on current results or to make modifications.
- Recently Run Searches. Easily access the searches you’ve run recently to check on current results or to make modifications.
- Recommended Dashboards. Based on current dashboard use in your org, we’ll recommend other dashboards for you to try.
- Pinned Searches. Find any search you’ve pinned in Sumo.
Finally, we’d love your feedback. There’s a feedback submission window at the top so that you can reach out and let us know if there’s any way we can improve our design to make your product experience better.
New Learn page. Find out more about Sumo by clicking Learn from the Home page. Learn is designed to help you discover Sumo resources quickly by providing direct links to:
- Important how-to videos
- Tutorials on setting up and using Sumo for the first time
- Support ticket interface
- Product documentation
- Available training webinars
- Feature Request site
- Sumo Community
- What’s New page with the latest product announcements
Threat Intel for AWS App. A new app for Threat Intel for AWS correlates CrowdStrike threat intelligence data with your AWS log data, allowing for real-time security analytics to help detect threats in your environment and protect against cyber-attacks.
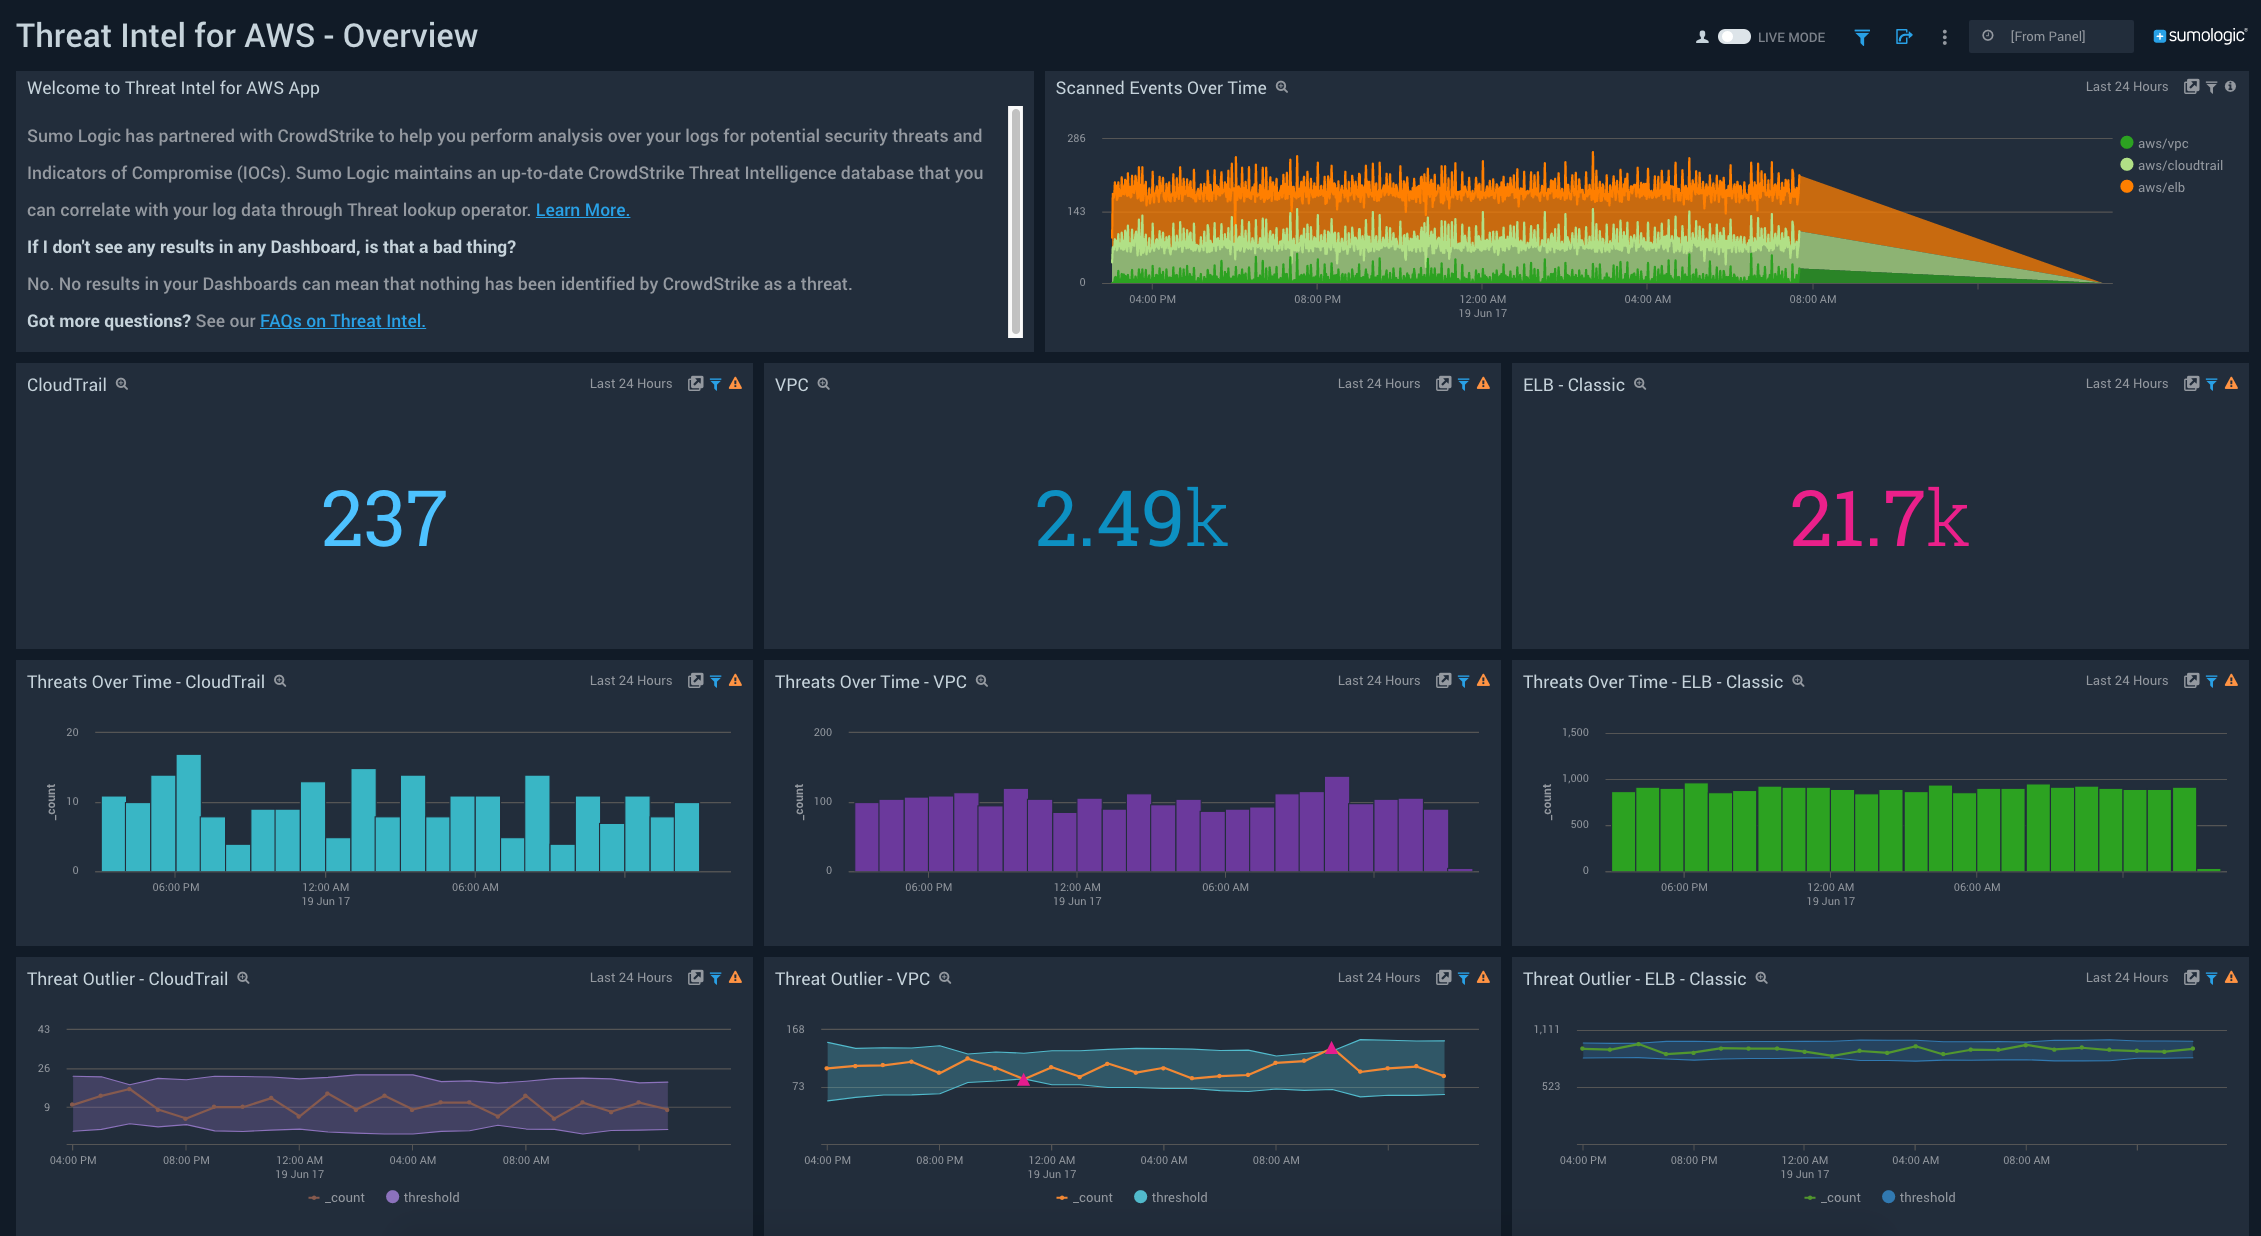
The Threat Intel for AWS App scans your AWS CloudTrail, AWS Elastic Load Balancing, and AWS VPC Flow logs for threats based on IP address and provides four pre-built dashboards, an overview and one for each data source.
June 16, 2017
Custom timestamp formats. You can now specify multiple custom timestamp formats per source, where to locate them in your log lines with regex, and test them to see if we can parse that format. We will still auto detect timestamps for you if your custom formats do not parse. See Timestamps, Time Zones, Time Ranges, and Date Formats and Use JSON to Configure Sources
More epoch timestamp support. You can now specify the epoch timestamp token, which will match against 10, 13, 16, or 19-digit epoch timestamps, with or without decimal points. See Timestamps, Time Zones, Time Ranges, and Date Formats.
June 12, 2017
Filter operator. Use the filter operator to filter the output a search using the results of a different search (using the same search expression). The filter operator keeps only the records that match the filter criteria, allowing you to restrict search results to the most relevant information. See filter operator.
June 1, 2017
New UI. This release introduces a new look and feel and experience for the Sumo Logic UI. Navigation is simplified, and it’s now much easier to find the content you’re looking for.
If you're a current Sumo Logic user, you'll find that the navigation and some menu items have changed, but most of your working experience will be just as it was before. During the rollout period, we encourage you to start right away with the new UI. That way you'll get used to the changes and can start realizing the benefits. New UI highlights include:
- Improved navigation. The menus that used to be on the top of of the UI are now on the left side (we call it the 'left nav'). The menus have been reorganized and some menu and page names have changed. See Navigate Around the New Sumo Logic UI to learn how the navigation compares for the new UI and classic UI.
- Switch between your tasks in Sumo Logic with the tab bar. The top tab bar allows you to keep multiple pages open at the same time and easily navigate between them. The tabs persist across login sessions, and you can switch context without jumping to new browser tabs or windows. This includes having multiple dashboards open in separate tabs. See Welcome to the new Sumo Logic UI.
- New log searches, metrics visualizations, and Live Tail sessions. It's now more convenient start working with logs or metrics. If you click the + icon in the Tabs area, you'll see options to select search, metrics, or Live Tail. See Welcome to the new Sumo Logic UI.
- Library. The Library contents are available from the left nav or the Library page. This is the first step in providing enhanced content sharing capabilities, which we’ll be continuing to roll out in upcoming releases. See Welcome to the New Library.
- App Catalog. You can access the App Catalog directly from the left nav to search for and install apps. See the topics under Data Types.
- Home page. The new Home page provides quick access to recently opened dashboards and searches. See Welcome to the new Sumo Logic UI.
Keyboard shortcuts. Keyboard shortcuts have changed for the new UI. See Keyboard Shortcuts for the New UI.
Apps. The App Catalog has a new preview option. If you’re not sure what dashboards you’ll get with an app, you can click the
Preview Dashboards link in the App Catalog to see a preview of the dashboards included with the app.
New tutorials. We’ve updated our Quick Start tutorials to better reflect the different getting started experiences for setting up Sumo Logic and using Sumo Logic.
Data Volume App updated. The Sumo Logic App for Data Volume allows you to view at a glance your account's data usage volume by category, collector, source name, and hosts. The app uses predefined searches and a Dashboard that provide visibility into your environment for real-time analysis of overall usage.
The Overview dashboard has been updated to provide a more comprehensive view of your Logs and Metrics data use.
The following dashboards have also been added:
- Data Volume - Logs See your log ingest volume in greater detail, outlining ingest spikes, outliers, and quota.
- Data Volume (Logs) by various metadata fields - Drill down on source metadata, using the metadata you've created within Sumo to better define your log sources.
- Data Volume - Metrics. Review details of your data ingest to identify areas of high-volume ingest.
May 29, 2017
New Accumulate Operator for Metrics. The accum metrics operator provides a running total over time of certain metrics. Use this when you are measuring a rate, and you want to understand the total number of occurrences. See accum.
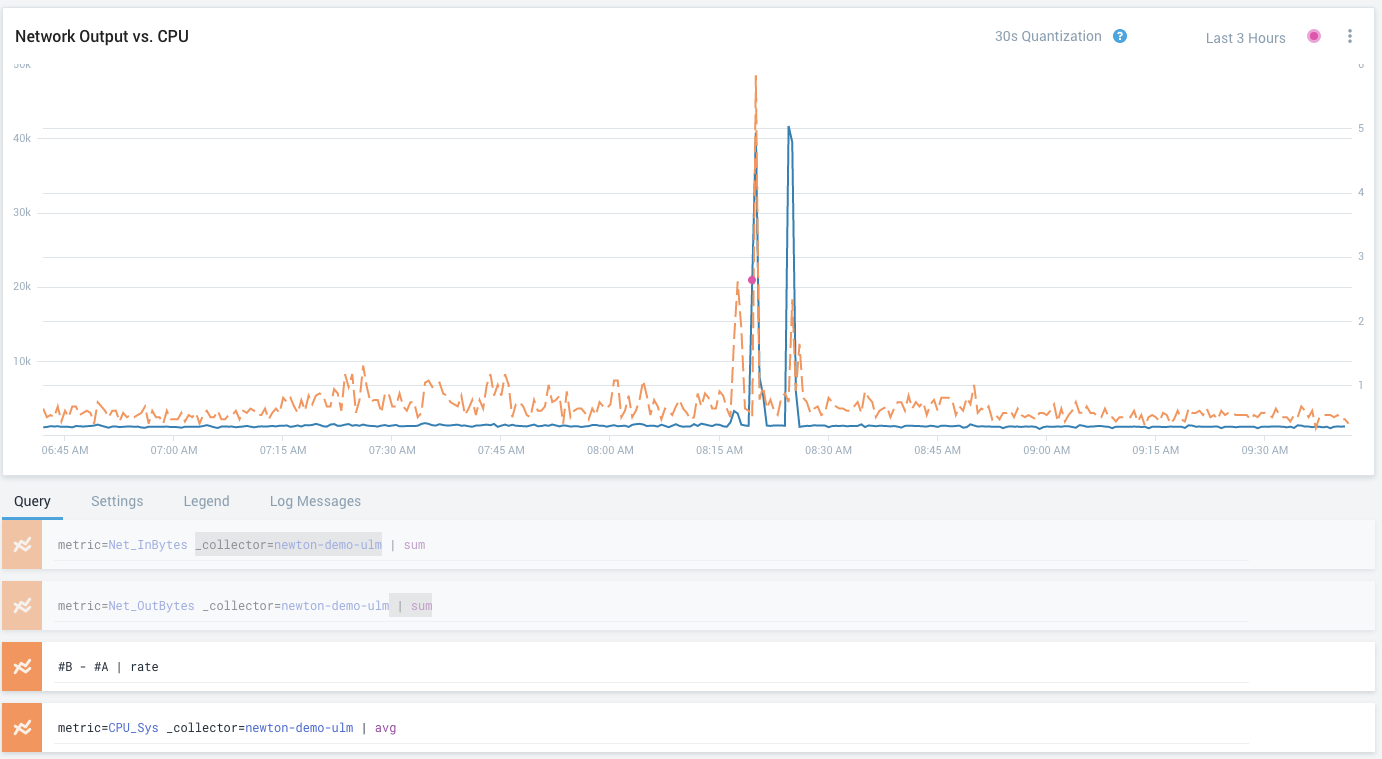
Multi-Query Math/JOIN for Metrics. Compare multiple different metrics in new ways to derive new insights. For example, compare network output and CPU use.
May 23, 2017
AWS Elastic Load Balancer - Classic. The AWS Elastic Load Balancer App has been renamed and updated to provide new panels and dashboards such as the Failed Dispatch Monitoring Dashboard to help you better investigate your AWS ELB usage.
Time Bucketing/Metrics quantization. When you’re visualizing metrics data, the time axis is fundamental to understanding your data.
- Multiple time series (lines on the chart) should line up in a way that makes it easy to understand and compare behavior (for example, at 10:25AM server1 had 95% CPU usage and server2 had 50% CPU usage).
- As you change the time scale, the granularity of the data points should change accordingly (for example, 1 second resolution for a metric over 30 days doesn’t make sense).
This capability is called quantization. The quantization interval aligns your time series data to common intervals on the time axis (for example every one minute) to optimize the visualization and performance. See Work with Metrics Visualizations.
May 2, 2017
Threat Intel Quick Analysis App. This App correlates CrowdStrike's threat intelligence data with your own log data, allowing for real-time security analytics to help you detect any threats in your environment, while protecting against sophisticated and persistent cyber-attacks. The Threat Intel Quick Analysis App scans your selected logs for threats based on IP, file name, URL, domain, Hash 256, and email. See Threat Intel Quick Analysis App.
Dashboard Sharing updates. You can now share Dashboards with just your organization (whitelist) or with everyone. The permission to share dashboards is now spit into two groups:
- Share Dashboards with the Whitelist
- Share Dashboards with the World
See Share Dashboards and Role Capabilities for details.
April 28, 2017
PCI Compliance for AWS CloudTrail App. The Sumo Logic App for Payment Card Industry (PCI) Compliance for AWS CloudTrail App offers dashboards to monitor systems, account and users activity to ensure that login activity and privileged users are within the expected ranges. The PCI Compliance for AWS CloudTrail App covers PCI requirements 02, 07, 08 and 10. See PCI Compliance for AWS CloudTrail App.
April 27, 2017
Fastly App. Fastly is a content delivery network (CDN) that provides you control over how and where you serve content, access to real-time performance analytics, and the ability to cache unpredictably changing content at the edge. With the Sumo Logic Fastly App, you can examine performance by origin, quality of service, and monitor your visitor traffic for important patterns using pre-defined searches and Dashboards for real-time visibility into your environment. See Fastly App.
April 26, 2017
PCI Compliance for Linux App. The Sumo Logic App for Payment Card Industry (PCI) Compliance for Linux offers dashboards to monitor systems, account and users activity to ensure that login activity and privileged users are within the expected ranges. The PCI Compliance for Linux App covers PCI requirements 02, 07, 08 and 10. See PCI Compliance for Linux App.
PCI Compliance for Windows App. The Sumo Logic App for Payment Card Industry (PCI) Compliance for Windows offers dashboards to monitor systems, account and users activity to ensure that login activity and privileged users are within the expected ranges. The PCI Compliance for Windows App covers PCI requirements 02, 06, 08 and 10. See PCI Compliance for Windows App.
April 24, 2017
AWS Elastic Load Balancer - Application App. This App ingests logs stored in an S3 bucket, giving you the visibility to see the overall health of your Application Load Balancer and Target Groups. Use the Sumo Logic App to analyze raw Application Load Balancer data to investigate the availability of applications running behind Application Load Balancers. See AWS Elastic Load Balancer - Application App.
March 28, 2017
Histogram Time Range Selection. You can highlight a time range in the search results histogram to filter your search results in the Messages tab based on that time range. See Change the Time Range in the Histogram.
Cloud Syslog Source. Documentation for the Cloud Syslog Source beta feature has been updated to expand the rsyslog and syslog-ng information and include troubleshooting suggestions. See Beta - Cloud Syslog Source.
March 27, 2017
OneLogin. OneLogin is an Identity Management provider that supplies a comprehensive set of enterprise-grade identity and access management solutions, including single sign-on (SSO), user provisioning, and multi-factor authentication. The Sumo Logic App for OneLogin provides real-time visibility and analysis of OneLogin user activity through event data, such as user logins, administrative operations, and provisioning. See OneLogin App.
March 16, 2017
Metrics Monitors, Alert on Missing Data. For your metrics query, you can monitor your time series to alert you when data has not been seen for a specified time period. These notifications can be sent via email or webhook connections such as Slack or PagerDuty.
March 1, 2017
2-Step Verification. Sumo Logic now offers 2-Step Verification, also known as two-factor authentication, as an optional feature for customers to enhance security and secure sensitive data stored in Sumo Logic. When 2-Step Verification is configured, the user is prompted for an additional security code after authenticating with their username and password. The user obtains the additional security code from a configured device. See About 2-Step Verification.
AWS Lambda functions. Documentation for creating AWS lambda functions was improved and updated to match the current Amazon user interface. See Amazon CloudWatch Logs and Collect Amazon VPC Flow Logs.
February 22, 2017
Log overlay. Metrics visualizations give you a clear picture of WHAT is happening in your environment. By adding log overlays to your metrics visualizations, you can investigate WHY behavior is occurring and what corrective action might be called for. Log overlays help you correlate the performance shown in your metrics visualizations with logged events that could be responsible for changes in behavior. See Use Log Overlay to Analyze Metrics Visualizations for more information.
Share Dashboards Outside of Your Organization. You can share your live dashboards in view-only mode with no sign-in required, with an option to restrict access to viewers connecting from IPs / CIDRs specified in your service whitelist. This feature must be enabled by an administrator on the Manage > Security > Sumo Logic Policies page. See Share Dashboards for more information.
January 30, 2017
Throttling multipliers increased. Based on extensive testing, the multipliers for throttling based on daily average account size have been increased, in order to reduce the number of customers being throttled. See Manage Ingestion for more information.
| Account Size - Daily Average | Old Multiplier | New Multiplier |
| Less than 100GB per day | 7.0x | 7.5x |
| Between 100-256GB per day | 5.6x | 6.0x |
| Between 256-512GB per day | 4.2x | 4.5x |
| More than 512GB per day | 2.8x | 3.0x |
January 13, 2017
Metrics Data Volume Index. Metrics have been added to the Data Volume Index to provide visibility into the ingest volume as measured in data points. See Enable and Manage the Data Volume Index.
January 4, 2017
Metrics Monitors and Alerts. For your metrics query, you can set a monitor on a time series to alert you when the metric has crossed a static threshold, and then send an email alert. You can set a maximum of one critical alert and one warning alert for each monitor.
Webhook Connection for Microsoft Azure Functions. You can trigger an Azure function directly from a Scheduled Search or metrics monitor by configuring a Webhook connection in Sumo Logic. For details see Webhook Connection for Microsoft Azure Functions.
Webhook Connection for AWS Lambda. You can trigger an AWS Lambda function directly from a Scheduled Search or metrics monitor by configuring a Webhook connection in Sumo Logic. For details see Webhook Connection for AWS Lambda.