Azure Audit
The Azure Audit App allows you to collect data from the Azure Activity Log (formerly known as Azure Audit logs) and monitor the health of your Azure environment. The App provides preconfigured Dashboards that allow you to monitor Active Directory activity, resource usage, service health, and user activity. Logs can be collected in two ways - from Event Hub, and from Azure Insight API using Sumo Powershell scripts.
This guide walks you through the tasks you'll perform to collect Azure Audit logs from Event Hub:
- Create an Event Hub.
- Export activity logs to the Event Hub.
- Create a Function App.
- Define the required environment variables.
- Deploy the function.
- Then, install the Sumo Logic App for Azure Audit.
To install the Sumo Logic App for Azure Audit, you must sign up for a Sumo Logic Account, if you have not already done so. To sign up, go to https://www.sumologic.com/pricing/ and select your account type or click Free Trial to sign up for a Sumo Logic Free account.
Log Types
The Azure Audit App uses the following logs:
- Local Windows Event Source Logs
- Azure Activity Log
- (Optional) Azure Active Directory Audit Reports
Collecting Logs for the Azure Audit App from Event Hub
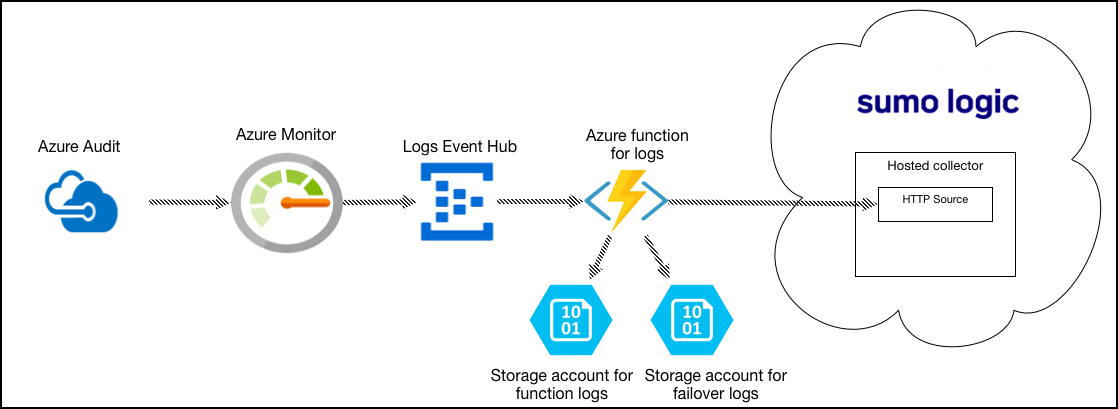
This section has instructions for configuring a pipeline for shipping Azure Audit logs from Azure Monitor to an Event Hub, on to an Azure Function, and finally to an HTTP source on a hosted collector in Sumo Logic.
The sections below are either for FedRamp Sumo Logic deployments or if you have been advised by the Sumo Logic support team to not use the Cloud to Cloud Integration based on your Azure environments.
Here’s how the solution fits together:
- Azure Monitor collects logs for most Microsoft Azure services, including Azure Audit, and streams the data to an Azure Event Hub.
- Azure Event Hubs is a data streaming platform and event ingestion service. In this pipeline, an Event Hub streams the logs collected by Azure Monitor to an Azure function.
- The Azure function is a small piece of code that is triggered by Event Hub to send logs to the Sumo HTTP Source, function logs to one Storage Account, and failover data to another.
Configure an HTTP source
In this step, you configure an HTTP source to which the Azure function will send Azure Activity logs.
- Select a hosted collector where you want to configure the HTTP source. If desired, create a new hosted collector, as described on Configure a Hosted Collector.
- Configure an HTTP source, as described on HTTP Logs and Metrics Source.
Configure Azure resources using ARM template
In this step, you use a Sumo-provided Azure Resource Manager (ARM) template to create an Event Hub, an Azure function and two Storage Accounts. The Azure function is triggered by Event Hub. Two storage accounts are used to store log messages from the Azure function and failover data from Event Hub.
- Download the azuredeploy_logs.json ARM template.
- Go to Template deployment in the Azure Portal.
- Click Create.
- On the Custom deployment blade, click Build your own template in the editor.
- Copy the contents of
azuredeploy_logs.json, and paste it into the editor window. - Click Save.
- Now you are back on the Custom deployment blade.
- Create a new Resource Group (recommended) or select an existing one.
- Choose Location.
- In the Sumo Endpoint URL field, enter the URL of the HTTP Source you configured in Step 1.
- Agree to the terms and conditions.
- Click Purchase.
- Verify the deployment was successful by looking at Notifications at the top right corner of Azure Portal.
- (Optional) In the same window, you can click Go to resource group to verify all resources have been created successfully. You will see something like this: \
- Go to Storage accounts and search for “sumofailmsg”. Click on
sumofailmsg_<random-string>. - Under Blob Service, click Containers, then click + Container, enter the Name azureaudit-failover, and select Private for the Public Access Level. Click OK.
Export Activity Logs to Event Hub
In the search bar, search, and select **Activity Log.
In the Activity log window, click Diagnostic Settings.
In the Diagnostic Settings window, click **Add Diagnostic settings.
Select the log type in Category details that you want to ingest.
- Select the Stream to an event hub checkbox and then select the following:
- Subscription. Pull-down, select a subscription.
- Event Hub Namespace. Pull-down, select the
SumoAzureLogsNamespace<UniqueSuffix>namespace created by the ARM template in Step 2. - Event Hub name (optional). Select
"insights-operational-logs". - Event hub policy name. Leave the default policy, RootManageSharedAccessKey, or select another as desired.
- Click Save.
- Select the Stream to an event hub checkbox and then select the following:
Troubleshooting
If logs are not flowing into Sumo Logic, see Troubleshooting.
Installing the Azure Audit App
Now that you have set up collection from the Azure Activity Log (previously known as Azure Audit logs), install the Azure Audit App to use the preconfigured searches and dashboards that provide insight into your data.
To install the app:
Locate and install the app you need from the App Catalog. If you want to see a preview of the dashboards included with the app before installing, click Preview Dashboards.
- From the App Catalog, search for and select the app.
- Select the version of the service you're using and click Add to Library.
Version selection is applicable only to a few apps currently. For more information, see Installing the Apps from the Library.
- To install the app, complete the following fields.
- App Name. You can retain the existing name, or enter a name of your choice for the app.
- Data Source. Select either of these options for the data source.
- Choose Source Category, and select a source category from the list.
- Choose Enter a Custom Data Filter, and enter a custom source category beginning with an underscore. Example: (
_sourceCategory=MyCategory).
- Advanced. Select the Location in Library (the default is the Personal folder in the library), or click New Folder to add a new folder.
- Click Add to Library.
Once an app is installed, it will appear in your Personal folder, or other folder that you specified. From here, you can share it with your organization.
Panels will start to fill automatically. It's important to note that each panel slowly fills with data matching the time range query and received since the panel was created. Results won't immediately be available, but with a bit of time, you'll see full graphs and maps.
Viewing Azure Audit Dashboards
The predefined Dashboards on Azure Audit allow you to instantly monitor the activities and events. All the dashboards in the App, except the Azure Audit - Active Directory dashboard, support logs from both Event Hub and Insight API.
Overview
Use this dashboard to get a high-level view of the Azure activity by location, and details of events.
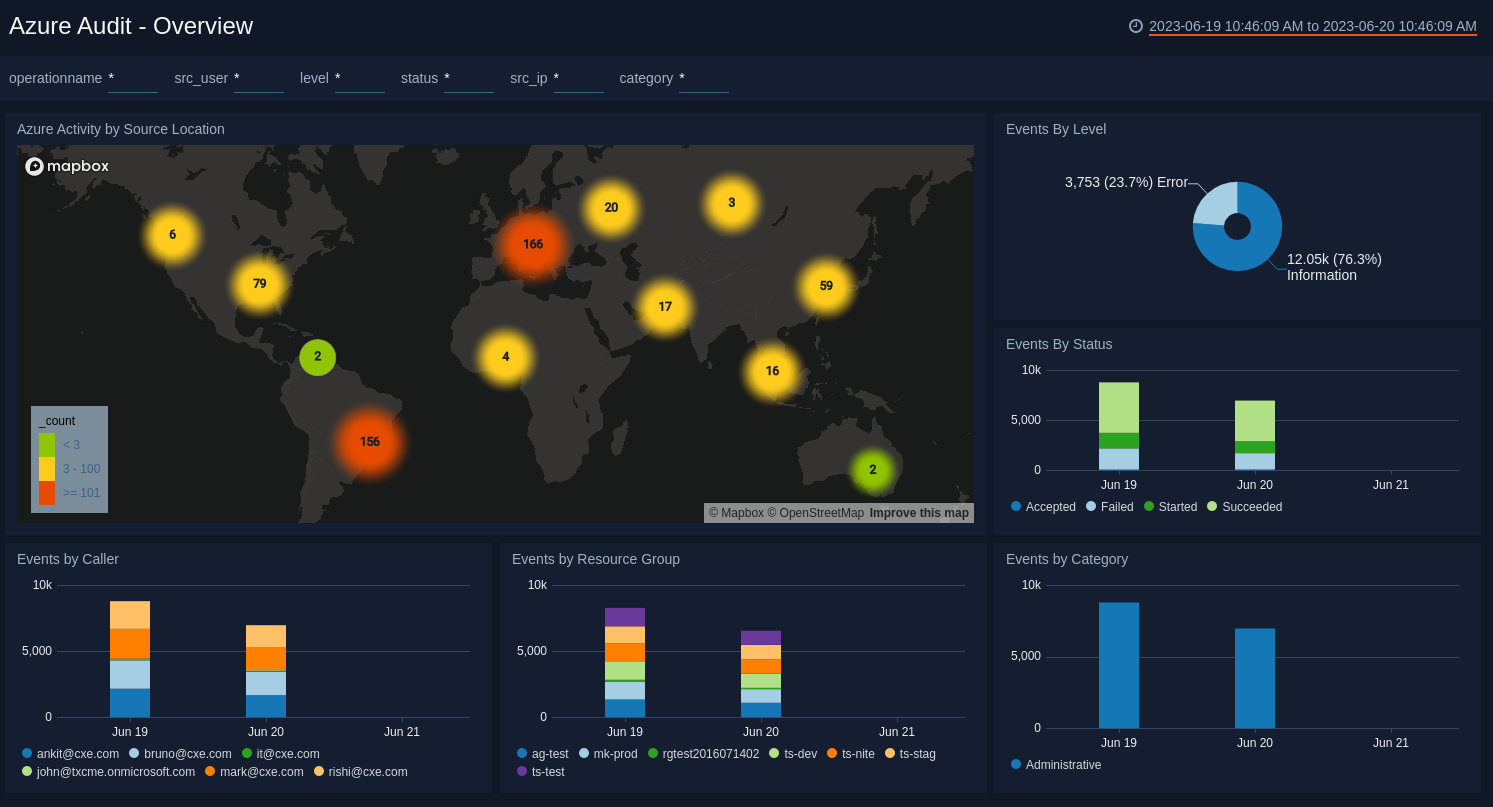
Azure Activity by Source Location. Performs a geo lookup operation to display the location of Azure activity by Source location on a map of the world for the last seven days.
Events by Level. Displays events by level in a pie chart for the last seven days.
Events by Status. Shows details on events by status in a stacked column chart on a timeline for the last seven days.
Events by Caller. Provides details on events by caller in a stacked column chart on a timeline for the last seven days.
Events by Resource Group. Displays details on events by Resource Group in a stacked column chart on a timeline for the last seven days.
Events by Category. Shows details on events by category in a stacked column chart on a timeline for the last seven days.
Resource Usage
Use this dashboard to see the details on resource group and resource provider.
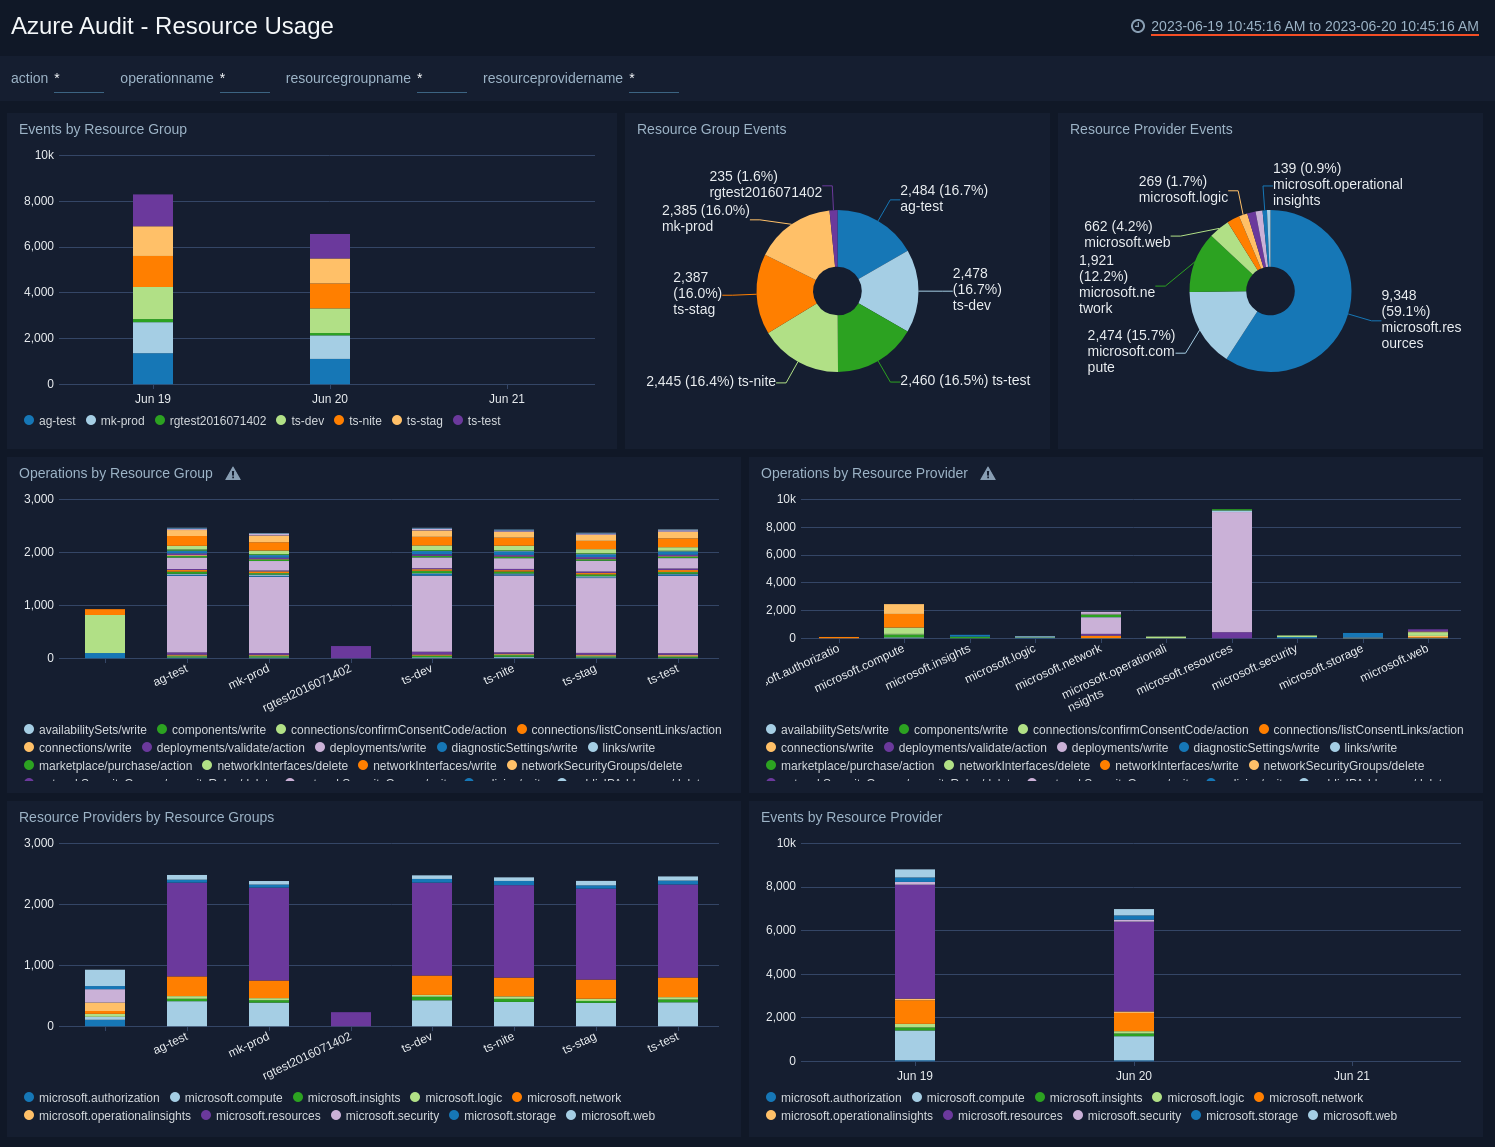
Events by Resource Group. Displays details on events by Resource Group across time in a stacked column chart on a timeline for the last seven days.
Resource Group Events. Shows Resource Group events in a pie chart for the last seven days.
Resource Provider Events. Shows information on Resource Provider events in a pie chart for the last seven days.
Operations by Resource Group. Shows details on operations by Resource Group by name and count in a stacked column chart for the last seven days.
Operations by Resource Provider. Shows details on operations by Resource Provider by name and count for last seven days.
Resource Providers by Resource Group. Displays details on Resource Providers by Resource Group by name and count in a stacked column chart for the last seven days.
Events by Resource Provider. Displays details on events by Resource Provider across time in a stacked column chart on a timeline for the last seven days.
Service Health
Use this dashboard to see the details on Azure service health such as the level, status, and events.
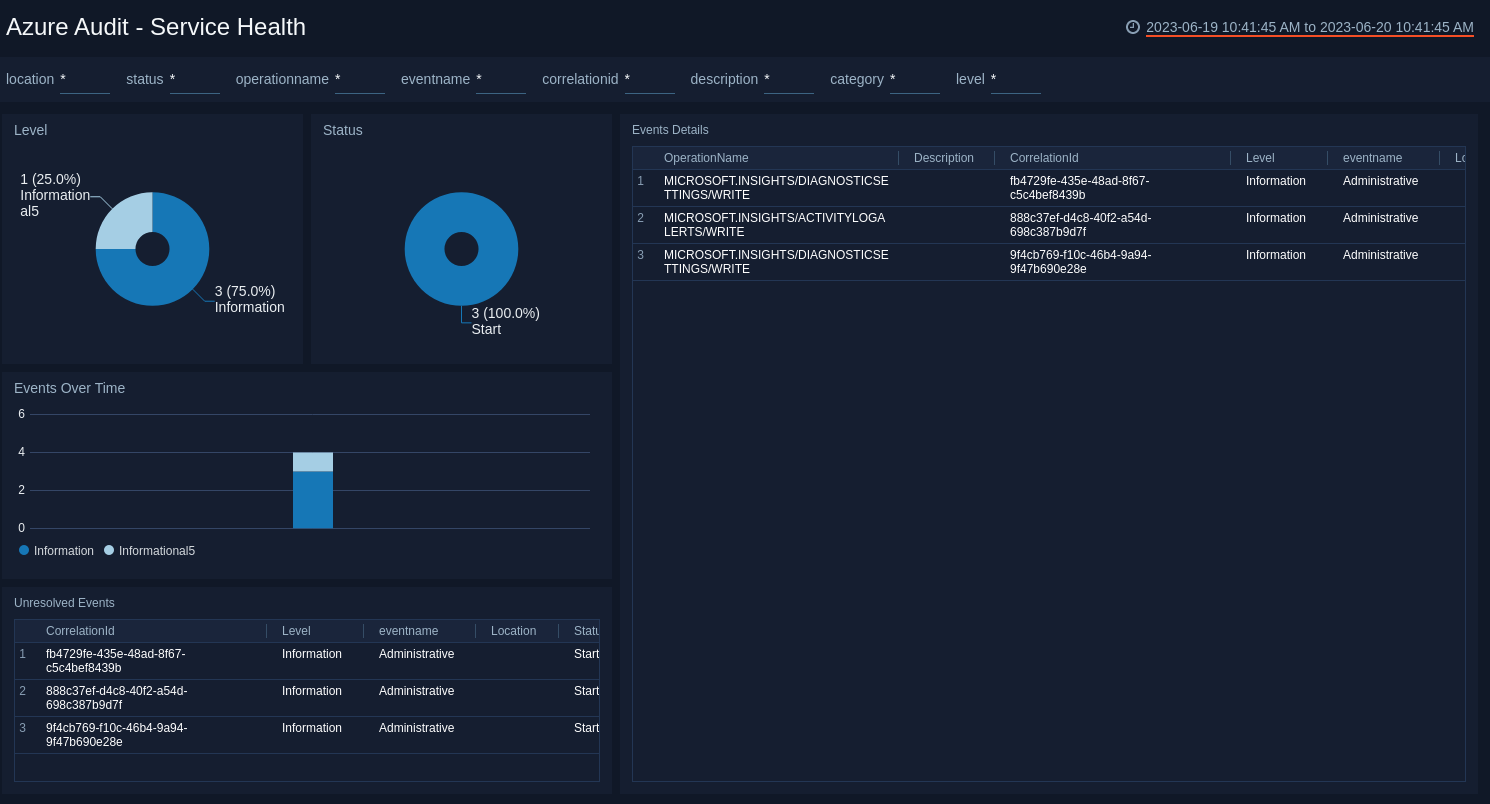
Level. Displays information by level in a pie chart for the last seven days.
Status. Shows information by status in a pie chart for the last seven days.
Events Details. Provides information on Azure service health events in a table chart, including details such as operation name, description, level, correlation ID, event name, location, status, and time for the last seven days.
Events Over Time. Displays events over time in a column chart on a timeline for the last seven days.
Unresolved Events. Provides information on unresolved service health events in a table chart, including details on correlation ID, level, event name, location, status, and time for the last 30 days.
User Activity
Use this dashboard to see the details on events, resources, and users.
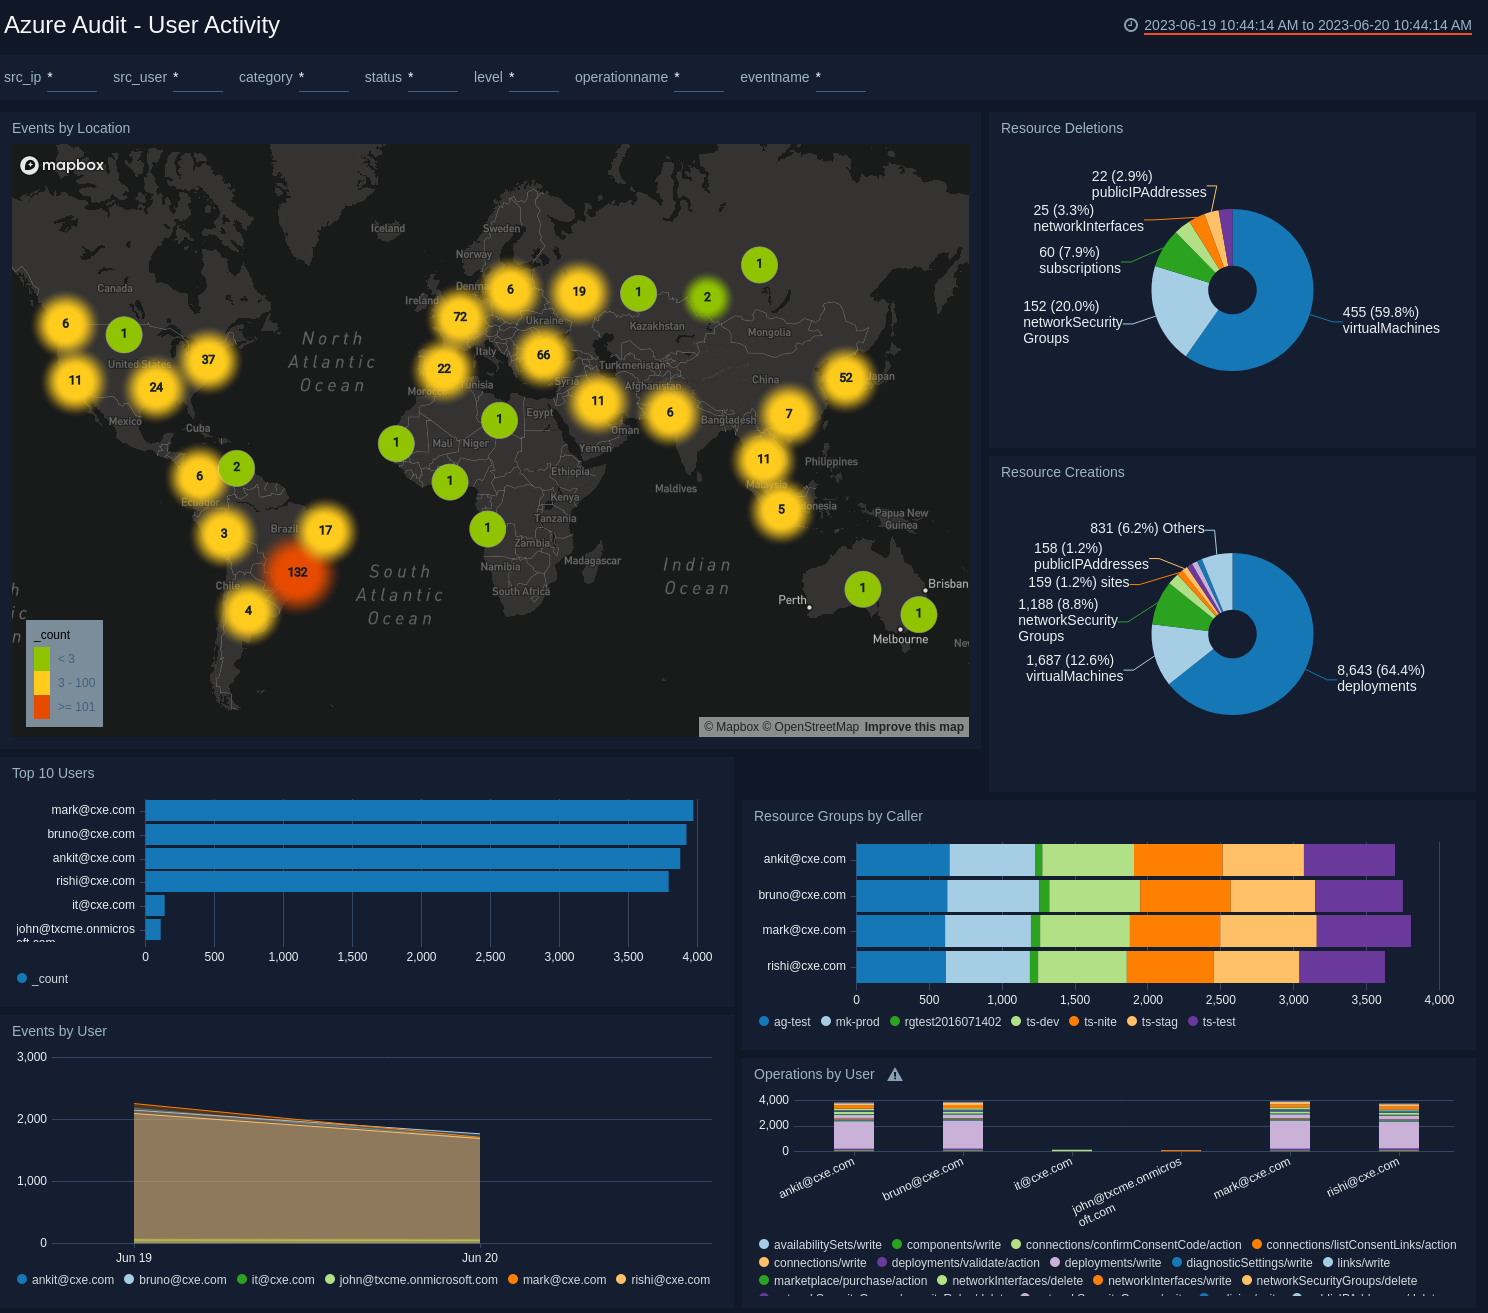
Events by Location. Performs a geo lookup operation to display user activity events by IP address location on a map of the world for the last seven days.
Resource Deletions. Displays resource deletions in a pie chart for the last seven days.
Resource Creations. Provides details on resource creations in a pie chart for the last seven days.
Top 10 Users. Displays the top 10 users by name and event count in a bar chart for the last seven days.
Resource Groups by Caller. Shows Resource Groups by caller in a stacked bar chart by name and count for the last seven days.
Events by User. Provides details on events per user in an area chart on a timeline for the last seven days.
Operations by User. Displays operations by user in a stacked column chart by name and count for the last seven days.