Amazon RDS
Amazon Relational Database Service (Amazon RDS) is optimized to run in the cloud. The RDS Amazon Web Service (AWS) simplifies the setup, operation, and scaling of relational database instances for use in applications throughout your infrastructure.
The Sumo Logic Amazon RDS app dashboards provide visibility into the performance and operations of your Amazon Relational Database Service (RDS). Preconfigured dashboards allow you to monitor critical metrics of your RDS cluster including CPU, memory, storage, network transmits and receive throughput, read and write operations, database connection count, disk queue depth, and more. Audit activity dashboards help you monitor activities performed on your RDS infrastructure.
Log and Metrics Types
The Amazon RDS app uses the following logs and metrics:
- RDS CloudWatch Instance Level Metrics, RDS CloudWatch Aurora Metrics, and Amazon CloudWatch metrics for Performance Insights.
- Amazon RDS operations using AWS CloudTrail
Sample Log Message
Click to expand
{"eventVersion":"1.05","userIdentity":{"type":"IAMUser","principalId":"AIDABCDEFGH4QEWUABG5Q",
"arn":"arn:aws:iam::951234567898:user/Nitin","accountId":"951234567898","accessKeyId":"ASIABCDEFGHFBOT4FDVK",
"userName":"Nitin","sessionContext":{"attributes":{"mfaAuthenticated":"true","creationDate":
"2018-10-28T08:16:35Z"}},"invokedBy":"signin.amazonaws.com"},"eventTime":"2018-10-28T08:55:37Z",
"eventSource":"rds.amazonaws.com","eventName":"CreateDBCluster","awsRegion":"us-west-1","sourceIPAddress"
:"140.144.120.190","userAgent":"signin.amazonaws.com","requestParameters":{"backupRetentionPeriod":1,
"databaseName":"NitinSampleDB","dBClusterIdentifier":"auroramysql57dbcluster02-cluster","dBClusterParameterGroupName"
:"default.aurora-mysql5.7","vpcSecurityGroupIds":["sg-0123454e5b1da3aff"],"dBSubnetGroupName":"default-vpc-b92fc5d7",
"engine":"aurora-mysql","engineVersion":"5.7.12","port":3306,"masterUsername":"nitin","masterUserPassword":"****",
"storageEncrypted":true,"enableCloudwatchLogsExports":["audit","error","general","slowquery"],"engineMode":
"provisioned"},"responseElements":{"allocatedStorage":1,"availabilityZones":["us-west-1a","us-west-1b",
"us-west-1c"],"backupRetentionPeriod":1,"databaseName":"NitinSampleDB","dBClusterIdentifier":
"auroramysql57dbcluster02-cluster","dBClusterParameterGroup":"default.aurora-mysql5.7","dBSubnetGroup"
:"default-vpc-b92fc5d7","status":"creating","endpoint":"auroramysql57dbcluster07-cluster.cluster-cp1svq2n34sd.us-west-1.rds.amazonaws.com",
"readerEndpoint":"auroramysql57dbcluster07-cluster.cluster-ro-cp5svq2n34sd.us-west-1.rds.amazonaws.com",
"multiAZ":false,"engine":"aurora-mysql","engineVersion":"5.7.12","port":3306,"masterUsername":"nitin",
"preferredBackupWindow":"03:25-03:55","preferredMaintenanceWindow":"tue:03:58-tue:04:28","readReplicaIdentifiers":[],
"dBClusterMembers":[],"vpcSecurityGroups":[{"vpcSecurityGroupId":"sg-012345e5b1da3aff","status":"active"}],
"hostedZoneId":"Z2R2ITUGPM61AM","storageEncrypted":true,"kmsKeyId":"arn:aws:kms:us-west-1:951234567898:key/9a3d8016-4cdb-478f-a3a4-9a310fc25307",
"dbClusterResourceId":"cluster-AVPSEUMFISOMMXXVGKL4GBUC2E","dBClusterArn":"arn:aws:rds:us-west-1:951234567898:cluster:auroramysql57dbcluster02-cluster",
"associatedRoles":[],"iAMDatabaseAuthenticationEnabled":false,"clusterCreateTime":"Oct 28, 2018 8:55:35 AM","enabledCloudwatchLogsExports":["audit","error","general","slowquery"],"engineMode":
"provisioned","deletionProtection":false},"requestID":"2cbb7974-b79c-4121-aed1-5ebe8f945b72",
"eventID":"7e554be7-0a00-4f8f-9e56-a2d54519fff9","eventType":"AwsApiCall","recipientAccountId":
"951234567898"}
Sample Queries
Namespace=aws/rds metric=DatabaseConnections statistic=average account=* region=* dbidentifier=* | avg by account, region, dbidentifier
"\"eventsource\":\"rds.amazonaws.com\"" errorCode account=dev Namespace=aws/rds region=us-east-1
| json "eventTime", "eventName", "eventSource", "awsRegion", "userAgent", "recipientAccountId", "userIdentity", "requestParameters", "responseElements", "errorCode", "errorMessage",  "requestID", "sourceIPAddress" as eventTime, event_name, event_source, Region, user_agent, accountId1, userIdentity, requestParameters, responseElements, error_code, error_message, requestID, src_ip nodrop
| where event_source = "rds.amazonaws.com" and !isEmpty(error_code)
| json field=userIdentity "accountId", "arn", "userName", "type" as accountId, arn, username, type nodrop
| parse field=arn ":assumed-role/*" as user nodrop | parse field=arn "arn:aws:iam::*:*" as accountId, user nodrop
| if (isEmpty(error_code), "Success", "Failure") as event_status
| json field=requestParameters "dBInstanceIdentifier", "resourceName", "dBClusterIdentifier" as dBInstanceIdentifier1, resourceName, dBClusterIdentifier1 nodrop
| json field=responseElements "dBInstanceIdentifier" as dBInstanceIdentifier3 nodrop | json field=responseElements "dBClusterIdentifier" as dBClusterIdentifier3 nodrop
| parse field=resourceName "arn:aws:rds:*:db:*" as f1, dBInstanceIdentifier2 nodrop | parse field=resourceName "arn:aws:rds:*:cluster:*" as f1, dBClusterIdentifier2 nodrop
| if (resourceName matches "arn:aws:rds:*:db:*", dBInstanceIdentifier2, if (!isEmpty(dBInstanceIdentifier1), dBInstanceIdentifier1, dBInstanceIdentifier3) ) as dBInstanceIdentifier
| if (resourceName matches "arn:aws:rds:*:cluster:*", dBClusterIdentifier2, if (!isEmpty(dBClusterIdentifier1), dBClusterIdentifier1, dBClusterIdentifier3) ) as dBClusterIdentifier
| count as Frequency by error_code
| top 10 error_code by Frequency, error_code asc
Collecting Logs and Metrics for the Amazon RDS App
Sumo Logic supports collecting metrics using two source types
- Configure an AWS Kinesis Firehose for Metrics Source (Recommended); or
- Configure an Amazon CloudWatch Source for Metrics
Namespace for Amazon RDS Service is AWS/RDS.
- Metadata: Add an account field to the source and assign it a value that is a friendly name/alias to your AWS account from which you are collecting metrics. This name will appear in the Sumo Logic Explorer View. Metrics can be queried via the “account field”.
Collect Amazon RDS CloudTrail Logs
- To your Hosted Collector, add an AWS CloudTrail Source.
- Name. Enter a name to display the new Source.
- Description. Enter an optional description.
- S3 Region. Select the Amazon Region for your Amazon RDS S3 bucket.
- Bucket Name. Enter the exact name of your Amazon RDS S3 bucket.
- Path Expression. Enter the string that matches the S3 objects you'd like to collect. You can use a wildcard (*) in this string. (DO NOT use a leading forward slash. See Amazon Path Expressions). The S3 bucket name is not part of the path. Don’t include the bucket name when you are setting the Path Expression
- Source Category. Enter aws/observability/cloudtrail/logs
- Fields. Add an account field and assign it a value that is a friendly name/alias to your AWS account from which you are collecting logs. This name will appear in the Sumo Logic Explorer View. Logs can be queried via the “account field”.
- Access Key ID and Secret Access Key. Enter your Amazon Access Key ID and Secret Access Key. Learn how to use Role-based access to AWS here
- Log File Discovery -> Scan Interval. Use the default of 5 minutes. Alternately, enter the frequency. Sumo Logic will scan your S3 bucket for new data. Learn how to configure Log File Discovery here.
- Enable Timestamp Parsing. Select the check box.
- Time Zone. Select Ignore time zone from log file and instead use, and select UTC.
- Timestamp Format. Select Automatically detect the format.
- Enable Multiline Processing. Select the check box, and select Infer Boundaries.
- Click Save.
Field in Field Schema
Login to Sumo Logic, go to Manage Data > Logs > Fields. Search for the dbidentifier field. If not present, create it. Learn how to create and manage fields here.
Field Extraction Rule(s)
Create a Field Extraction Rule for CloudTrail Logs. Learn how to create a Field Extraction Rule here.
Rule Name: AwsObservabilityRdsCloudTrailLogsFER
Applied at: Ingest Time
Scope (Specific Data): account=* eventname eventsource "rds.amazonaws.com"
| json "eventSource", "awsRegion", "requestParameters", "responseElements", "recipientAccountId" as eventSource, region, requestParameters, responseElements, accountid nodrop
| where eventSource = "rds.amazonaws.com"
| "aws/rds" as namespace
| json field=requestParameters "dBInstanceIdentifier", "resourceName", "dBClusterIdentifier" as dBInstanceIdentifier1, resourceName, dBClusterIdentifier1 nodrop
| json field=responseElements "dBInstanceIdentifier" as dBInstanceIdentifier3 nodrop | json field=responseElements "dBClusterIdentifier" as dBClusterIdentifier3 nodrop
| parse field=resourceName "arn:aws:rds:*:db:*" as f1, dBInstanceIdentifier2 nodrop | parse field=resourceName "arn:aws:rds:*:cluster:*" as f1, dBClusterIdentifier2 nodrop
| if (resourceName matches "arn:aws:rds:*:db:*", dBInstanceIdentifier2, if (!isEmpty(dBInstanceIdentifier1), dBInstanceIdentifier1, dBInstanceIdentifier3) ) as dBInstanceIdentifier
| if (resourceName matches "arn:aws:rds:*:cluster:*", dBClusterIdentifier2, if (!isEmpty(dBClusterIdentifier1), dBClusterIdentifier1, dBClusterIdentifier3) ) as dBClusterIdentifier
| if (isEmpty(dBInstanceIdentifier), dBClusterIdentifier, dBInstanceIdentifier) as dbidentifier
| tolowercase(dbidentifier) as dbidentifier
| fields region, namespace, dBInstanceIdentifier, dBClusterIdentifier, dbidentifier, accountid
Centralized AWS CloudTrail Log Collection
In case you have a centralized collection of CloudTrail logs and are ingesting them from all accounts into a single Sumo Logic CloudTrail log source, create the following Field Extraction Rule to map a proper AWS account(s) friendly name/alias. Create it if not already present / update it as required.
Rule Name: AWS Accounts
Applied at: Ingest Time
Scope (Specific Data): _sourceCategory=aws/observability/cloudtrail/logs
Parse Expression:
Enter a parse expression to create an “account” field that maps to the alias you set for each sub account. For example, if you used the “dev” alias for an AWS account with ID "528560886094" and the “prod” alias for an AWS account with ID "567680881046", your parse expression would look like:
| json "recipientAccountId"
// Manually map your aws account id with the AWS account alias you setup earlier for individual child account
| "" as account
| if (recipientAccountId = "528560886094",  "dev", account) as account
| if (recipientAccountId = "567680881046",  "prod", account) as account
| fields account
Metric Rules
Create the following two Metric Rules for the aws/rds namespace if not already created. Learn how to create a Metrics Rule here.
Rule name: AwsObservabilityRDSClusterMetricsEntityRule
Metric match expression: Namespace=AWS/RDS DBClusterIdentifier=*
Variable name: dbidentifier
Tag sequence: $DBClusterIdentifier._1
Save it
Rule name: AwsObservabilityRDSInstanceMetricsEntityRule
Metric match expression: Namespace=AWS/RDS DBInstanceIdentifier=*
Variable name: dbidentifier
Tag sequence: $DBInstanceIdentifier._1
Save it
Installing the RDS App
Now that you have set up a collection for Amazon RDS, install the Sumo Logic App to use the pre-configured dashboards that provide visibility into your environment for real-time analysis of overall usage.
To install the app:
Locate and install the app you need from the App Catalog. If you want to see a preview of the dashboards included with the app before installing, click Preview Dashboards.
- From the App Catalog, search for and select the app.
- To install the app, click Add to Library and complete the following fields.
- App Name. You can retain the existing name, or enter a name of your choice for the app.
- Advanced. Select the Location in Library (the default is the Personal folder in the library), or click New Folder to add a new folder.
- Click Add to Library.
Once an app is installed, it will appear in your Personal folder, or another folder that you specified. From here, you can share it with your organization.
Panels will start to fill automatically. It's important to note that each panel slowly fills with data matching the time range query received since the panel was created. Results won't immediately be available, but with a bit of time, you'll see full graphs and maps.
Viewing the RDS Dashboards
The Sumo Logic Amazon RDS app dashboards provide visibility into the performance and operations of your Amazon Relational Database Service (RDS). Preconfigured dashboards allow you to monitor critical metrics of your RDS cluster including CPU, memory, storage, the network transmits and receive throughput, read and write operations, database connection count, disk queue depth, and more. Audit activity dashboards help you monitor activities performed on your RDS infrastructure.
We highly recommend you view these dashboards in the Explore View of the AWS Observability solution.
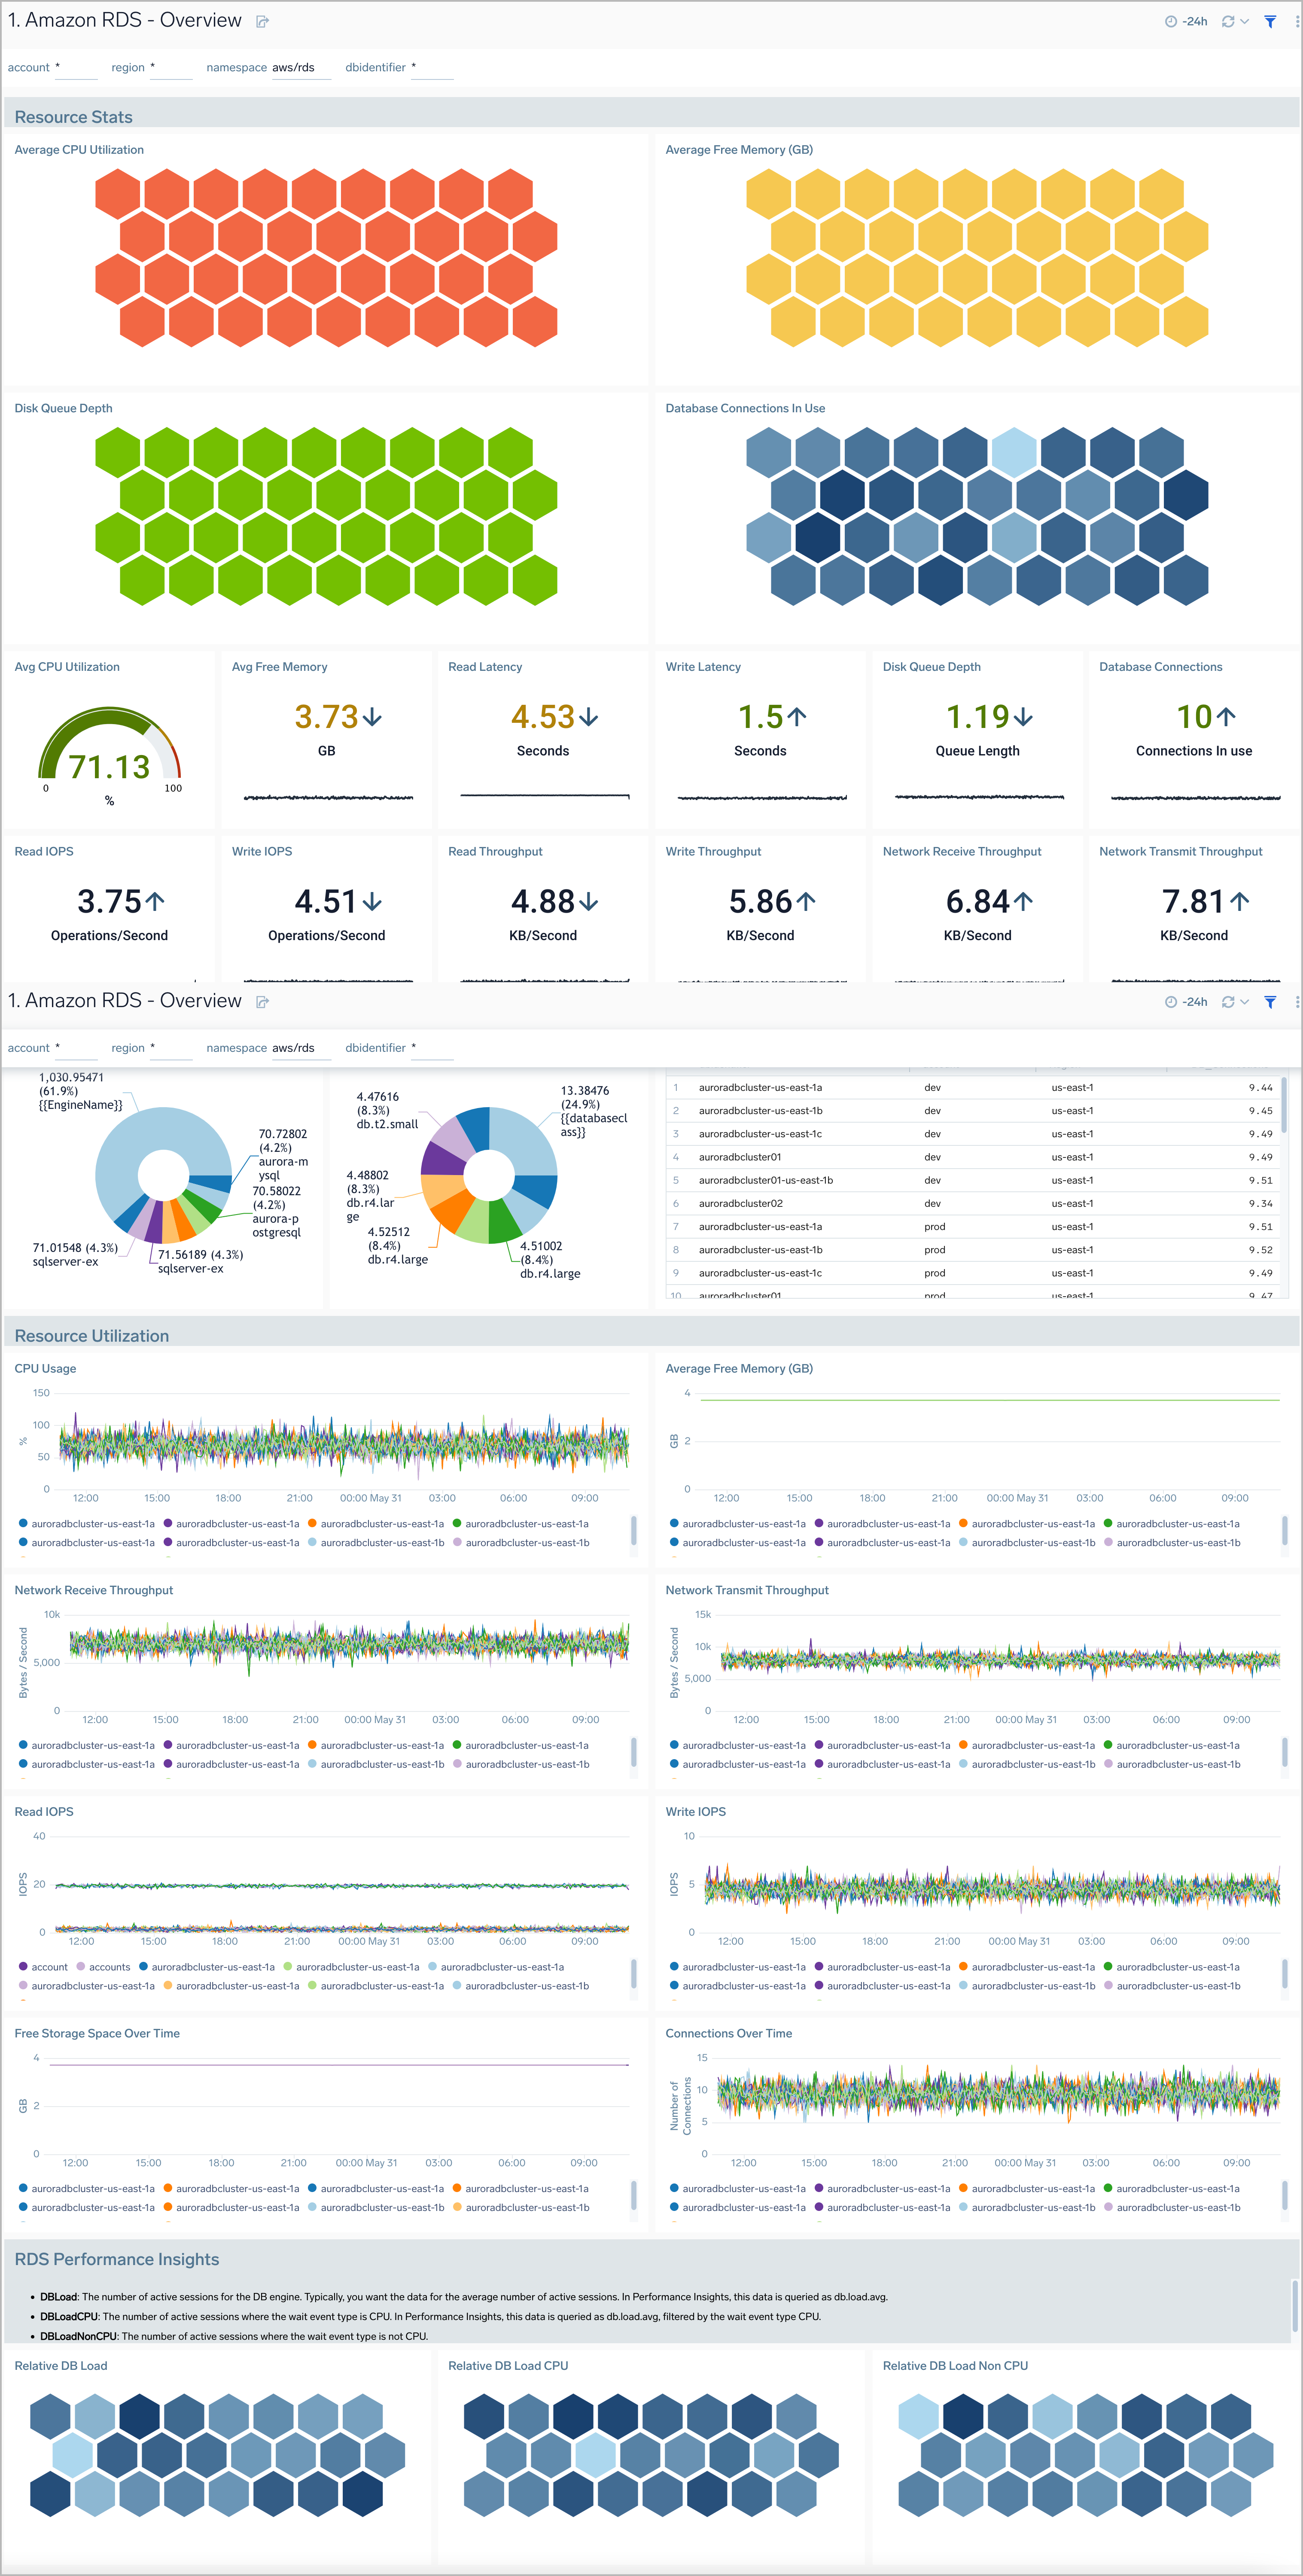
Overview
The Amazon RDS Overview dashboard provides insights into RDS resource statistics and utilization throughout your infrastructure, including CPU, memory, latency, storage, and network throughput.
Use this dashboard to:
- Get a high-level overview of your Amazon RDS infrastructure
- Quickly identify problems in resource utilization
- Monitor databases performance insights such as relative CPU Load, non-CPU load, and overall database load
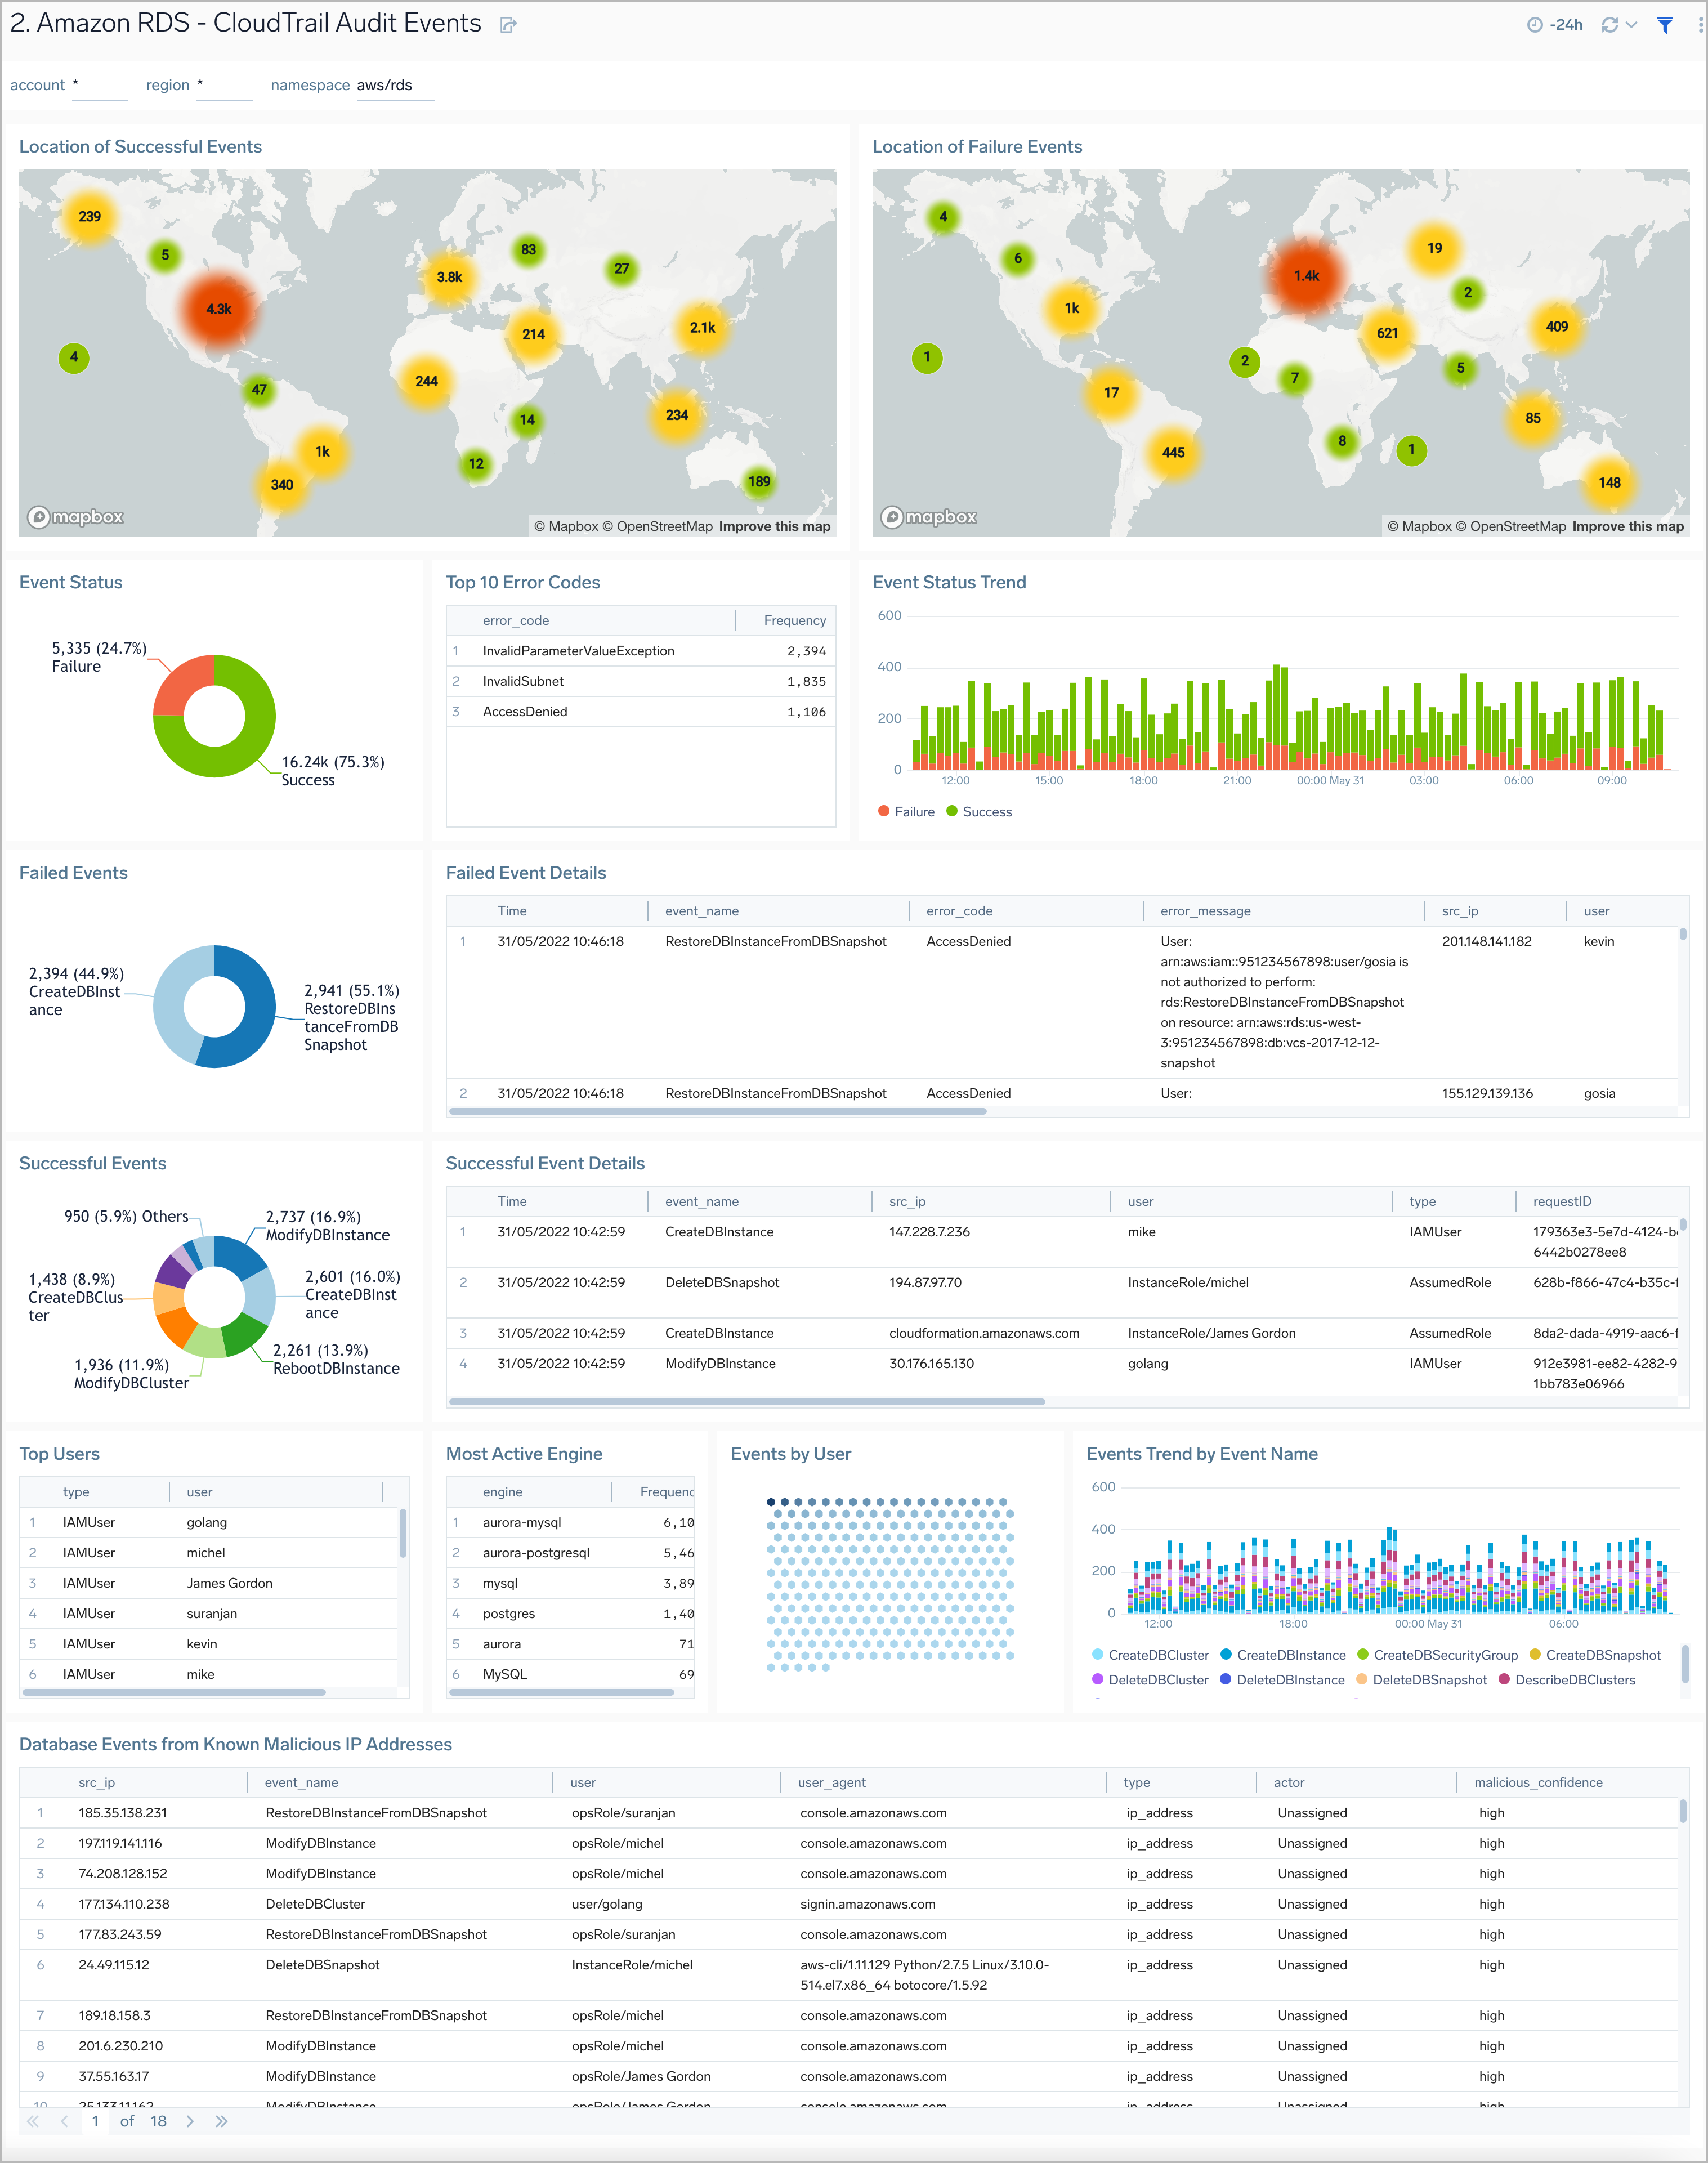
CloudTrail Audit Events
The Amazon RDS CloudTrail Audit Events dashboard provides insights into audit events of your database clusters.
Use this dashboard to:
- Monitor Amazon RDS-related audit logs using CloudTrail Events.
- Monitor locations of successful and failed Amazon RDS user activity events
- Monitor most active users working on RDS infrastructure, database engines used in the infrastructure, and various events invoked on RDS clusters
- Monitor requests from malicious IP addresses using Sumo Logic’s Threat Intel.
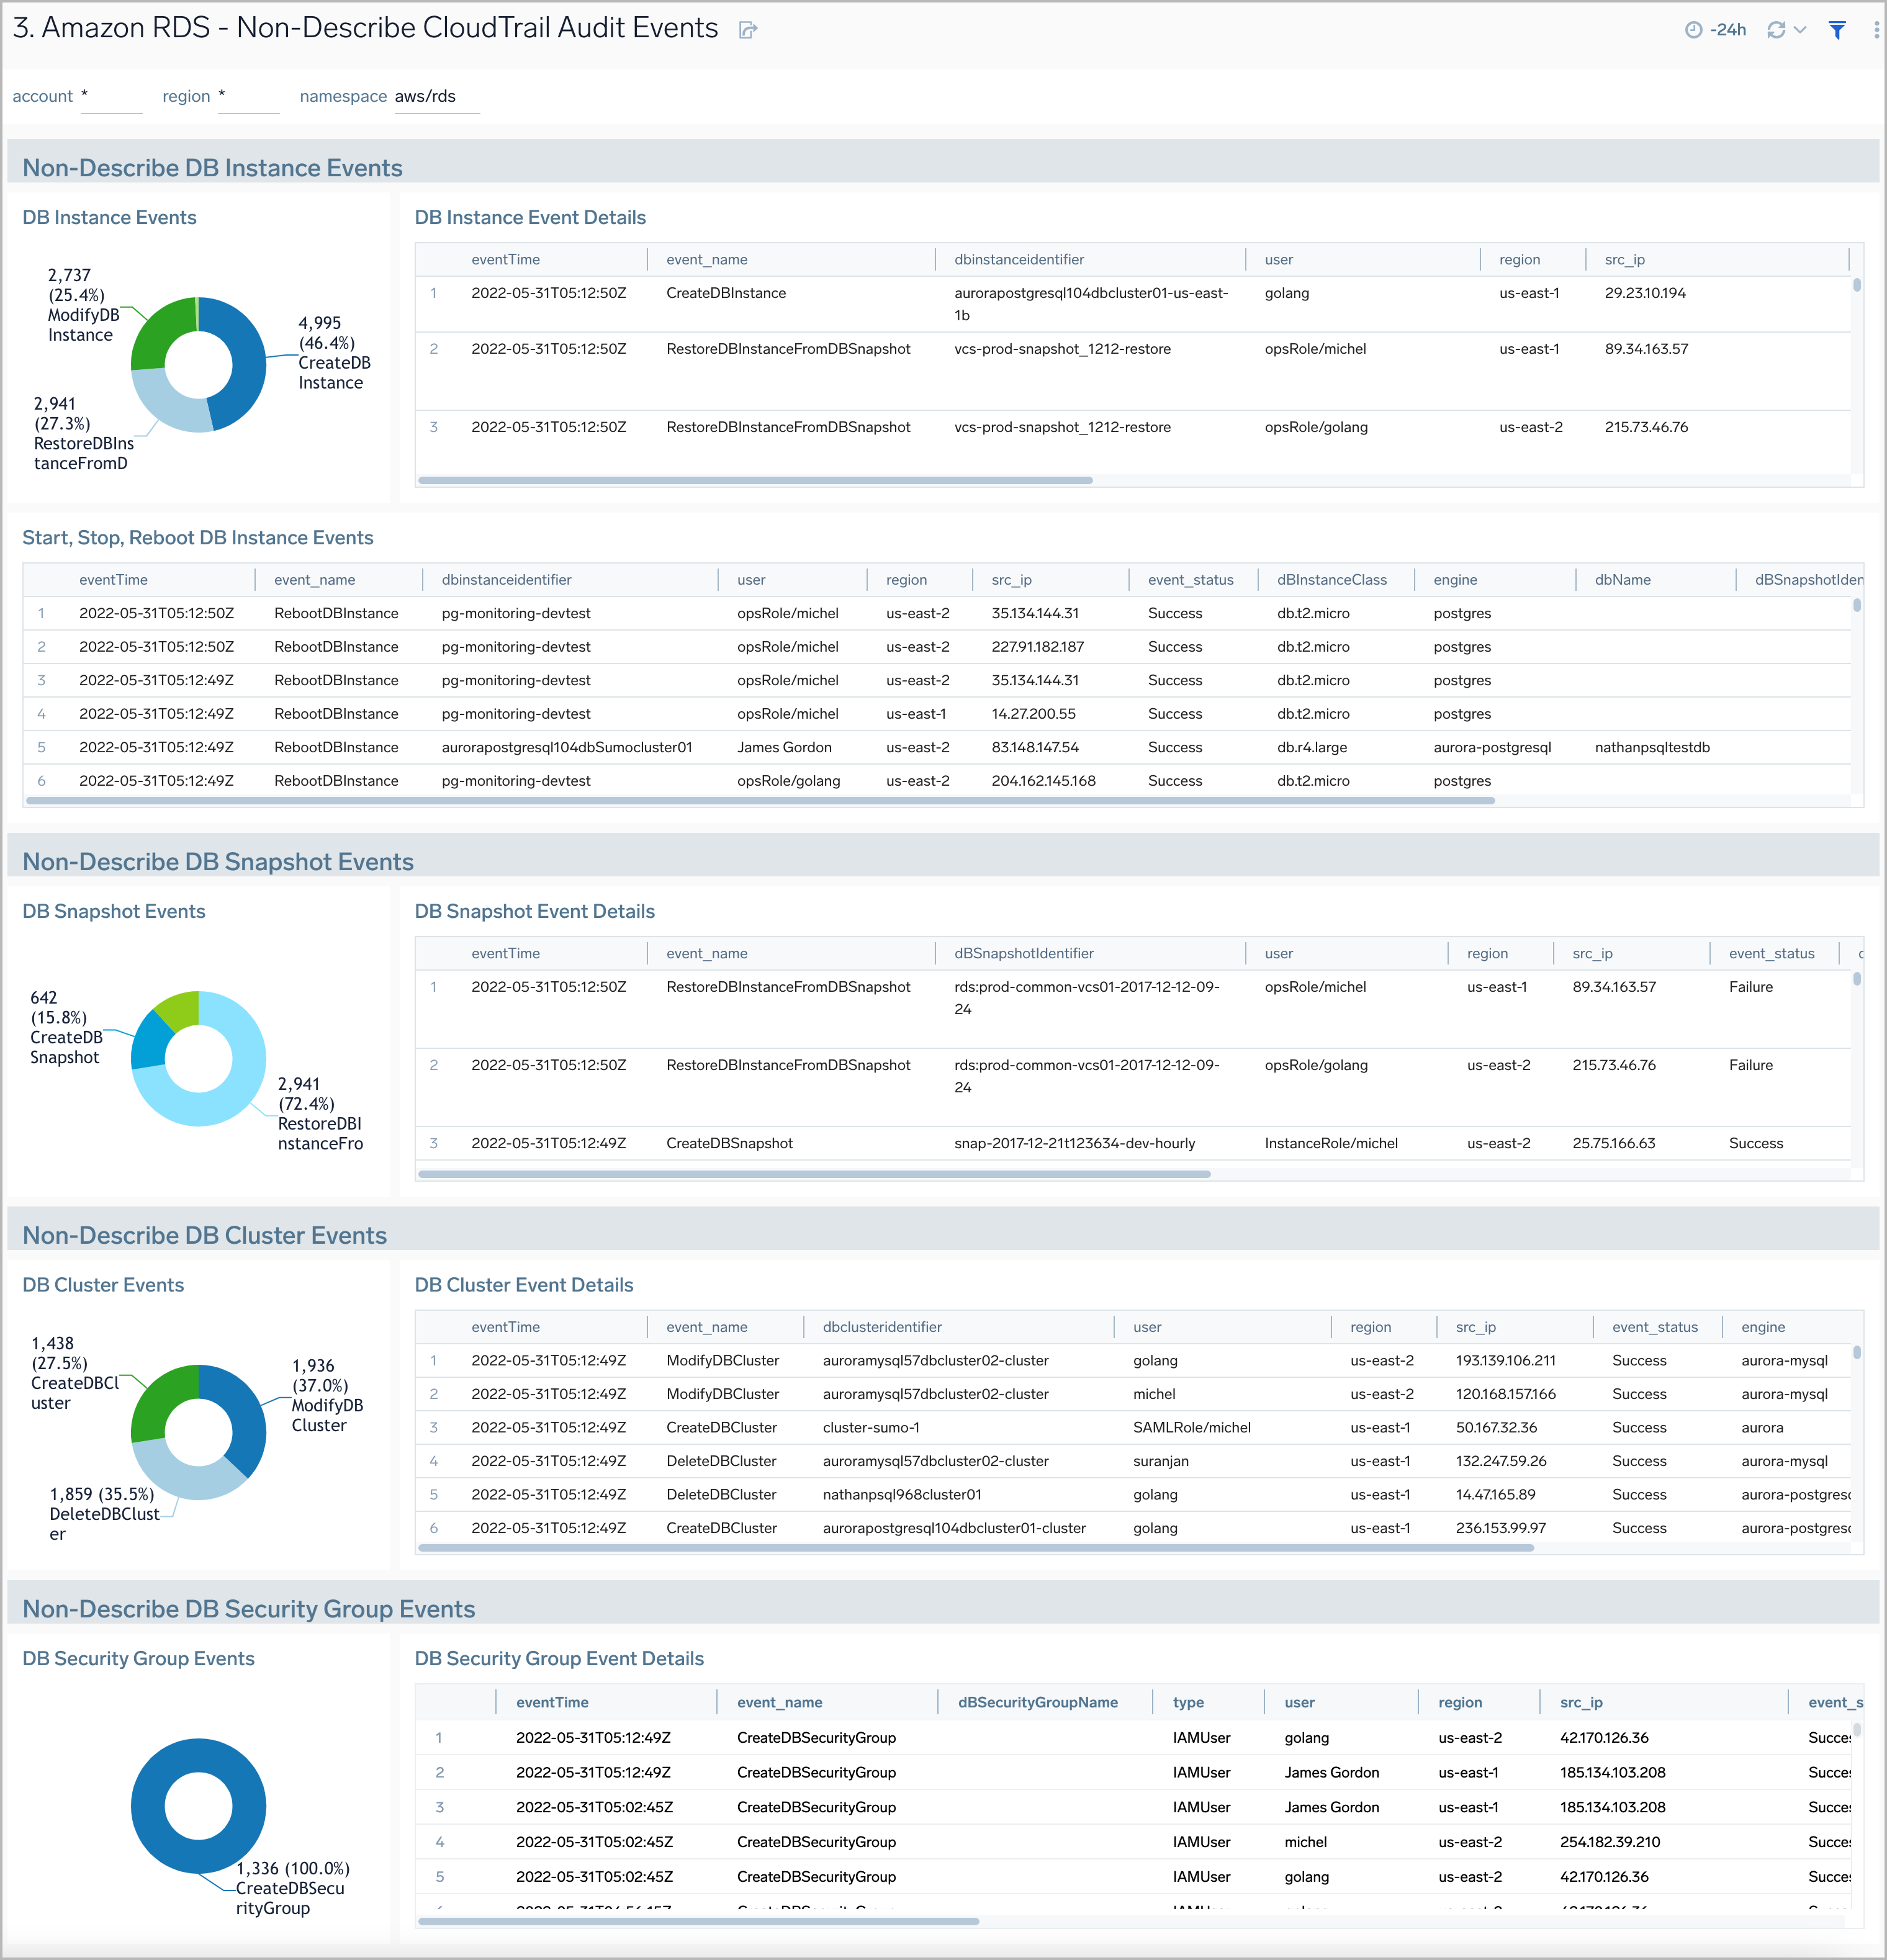
Non-Describe CloudTrail Audit Events
Amazon RDS Non-Describe CloudTrail Audit Events dashboard provides statistical and detailed insights into Non-Describe DB Instance, SnapShot, Cluster, and Security group events.
Use this dashboard to:
- Monitor Amazon RDS-related non-describe audit logs using CloudTrail Events.
- Monitor and track create, delete, update, start, stop, and reboot types of events on RDS instances.
- Monitor and track create, delete, modify, start, stop, and reboot types of events on RDS clusters.
- Monitor and track snapshot-related events performed on RDS instances.
- Monitor and track changes to security groups associated with your RDS infrastructure.
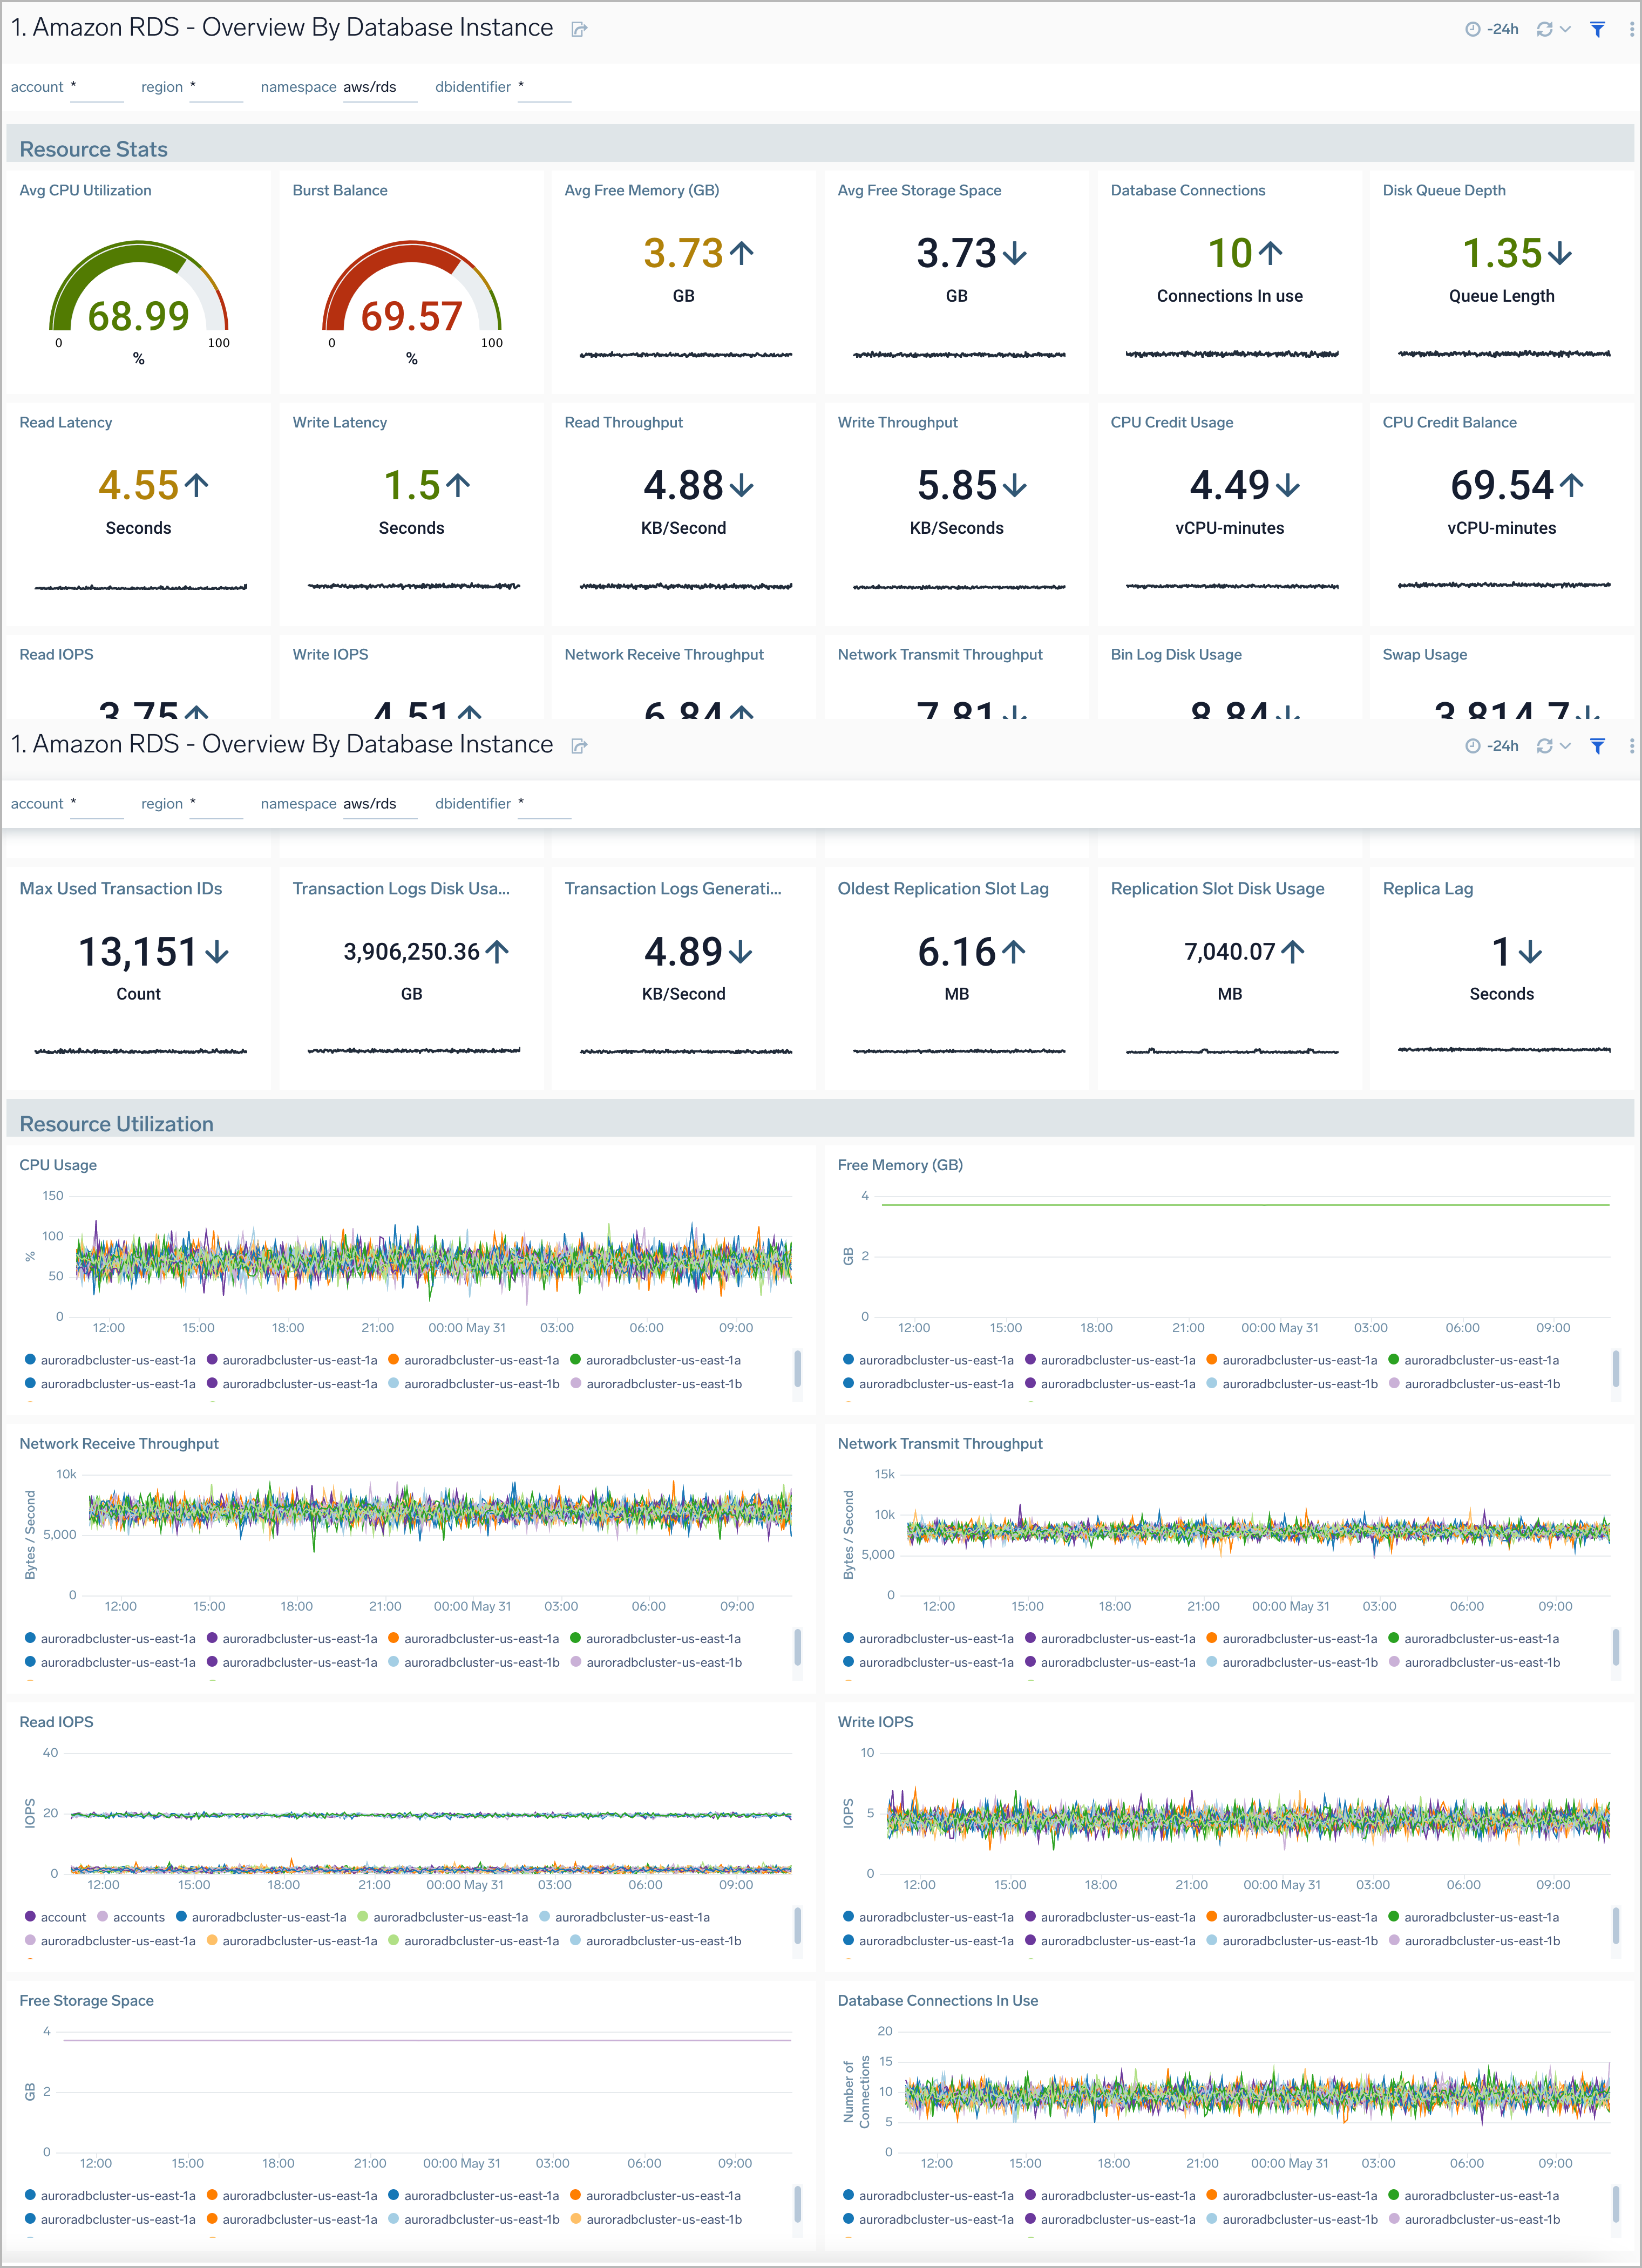
Overview By Database Instance
Amazon RDS Overview By Database Instance dashboard provides insights into resource statistics and utilization per database instance throughout your infrastructure. Panels display data for CPU, memory, latency, storage, and network throughput per database instance.
Use this dashboard to:
- Quickly identify performance or resource utlization issues in your RDS clusters
- Monitor resource utilization with trend panels for CPU usage, available memory, network receive and transmit throughput, read and write IOPS, available free storage and database connections across your Amazon RDS clusters and database instances.
Performance Insights
The Amazon RDS Performance Insights dashboard provides intuitive performance data from throughout your RDS infrastructure across CPU load, non-CPU load, active sessions, and performance trends.
Use this dashboard to:
- Monitor Amazon RDS DB instance loads to analyze and troubleshoot database performance
- Identify when the CPU is overloaded, so you can throttle connections to the instance, tune SQL queries with a high CPU load, or consider a larger instance class to remedy the situation.
- Identify high and consistent instances of any wait state (Non-CPU Load) that indicate potential bottlenecks or resource contention issues that need to be resolved, which can be an issue even when the load doesn't exceed maximum CPU.

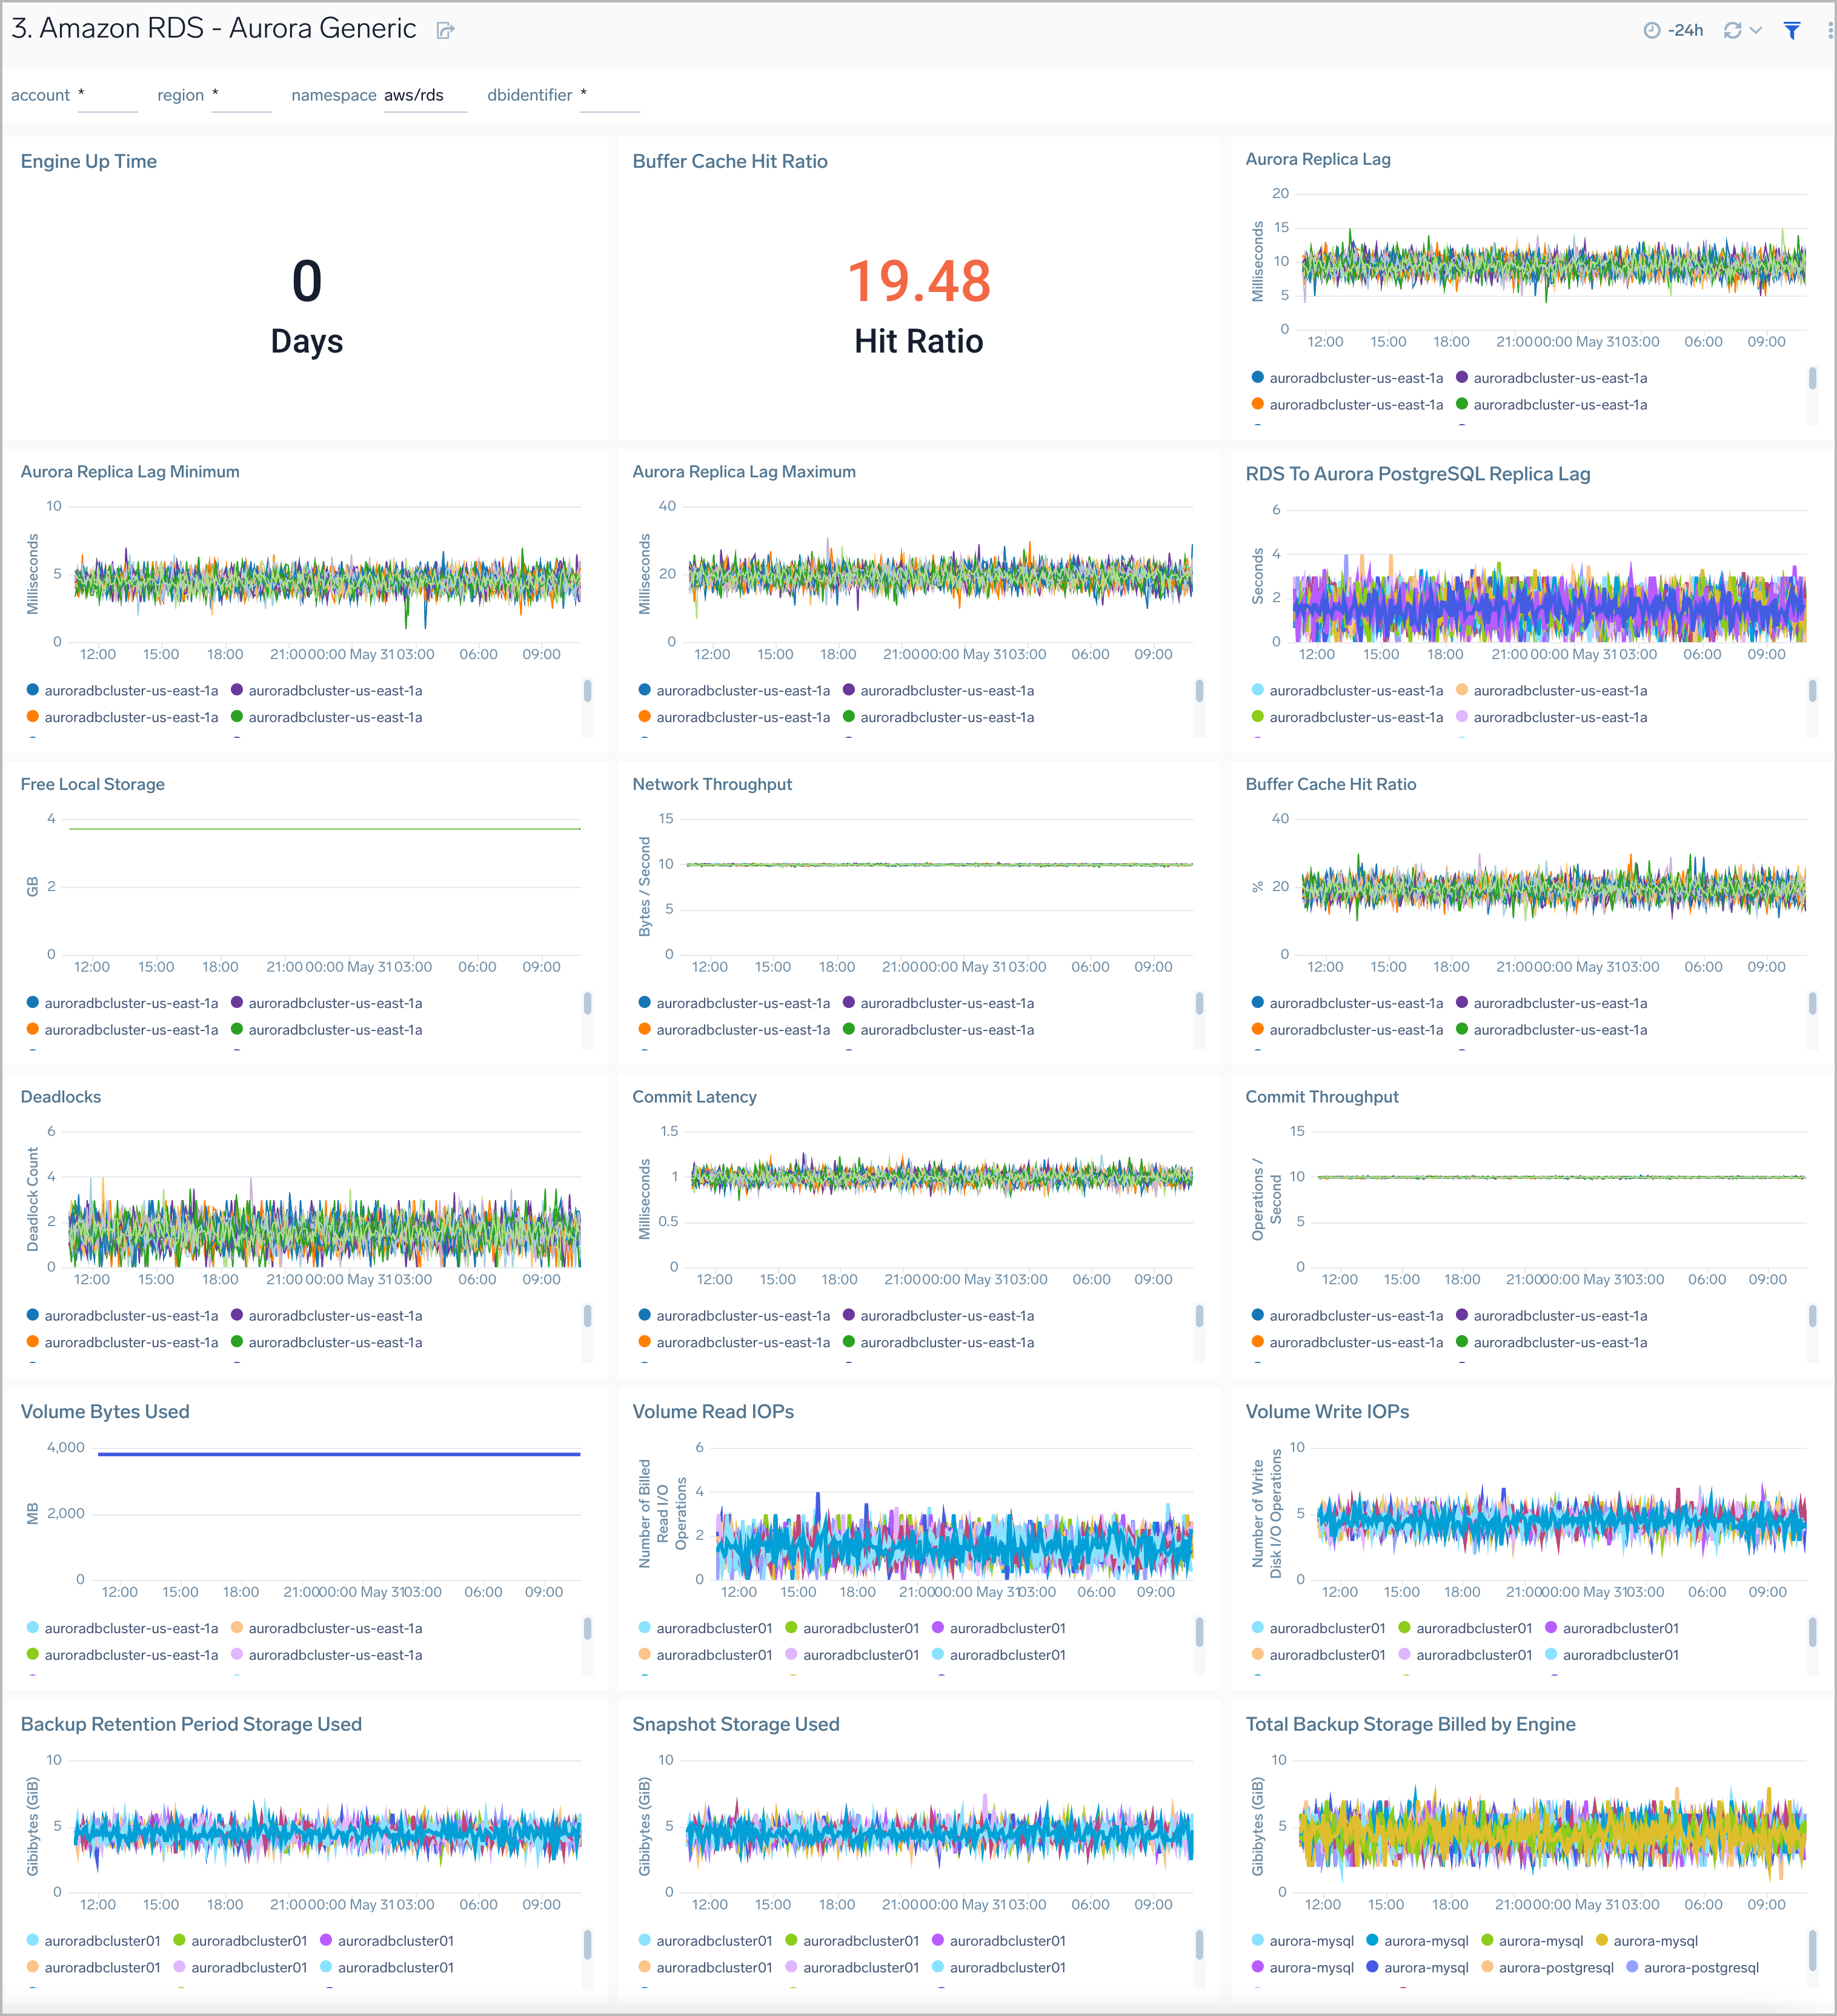
Aurora Generic
The Amazon RDS Aurora Generic dashboard provides generic AWS Aurora performance statistics across your infrastructure for uptime, replica lag, latency, network throughput, volume, and storage.
Use this dashboard to:
- Monitor common health and performance metrics of your RDS Amazon Aurora MySQL/PostgreSQL cluster.
- Monitor the lag when replicating updates from a primary instance
- Monitor the uptime of a database instance
- Monitor the amount of storage used to ensure monitor costs
- Monitor the percentage of requests that are served by the buffer cache to identify potential performance optimizations
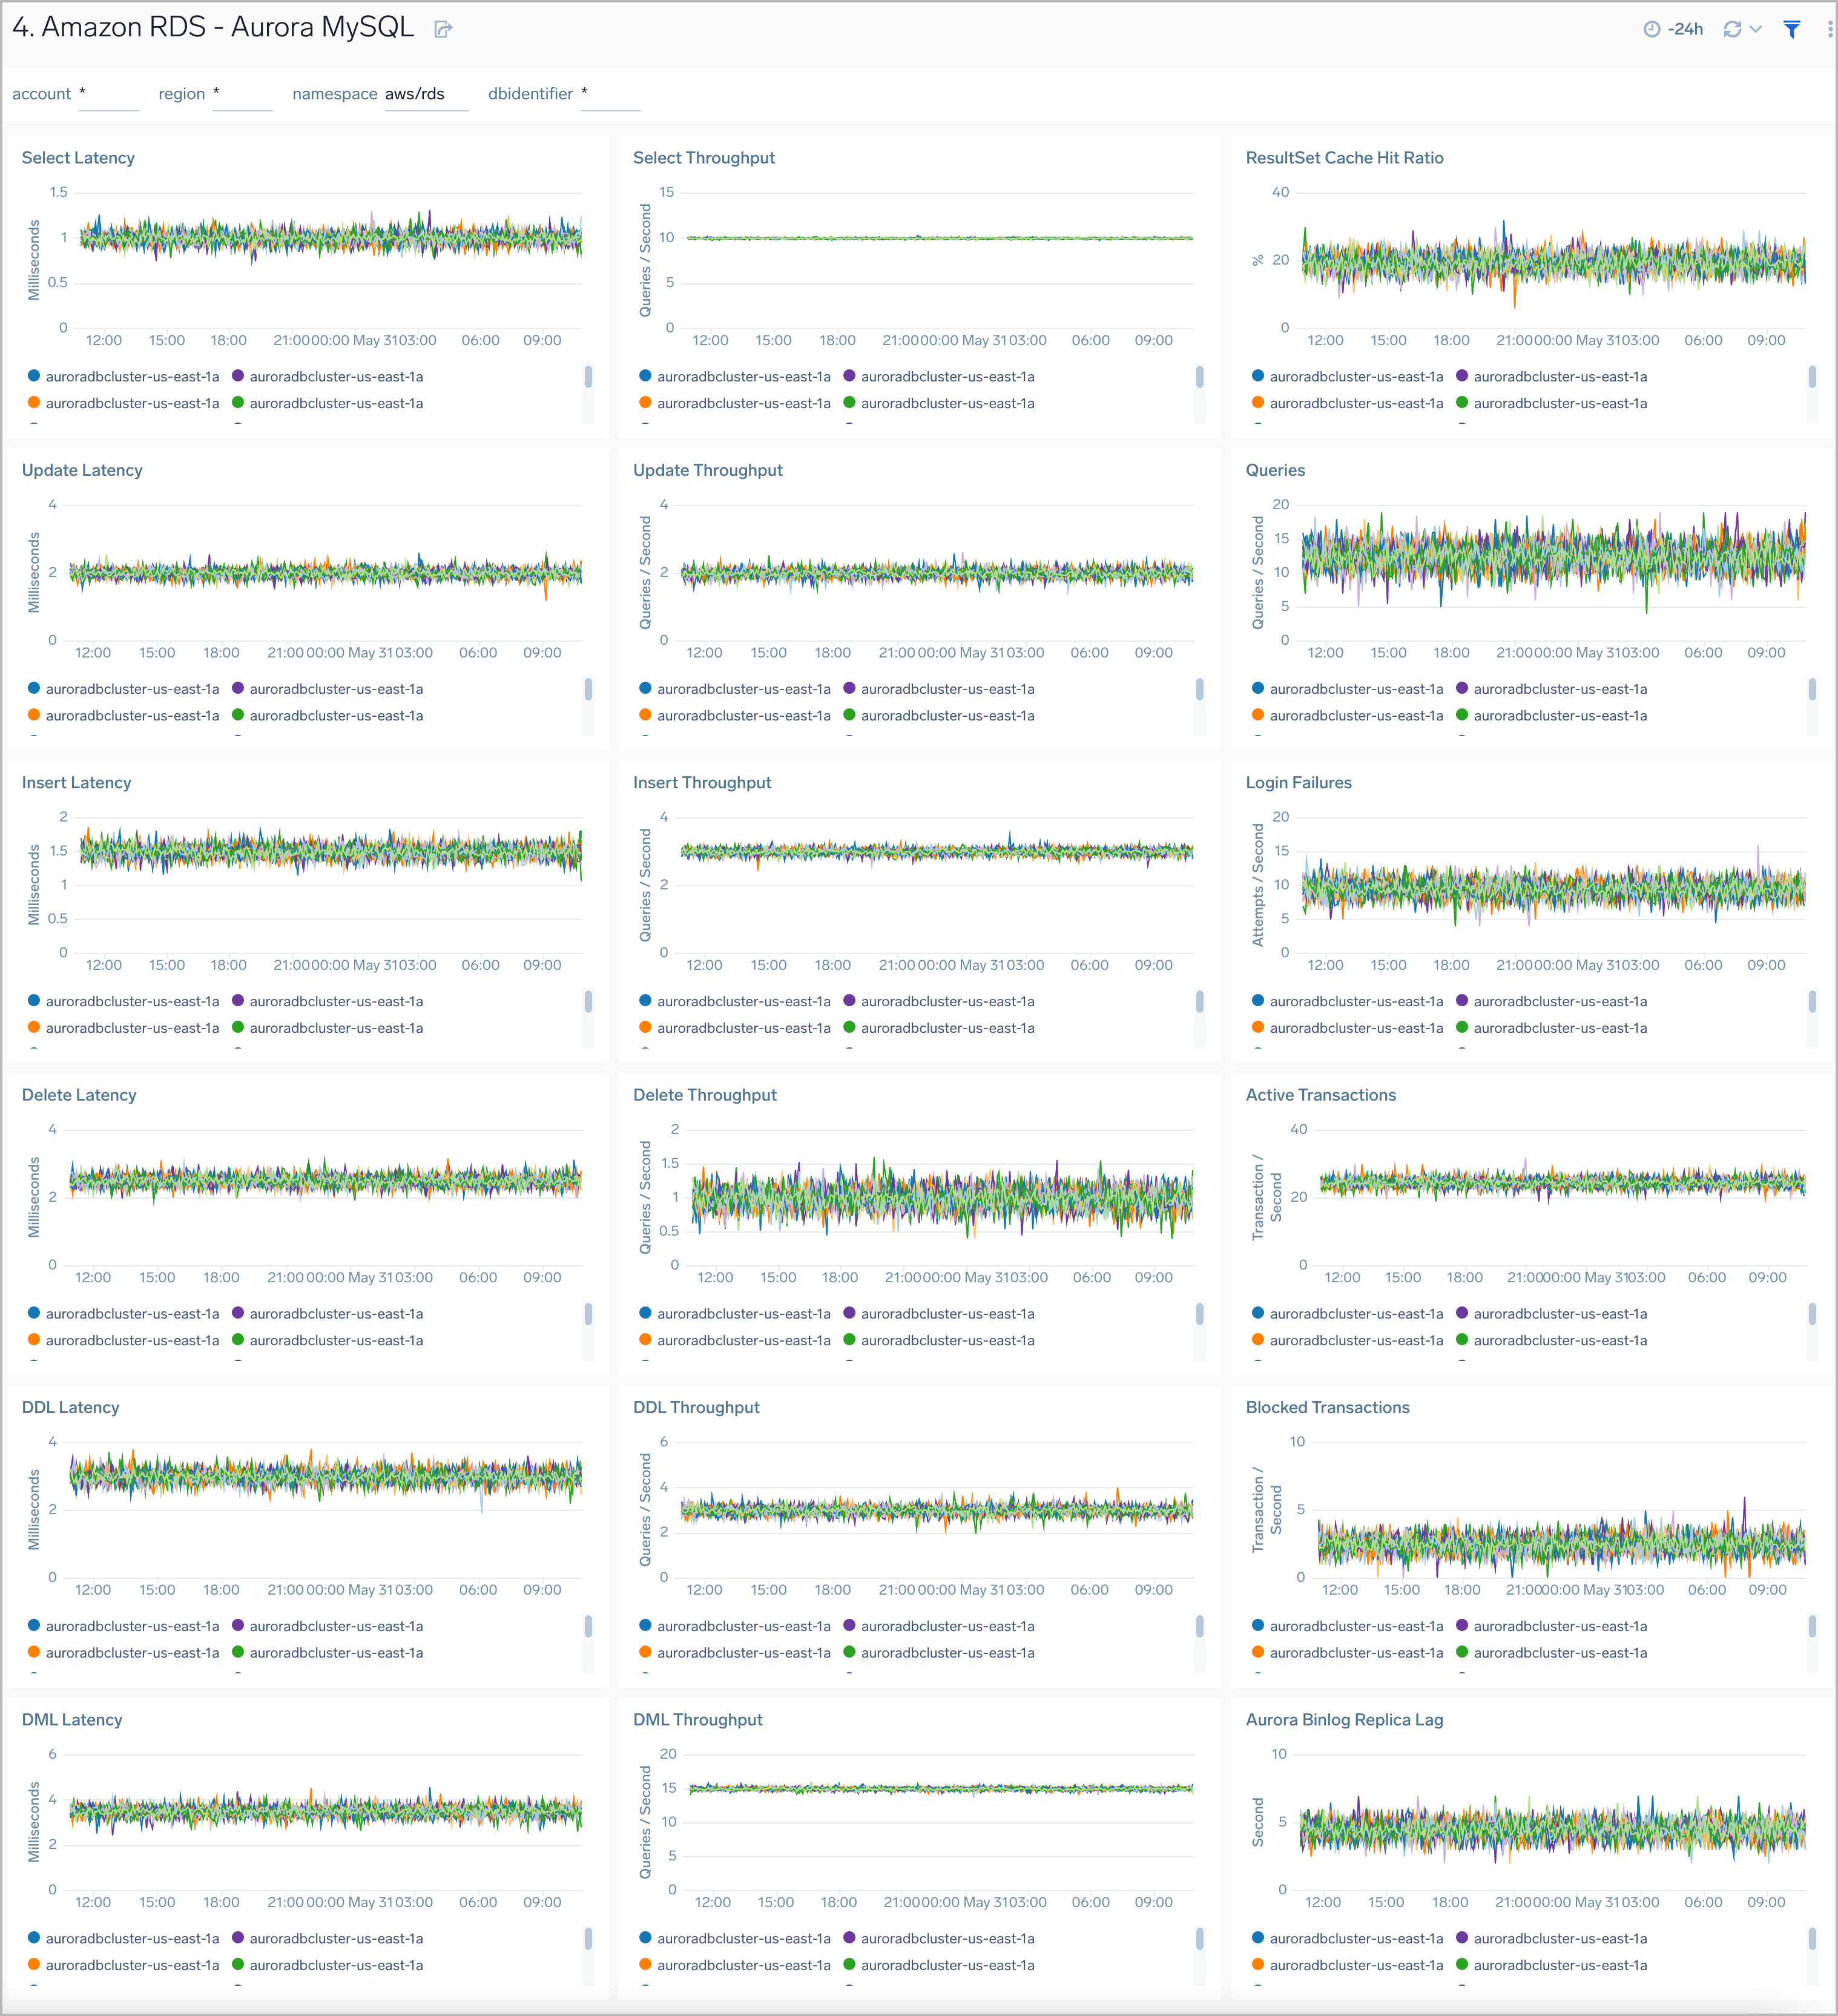
Aurora MySQL
Amazon RDS Aurora MySQL dashboard provides intuitive Aurora MySQL performance data from across your infrastructure for latency, throughput, active and blocked transactions, queries, login failures, and replica lag.
Use this dashboard to:
- Monitor the health and performance of your RDS Amazon Aurora MySQL instances and cluster.
- Monitor the throughput and latency associated with various types of queries executed on an Aurora MySQL instance.
- Monitor active transactions blocked transactions, and the rate of queries being executed.
- Monitor replica lag between Aurora DB clusters that are replicating across different AWS Regions.
- Monitor the number of login failures to the database, for security monitoring.
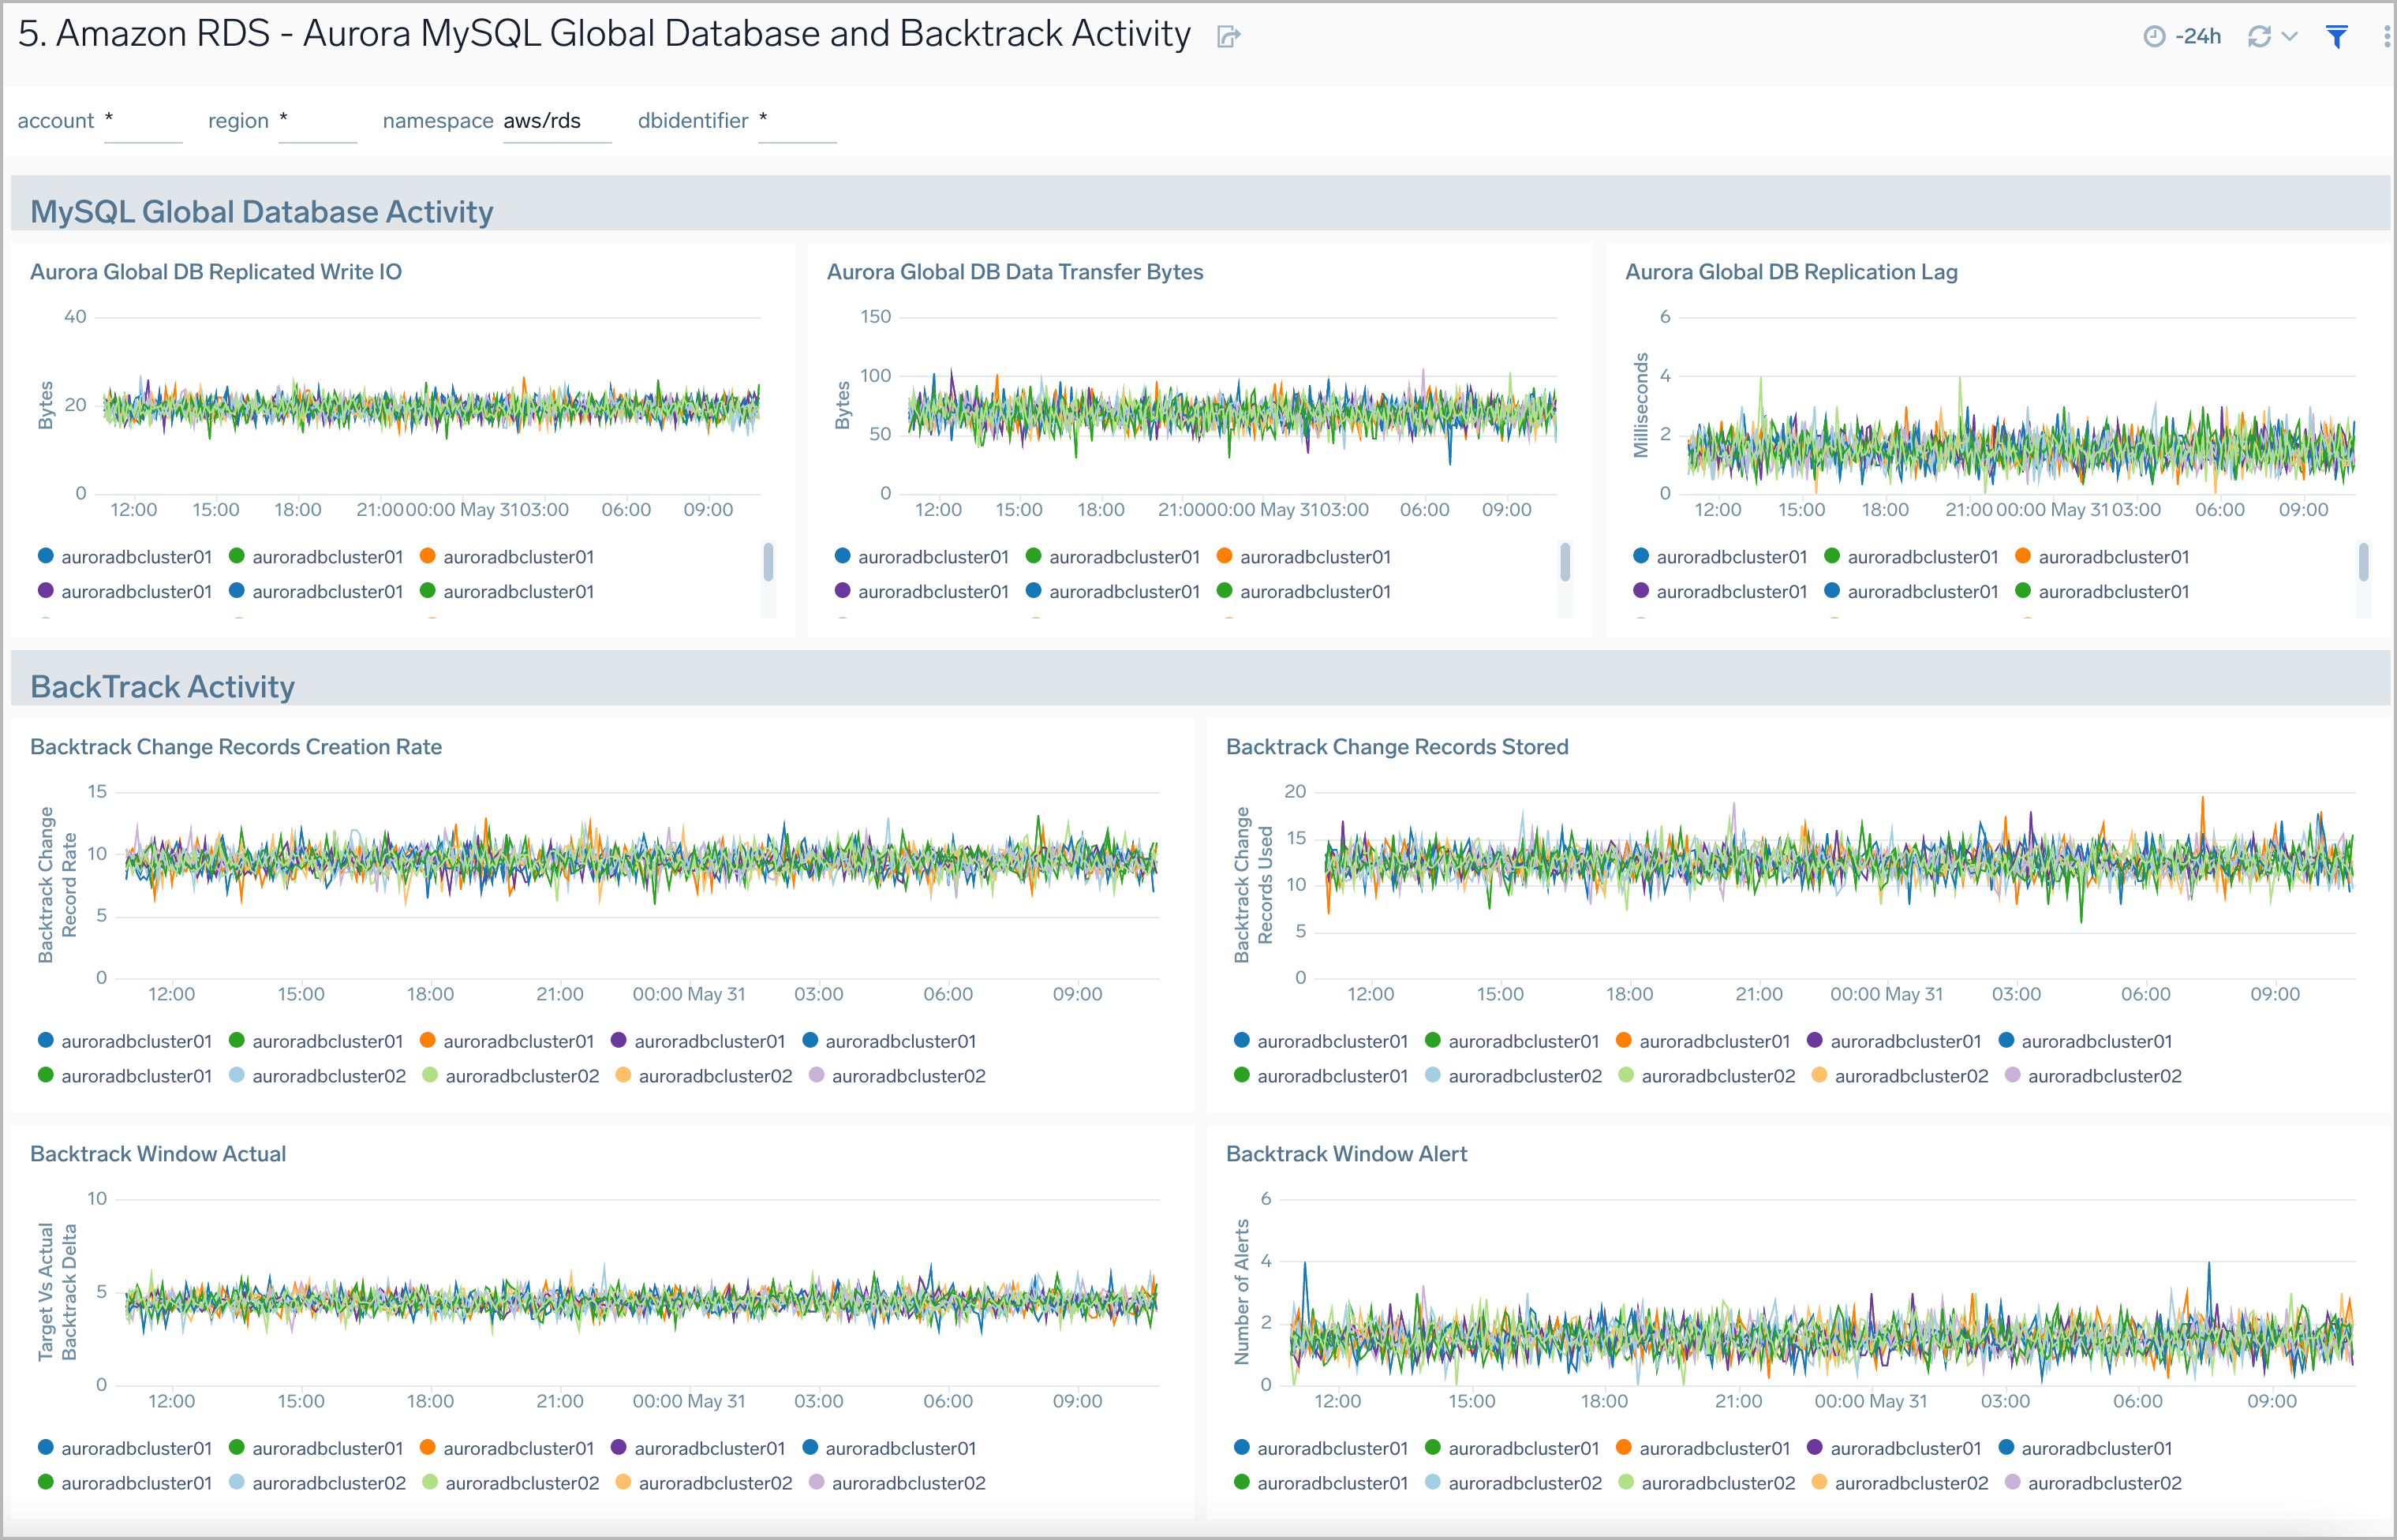
Aurora MySQL Global Database and BackTrack Activity
Amazon RDS Aurora MySQL Global Database and BackTrack Activity dashboard provides insights into Aurora MySQL performance data from across your infrastructure for Global Database activity and Backtrack activity.
Use this dashboard to:
- Monitor backtrack and Amazon Aurora Global database activity.
- Monitor BackTrack change records and the backtrack window of your RDS Amazon Aurora MySQL cluster.
- Monitor the amount of lag (in milliseconds) when replicating updates from the primary AWS Region for your Aurora Global database.
- Monitor the amount of redo log data that is transferred from the master AWS region to secondary AWS regions.
- Monitor the number of write I/O operations replicated from the primary AWS region to the cluster volume in a secondary AWS region in an Aurora Global Database. The billing calculations for the primary AWS region in a global database use AuroraGlobalDBReplicatedWriteIO to account for cross-region replication within the global database.