Sumo Logic Data Volume App (Legacy)
The Data Volume allows you to view at a glance your account's data usage volume by category, collector, source name, and hosts. The app uses predefined searches and a Dashboard that provide visibility into your environment for real-time analysis of overall usage.
Before you can use the Data Volume app, an administrator must first enable the feature. For more information, see Enable and Manage the Data Volume Index.
Once the Data Volume Index is enabled, volume data is not back filled to any time before the feature was enabled. Data is only provided from the time the feature is enabled forward.
Installing the Data Volume Legacy App
Your administrator must enable Data Volume from Administration > Account > Data Management before you can install this app.
The Data Volume Index gathers volume data as soon as it is enabled. It will not backfill data.
- From App Catalog, search for the Data Volume app.
- Click Data Volume.
- Click Add to Library, this will open a window. Within the window click on Advanced and choose a location to install the app.
- If Data Volume Logging is not enabled, select the toggle to enable it. Otherwise, the application will have no data to display. If the feature is already enabled, the toggle does not appear.
- Choose a location for Data Volume in your Personal folder.
- Click Add to Library. A dialog will confirm the app is installed successfully.
Viewing Data Volume Legacy Dashboards
For each Panel in the Dashboard, you can perform the following actions:
- To display details on the Panel time range, hover over the text in the top right corner.
- To zoom into the Panel for more information, click the magnifying glass icon in the header.
Overview
The Data Volume - Overview dashboard helps you understand how much data you are ingesting, and the collectors and source categories that contribute the most to ingested data volume.
Sumo Logic bills according to your total volume. The top half of the Data Volume - Overview dashboard presents information about log data volume; the bottom half covers metrics. From this dashboard, you can use the Ingest panels to drill down to more detailed dashboards on logs and metrics.
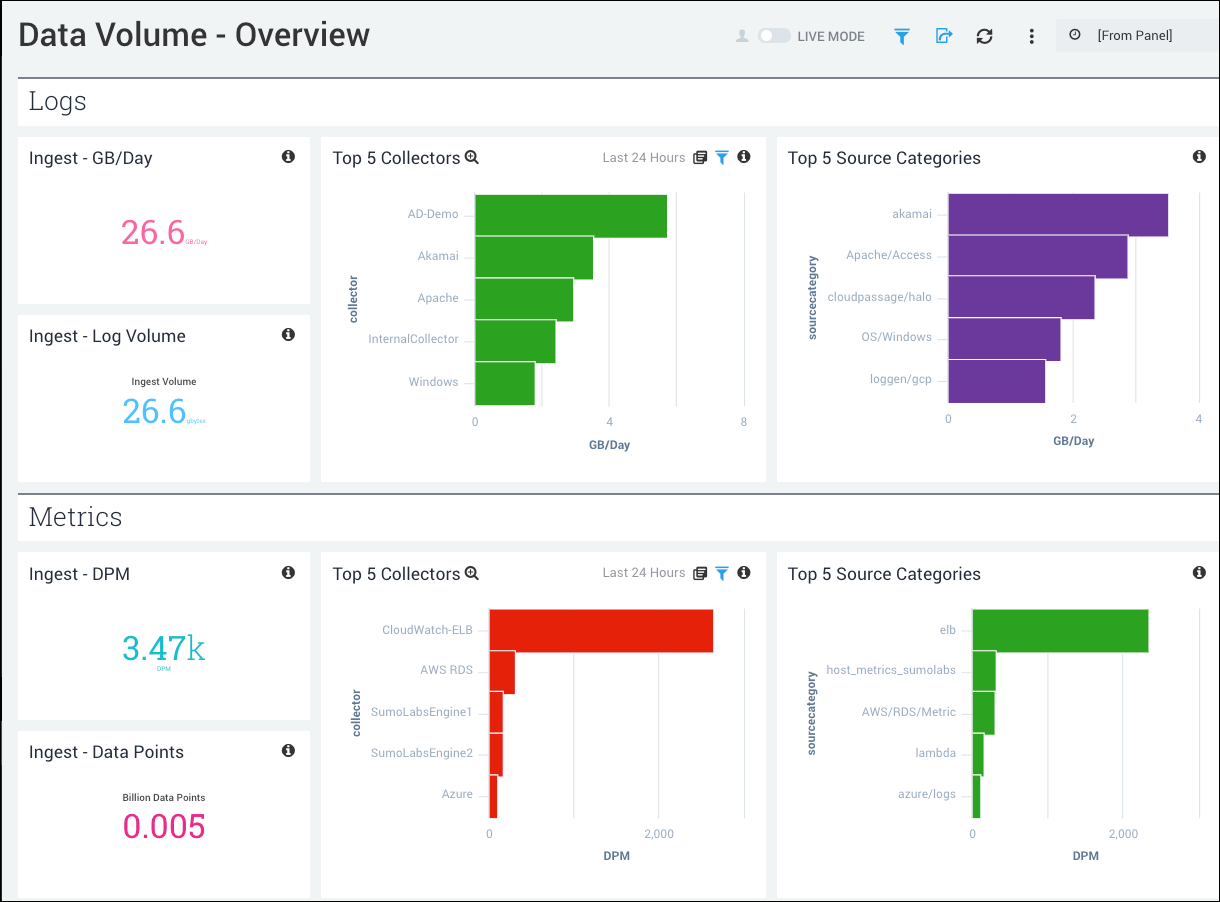
- Logs
- Ingest - GB/Day. Displays the total ingest volume in GB/day for your account over the last 24 hours. Click the panel to drill down on your most recent logs ingest data.
- Ingest - Log Volume. Displays the total logs ingest volume in GB for your account over the last 24 hours. Click the panel to drill down on your most recent logs ingest data.
- Top 5 Collectors. Displays the top 5 collectors and their volume usage in GB/day over the last 24 hours, displayed in a bar chart.
- Top 5 Source Categories. Displays the top 5 source categories and their volume usage in GB/day over the last 24 hours, displayed in a bar chart.
- Metrics
- Ingest - DPM. Data points per minute (DPM) for metrics for your account over the last 24 hours.
- Ingest - Data Points. Total data points for metrics for your account over the last 24 hours. Click the panel to drill down on your most recent metrics ingest data.
- Top 5 Collectors. Displays the top 5 collectors and their volume usage in DPM over the last 24 hours, displayed in a bar chart.
- Top 5 Source Categories. Displays the top 5 source categories and their volume usage in DPM over the last 24 hours, displayed in a bar chart.
Logs
The greatest data ingest typically comes from log volumes. From the Data Volume - Logs dashboard you can see your log ingest volume in greater detail, outlining ingest spikes, outliers, and quota.
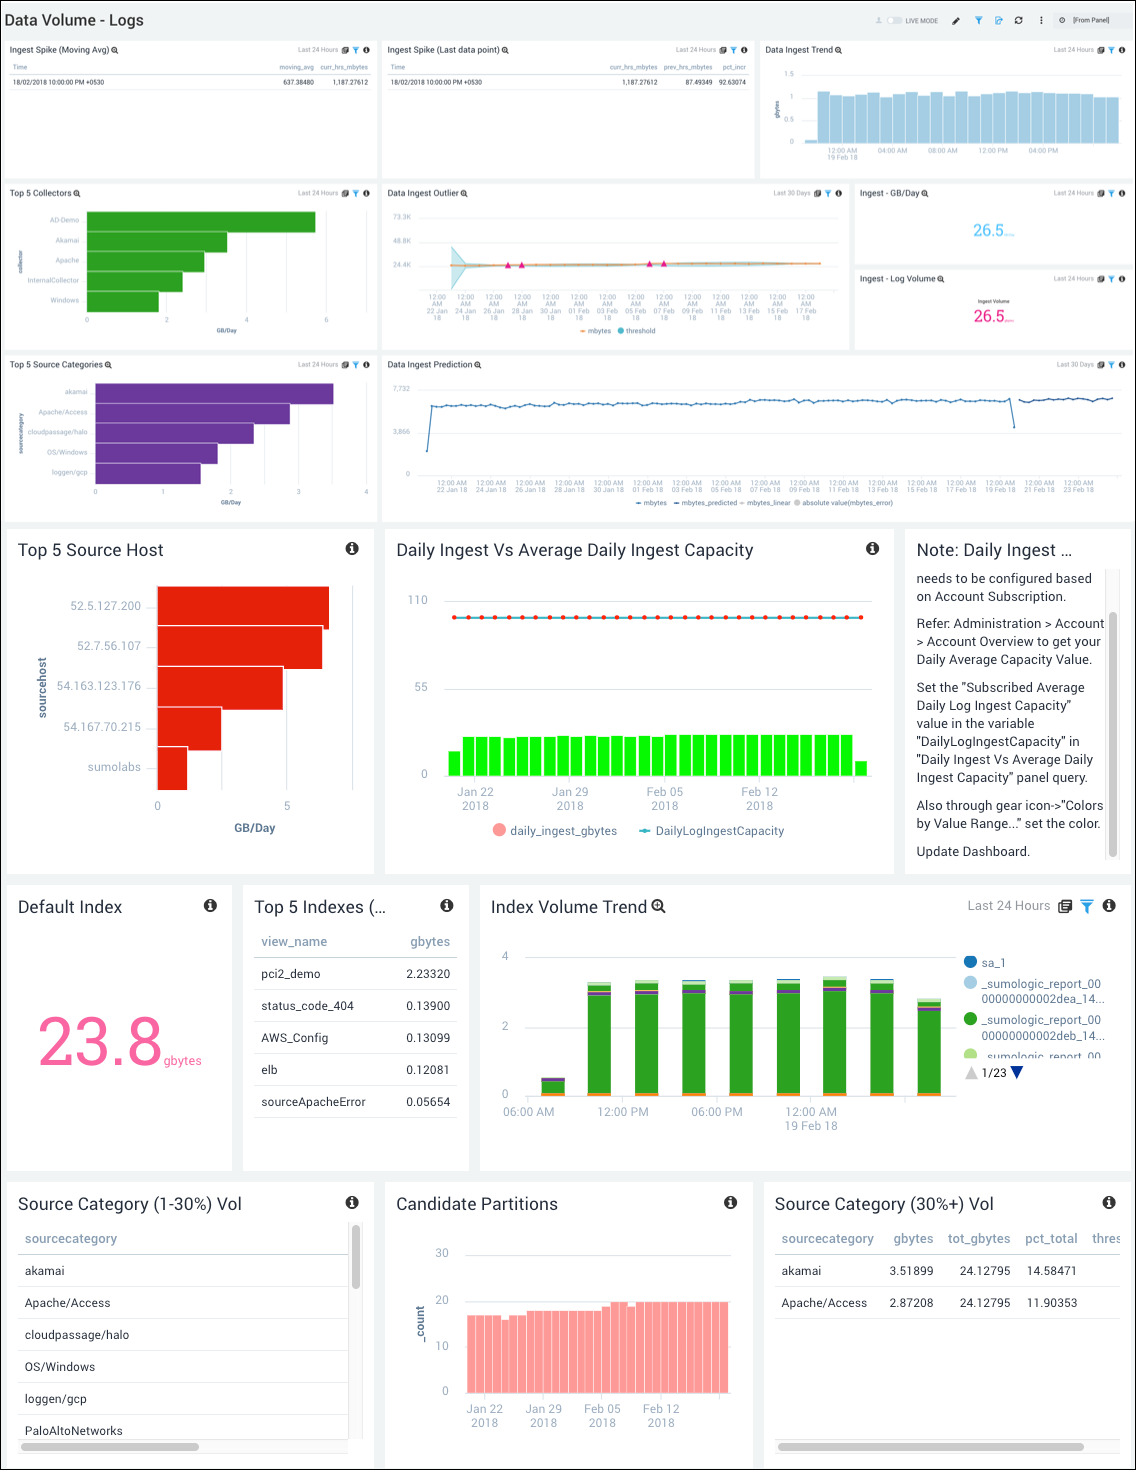
- Ingest Spike (Moving Avg). View incidents in the last 24 hours where current hour ingest is 70% above moving average ingest.
- Ingest Spike (Last Data Point). View incidents in the last 24 hours where current hour ingest is 50% above last (earlier) hour ingest.
- Data Ingest Trend. Displays log data ingestion, in GB, over time, in a histogram.
- Top 5 Collectors. Displays the top 5 collectors and their volume usage in GB/day, over the last 24 hours, displayed in a bar chart.
- Data Ingest Outlier. Identifies where ingest has gone outside the specified threshold during the last 30 days.
- Ingest - GB/Day. Log ingest volume in GB/day for the last 24 hours.
- Ingest - Log Volume. Total log ingest volume in GB for the last 24 hours.
- Top 5 Source Categories. Displays the top 5 source categories and their volume usage in GB/day over the last 24 hours, displayed in a bar chart.
- Data Ingest Prediction. Displays current usage for the last 30 days and forecasts your data ingest up to 20 data points into the future. You can see the line break between actual ingest and predicted ingest at the current date.
- Top 5 Source Hosts. Displays the top 5 source hosts by IP address and their volume usage in GB/day over the last 24 hours, displayed in a bar chart.
- Daily Ingest Vs Average Daily Ingest Capacity. Configure the Subscribed Average Daily Ingest Capacity value based on your Account Subscription. See Administration > Account > Account Overview to see your Daily Average Capacity Value. Set the "Subscribed Average Daily Log Ingest Capacity" value in the variable "DailyLogIngestCapacity" in the Daily Ingest Vs Average Daily Ingest Capacity panel query, or by choosing Settings > "Colors by Value Range" and setting the color. Then update your dashboard. Once you've updated your dashboard, you'll be able to compare your current ingest to your capacity and review any overages.
- Default Index. Shows the volume of log data, in GB, ingested to the default index over the last 24 hours.
- Top 5 Indexes (Non-Default). Lists the five indices, other than the default index, that have ingested the most log data over the last 24 hours, and the amount in GB ingested by each.
- Index Volume Trend. This stacked bar chart shows log ingestion by index, over the last 24 hours, by 3 hour timeslices.
- Source Category (1-30%) Vol. Displays an aggregation table of all sources that take up between 1 and 30% of the Data Volume in Sumo to help you identify normal-volume sources.
- Candidate Partitions. Displays a bar chart showing the total number of available partitions in the account for the last 30 days to give you a visualization of the number of partitions in your account, contributing to your total data volume.
- Source Category (30%+) Vol. Displays an aggregation table of all sources that take up 30% or more of the Data Volume in Sumo to help you identify high-volume sources and make changes if needed.
Data Volume (Logs) by various metadata fields
You can also drill down on source metadata, using the metadata you've created within Sumo to better define your log sources.
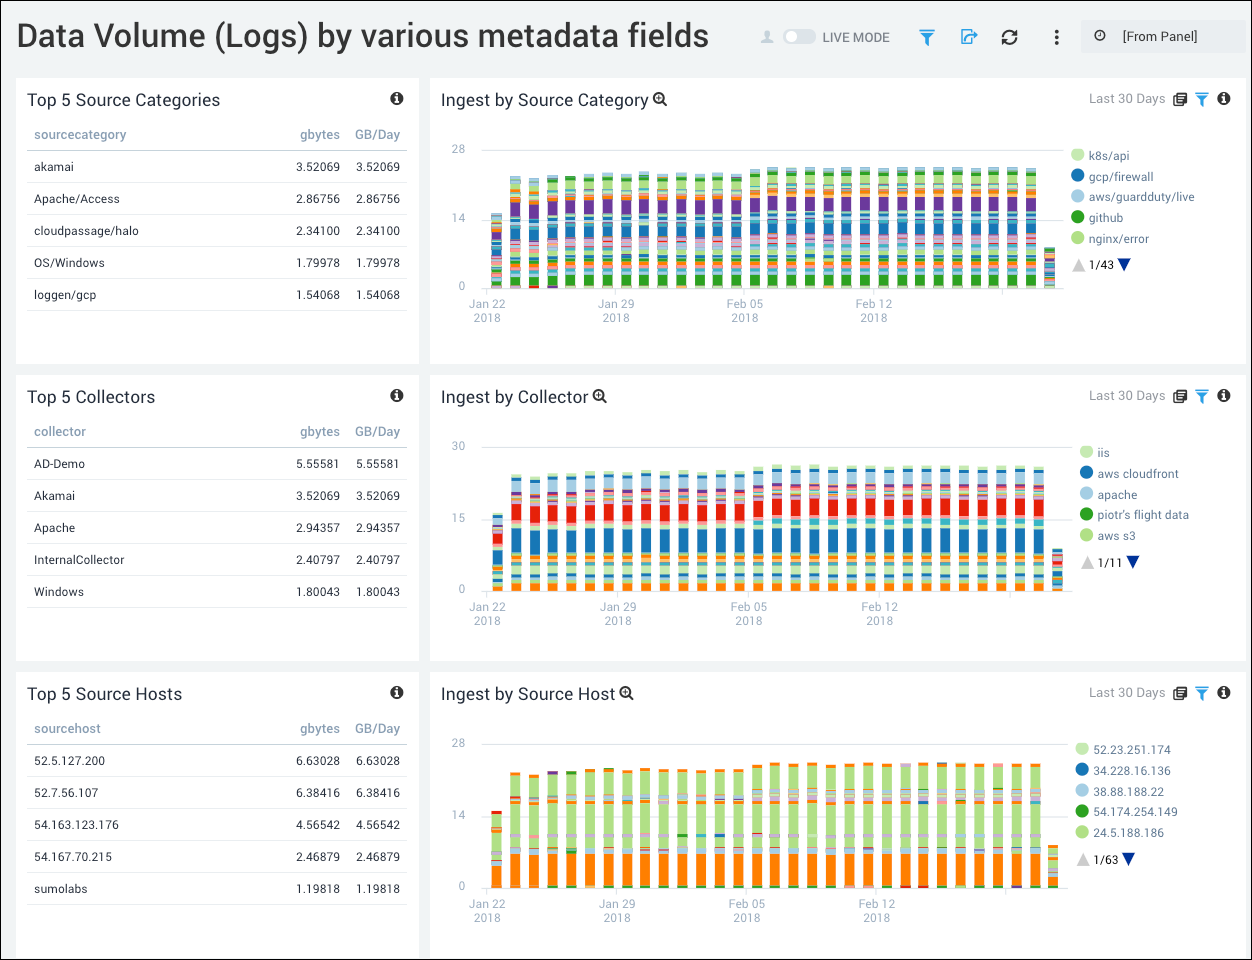
- Top 5 Source Categories. Displays the top 5 source categories and their volume usage in GB, and GB/day, over the last 24 hours, displayed in an aggregation table.
- Ingest by Source Category. Displays a bar chart of ingested sources for the last 30 days, timesliced by 1 day.
- Top 5 Collectors. Displays the top 5 collectors and their volume usage in GB, and GB/day, over the last 24 hours, displayed in an aggregation table.
- Ingest by Collector. Displays a bar chart of data ingested by collectors for the last 30 days, timesliced by every 1 day.
- Top 5 Source Hosts. Displays the top 5 source hosts by IP address and their volume usage in GB, and GB/day, over the last 24 hours, displayed in an aggregation table.
- Ingest by Source Host. Displays a bar chart of data ingested by source hosts for the last 30 days, timesliced by 1 day.
Metrics
Another point of volume ingest is metrics. We measure metric ingest for your account in data points and data points per minute (DPM). Use this Dashboard to review details of your data ingest and to identify areas of high-volume ingest.
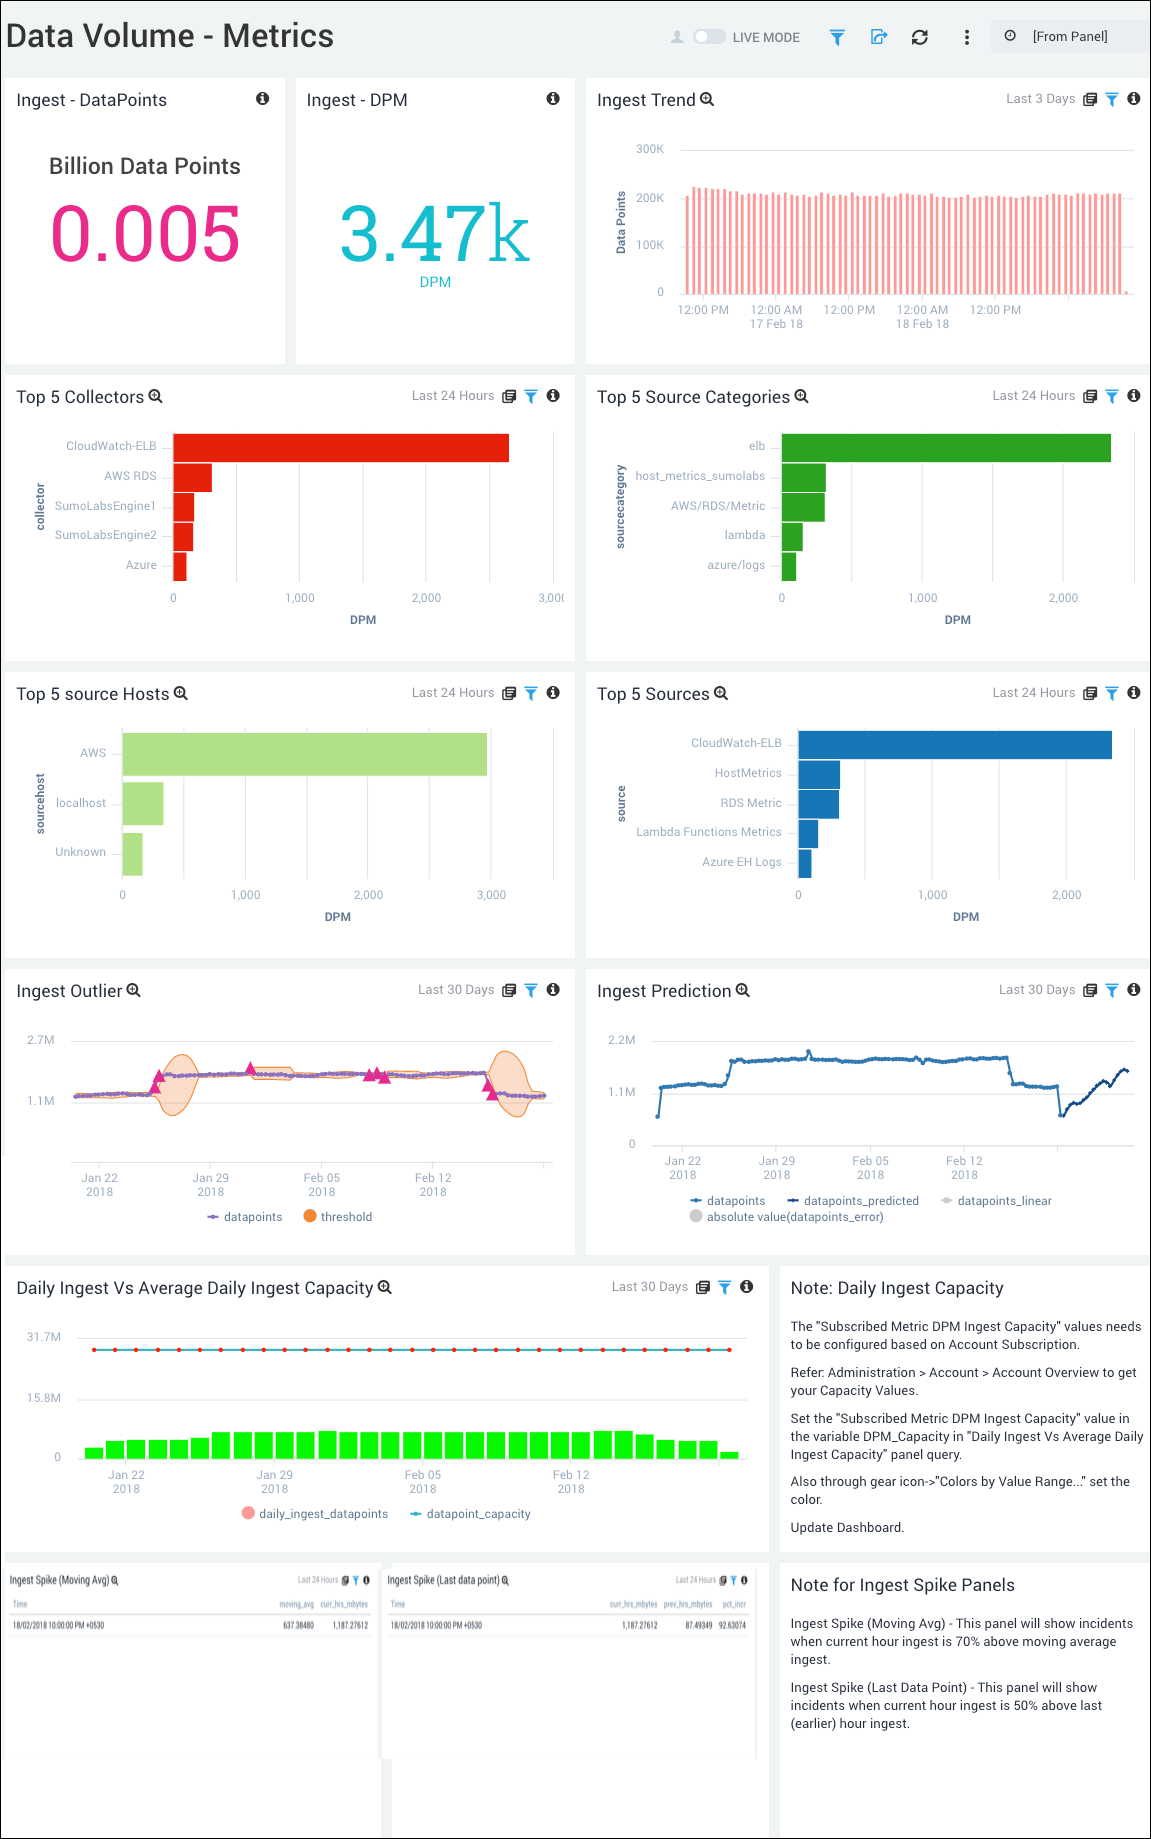
- Ingest - Data Points. Total data points for metrics for your account over the last 24 hours.
- Ingest - DPM. Data points per minute (DPM) for metrics for your account over the last 24 hours.
- Ingest trend. View your metrics ingest volume over the last 3 days, time sliced by hour.
- Top 5 Collectors. Displays the top 5 collectors and their volume usage in DPM over the last 24 hours, displayed in a bar chart.
- Top 5 Source Categories. Displays the top 5 source categories and their volume usage in DPM over the last 24 hours, displayed in a bar chart.
- Top 5 Source Hosts. Displays the top 5 source hosts and their volume usage in DPM for the last 24 hours, displayed as a bar chart.
- Top 5 Sources. Displays the top 5 sources and their data volume usage in DPM for the last 24 hours, displayed as a bar chart.
- Ingest Outlier. Identifies when data points were outside the designated threshold for ingest for the last 30 days.
- Ingest Prediction. Identifies your data point ingest 20 data points into the future, time sliced by 6 hours for the last 30 days.
- Daily Ingest vs. Average Daily Ingest Capacity. The "Subscribed Metric DPM Ingest Capacity" values needs to be configured based on Account Subscription. See Administration > Account > Account Overview to see your Capacity Values. Set the "Subscribed Metric DPM Ingest Capacity" value in the "DPM_Capacity variable" in the "Daily Ingest Vs Average Daily Ingest Capacity" panel query, or by clicking the gear icon and choosing Settings > Colors by Value Range and setting the color. Then update your dashboard. Once you've updated your dashboard, you'll be able to compare your current ingest to your capacity and review any overages.
- Ingest Spike (Moving Avg). View incidents in the last 24 hours where current hour ingest is 70% above moving average ingest.
- Ingest Spike (Last Data Point). View any incidents in the last 24 hours where current hour ingest is 50% above last (earlier) hour ingest.
Log Spikes
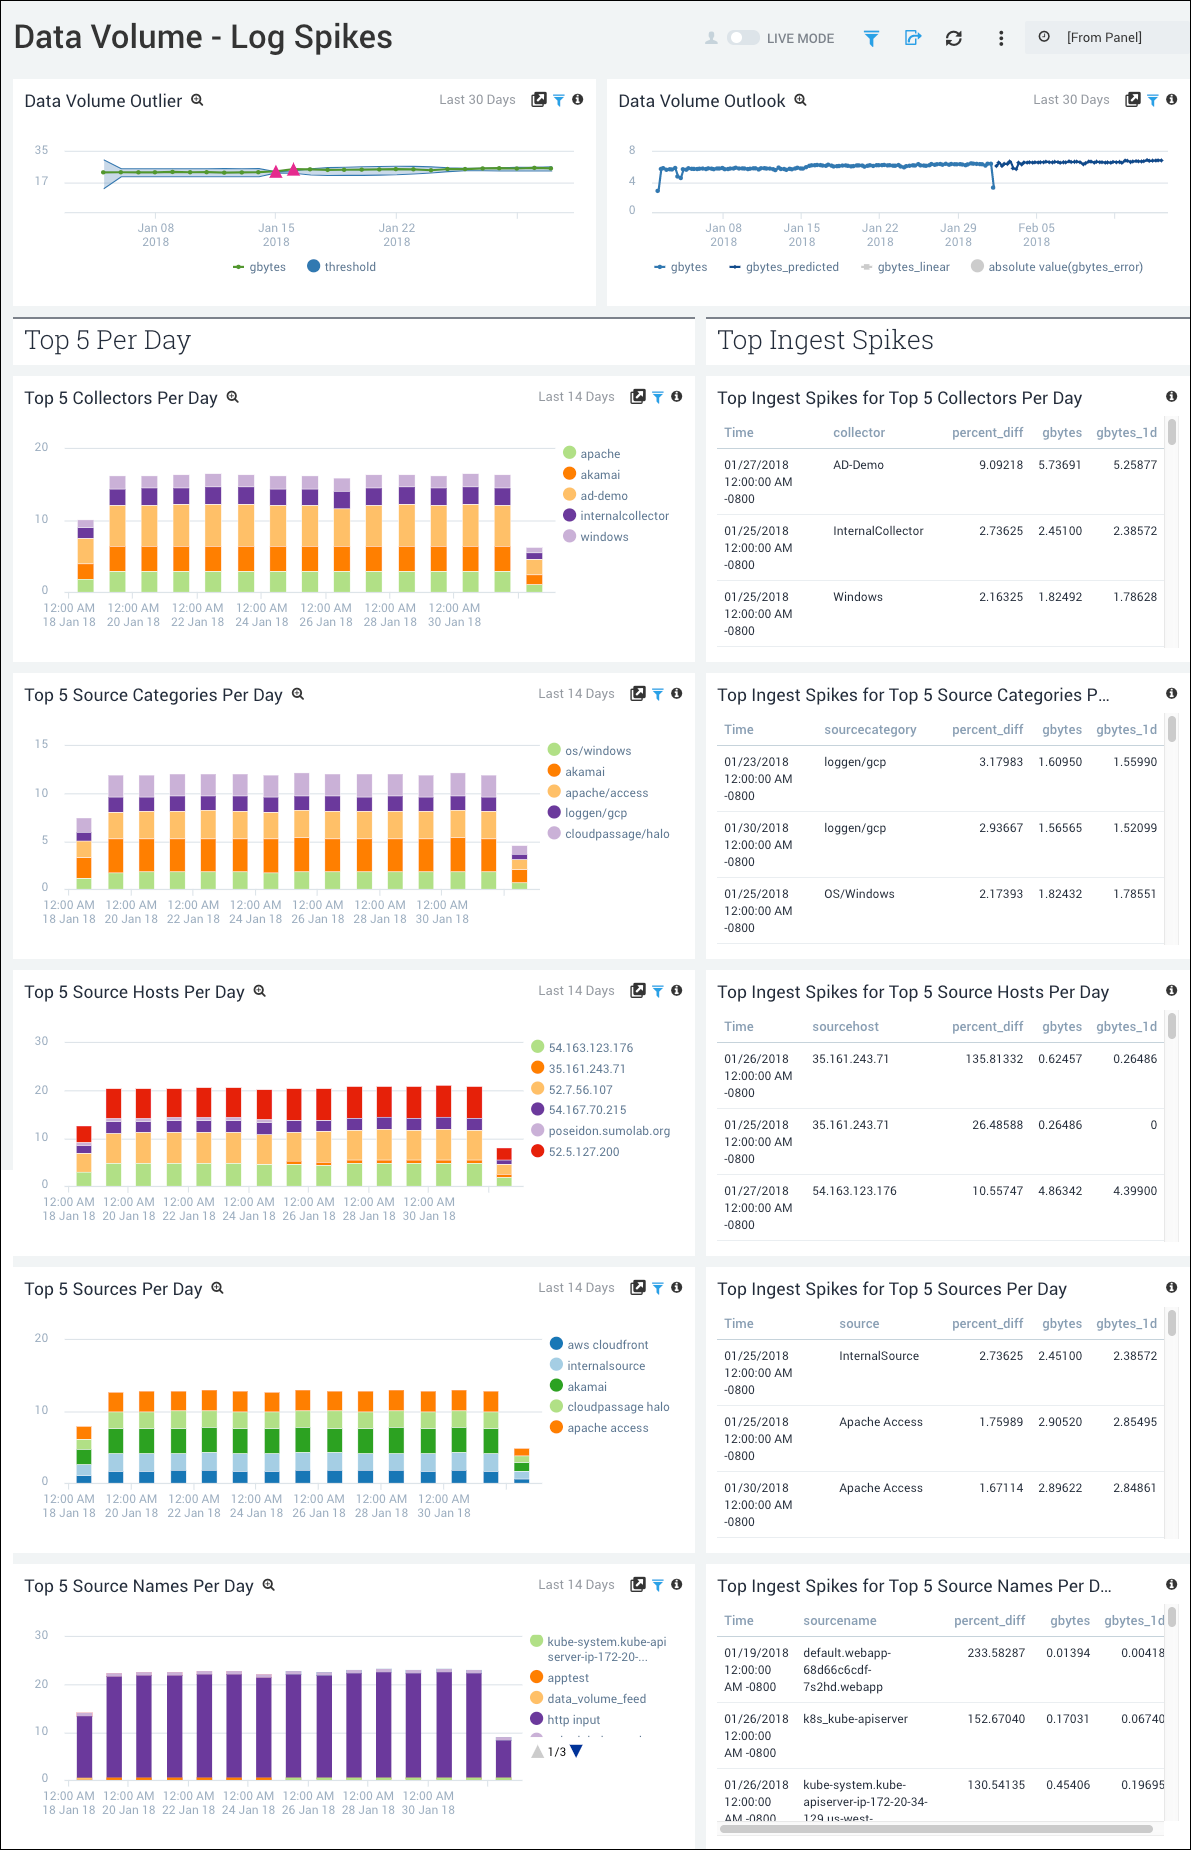
- Data Volume Outlier. Identify timelices over the last 30 days where the data volume exceeds the moving average by a statistically significant amount, three standard deviations.
- Data Volume Outlook. See a prediction of data volume levels over the next 15 days, based on an auto-regressive analysis.
- Top 5 Per Day
- Top 5 Collectors Per Day. View a stacked bar chart that shows the five collectors that have received the most data per day over the last 14 days.
- Top 5 Source Categories Per Day. View a stacked bar chart that shows the five source categories that have received the most data per day over the last 14 days.
- Top 5 Source Hosts Per Day. View a stacked bar chart that shows the five source hosts that have received the most data per day.
- Top 5 Sources Per Day. View a stacked bar chart that shows the five sources that have received the most data per day over the last 14 days.
- Top 5 Source Names Per Day. View a stacked bar chart that shows the five sources that have names received the most data per day over the last 14 days.
- Top Ingest Spikes
- Top Ingest Spikes for Top 5 Collectors Per Day. See the five collectors that have experienced the largest ingest spikes, compared to the previous day, over the last 14 days.
- Top Ingest Spikes for Top 5 Source Categories Per Day. See the five source categories that have experienced the largest ingest spikes, compared to the previous day, over the last 14 days.
- Top Ingest Spikes for Top 5 Source Hosts Per Day. See the five source hosts that have experienced the largest ingest spikes, compared to the previous day, over the last 14 days.
- Top Ingest Spikes for Top 5 Sources Per Day. See the five sources that have experienced the largest ingest spikes, compared to the previous day.
- Top Ingest Spikes for Top 5 Source Names Per Day. See the five source names that have experienced the largest ingest spikes, compared to the previous day, over the last 14 days.
Capacity Utilization
See the the subscribed, actual, and percentage capacity utilization for logs and metrics.
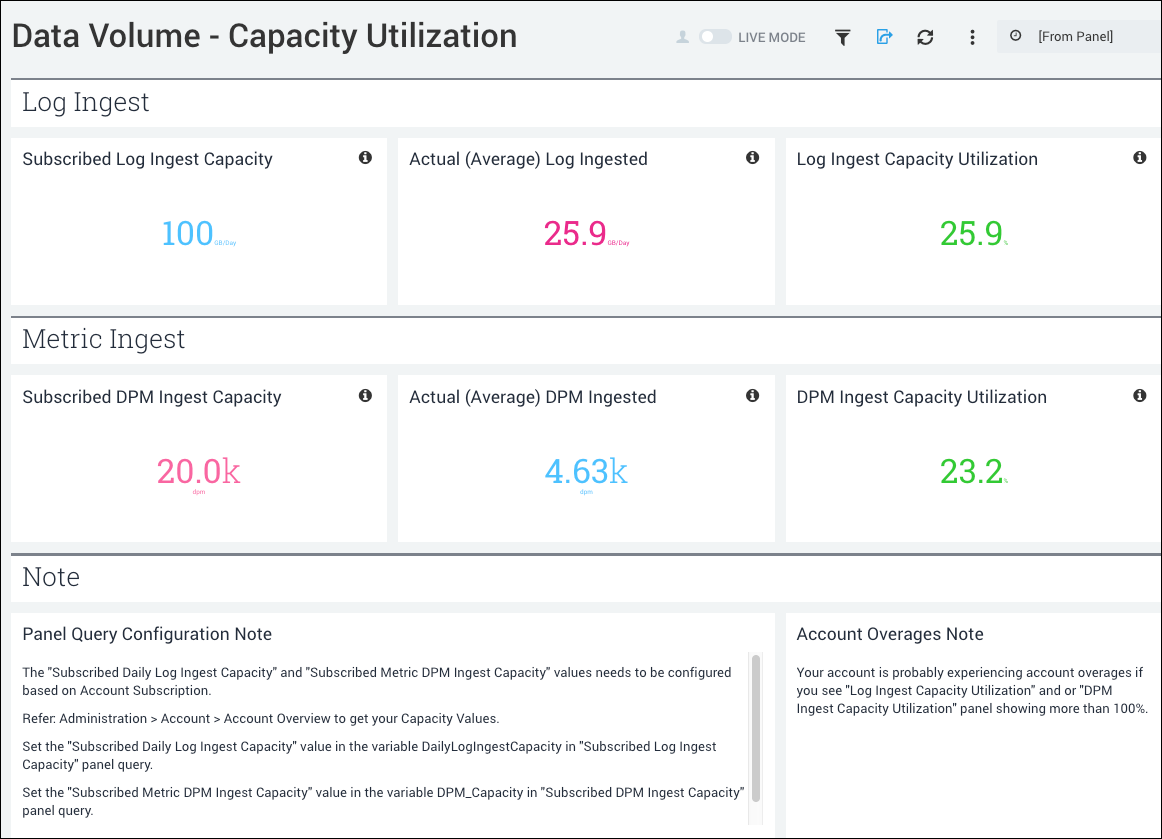
Log Ingest:
- Subscribed Log Ingest Capacity. The log ingestion capacity of your subscription, in GB/day. You must configure the "Subscribed Daily Log Ingest Capacity" value, based on your Account Subscription. See Administration > Account > Account Overview to see the log ingest capacity value. Then, set the "Subscribed Daily Log Ingest Capacity" value in the DailyLogIngestCapacity variable in the "Subscribed Log Ingest Capacity" panel query, and update the dashboard.
- Actual (Average) Log Ingested. Your average log ingestion in GB/day, over the last 30 days.
- Log Ingest Capacity Utilization. The percentage of your subscribed log ingestion capacity you have used, over the last 30 days.
Metric Ingest:
- Subscribed DPM Ingest Capacity. The metric ingestion capacity of your subscription, in DPM. You must configure the "Subscribed Metric DPM Ingest Capacity" value, based on your Account Subscription. See Administration > Account > Account Overview to see the metric DPM ingest capacity value. Then, set the "Subscribed Metric DPM Ingest Capacity" value in the DPM_Capacity variable in the "Subscribed DPM Ingest Capacity" panel query, and update the dashboard.
- Actual (Average) DPM Ingested. Your average metric ingestion in DPM, over the last 30 days.
- DPM Ingest Capacity Utilization. The percentage of your subscribed metric ingestion capacity you have used, over the last 30 days.