Create a Metrics Query and Chart
This topic pertains to our Classic Metrics UI (Legacy). For information about the Metrics Explorer UI, which replaces the Classic Metrics UI, see Metrics Explorer.
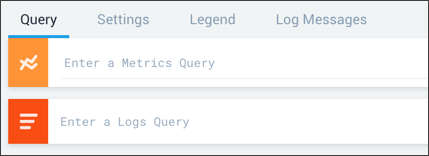
The metrics visualization area is in the upper part of the page and the query area is in the lower part of the page.
![]()
Create a metrics visualization
Click + in the tab bar and select Metrics.
Create your query or queries in the Query tab, which opens by default when you open the Metrics page.
Create up to six metrics queries, with each including a combination of the following:
- Sequence of space-separated
tag=valuepairs. - Unqualified strings (value with no key).
- Functions (displayed with
|symbol). - Aggregation by specified parameters (displayed with
|symbol). - Logical operators (AND, OR, and NOT/!)
Example 1 (one query):
metric=CPU_IdleExample 1 (one query with aggregation):
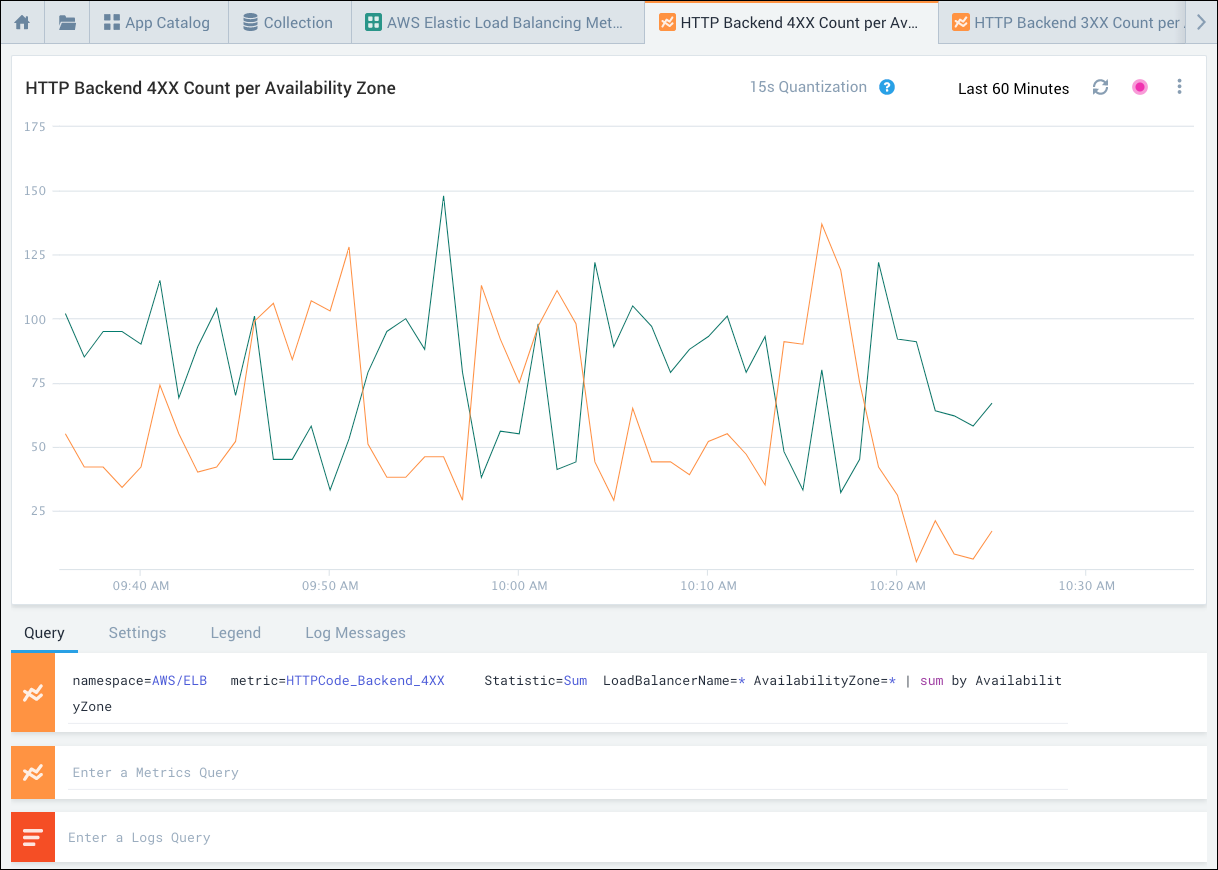
cluster=search node=search-1 metric=cpu-system | avg by nodeExample 2 (two queries)
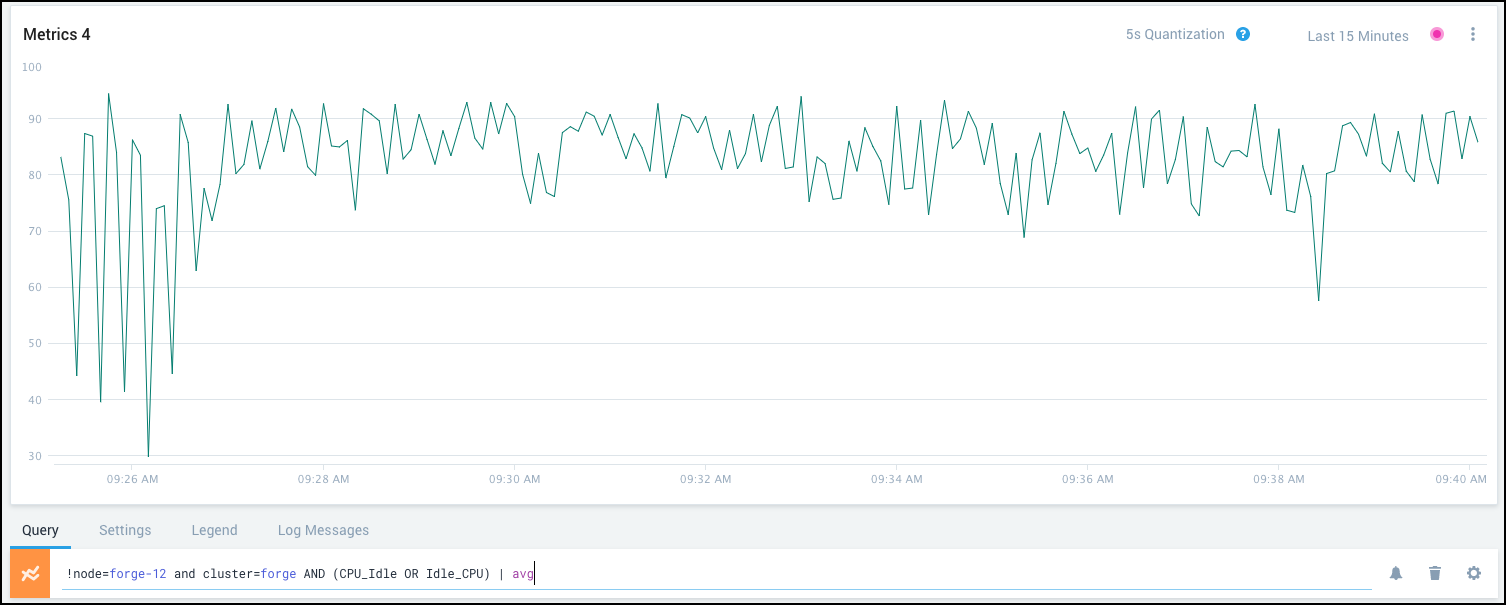
_sourceCategory=tara_cloudwatch_aws_logs_2 metric=CPU_IdleExample 3 (one query, using NOT to visualize all nodes except search-1):
cluster=search !node=search-1 metric=cpu-system | avg by node
- Sequence of space-separated
For more information, see [Guidelines for Metrics Queries](/docs/metrics/metrics-queries/metrics-queries-classic).
- Press Enter in any of the entry fields to display the data in the data visualization area. See Interacting with Metrics Charts to learn how to interact with the visualization and modify settings.
Limitations
If your query matches more than 1000 time series, you might see a message indicating that you need to adjust your query to reduce the number of time series. For more information, see Too Many Time Series Messages.