Azure SQL
Azure SQL Database is a managed relational cloud database service. The Sumo Logic app for Azure SQL helps you monitor activity in Azure SQL. The preconfigured dashboards provide insight into resource utilization, blocking queries, database wait events, errors, runtime execution stats, and other database analytics.
Log types
The Sumo Logic App for Azure SQL App uses the following log types:
- Metric
- QueryStoreRuntimeStatisticsEvent
- QueryStoreWaitStatisticsEvent
- DatabaseWaitStatisticsEvent
- BlockEvent
- ErrorEvent
- Insight
- TimeoutEvent
For details on Azure SQL logs and metrics, see Enable logging in Azure help.
Sample Log Messages
{
    "LogicalServerName":"npande-test-db-server",
    "SubscriptionId":"c088dc46-d123-12ad-a8b7-9a123d45ad6a",
    "ResourceGroup":"npandeTestDBResGrp",
    "time":"2018-07-09T05:08:32.679Z",
    "resourceId":"/SUBSCRIPTIONS/c088dc46-d123-12ad-a8b7-9a123d45ad6a/RESOURCEGROUPS/NPANDETESTDBRESGRP/PROVIDERS/MICROSOFT.SQL/SERVERS/NPANDE-TEST-DB-SERVER/DATABASES/NPANDETESTDB2",
    "category":"Errors",
    "operationName":"ErrorEvent",
    "properties":{
        "ElasticPoolName":"",
        "DatabaseName":"npandeTestDB2",
        "query_hash":"0",
        "query_plan_hash":"0",
        "message":"Invalid object name 'inventory123'.",
        "error_number":208,
        "severity":16,
        "user_defined":false,
        "state":1
    }
}
{
    "LogicalServerName":"npande-test-db-server",
    "SubscriptionId":"c088dc46-d123-12ad-a8b7-9a123d45ad6a"",""ResourceGroup"":""npandeTestDBResGrp"",""time"":""2018-07-09T05":"13":34.520Z",""resourceId"":"/SUBSCRIPTIONS/c088dc46-d123-12ad-a8b7-9a123d45ad6a"/RESOURCEGROUPS/NPANDETESTDBRESGRP/PROVIDERS/MICROSOFT.SQL/SERVERS/NPANDE-TEST-DB-SERVER/DATABASES/NPANDETESTDB",
    "category":"DatabaseWaitStatistics",
    "operationName":"DatabaseWaitStatistcsEvent",
    "properties":{
        "ElasticPoolName":"",
        "DatabaseName":"npandeTestDB",
        "start_utc_date":"2018-07-09T05:13:34.520Z",
        "end_utc_date":"2018-07-09T05:18:36.050Z",
        "wait_type":"WRITELOG",
        "delta_max_wait_time_ms":0,
        "delta_signal_wait_time_ms":0,
        "delta_wait_time_ms":12,
        "delta_waiting_tasks_count":2
    }
}
Sample Query
_sourceCategory=Azure/DB/SQL/Logs ErrorEvent "\"operationName\":\"ErrorEvent\""
| json "LogicalServerName", "SubscriptionId", "ResourceGroup", "resourceId", "category", "operationName", "properties" nodrop
| json field=properties "severity", "error_number", "DatabaseName", "message", "user_defined", "state"
| where operationName="ErrorEvent"
| count as eventCount by message
| top 10 message by eventCount, message asc
Collecting Logs and Metrics
This section has instructions for collecting logs and metrics for the Azure SQL App, as well as a sample log message and a query sample.
Collect diagnostic logs from Azure Monitor by streaming to EventHub
In this step, you configure a pipeline for shipping logs from Azure Monitor to an Event Hub, on to an Azure Function, and finally to an HTTP Source on a Hosted Collector in Sumo Logic. Azure Monitor collects metrics and logs. The pipeline is described on Collect Logs from Azure Monitor.
- Perform Steps 1 and Step 2 of Collect Logs from Azure Monitor. \
In Step 1, you create an HTTP Source. When you configure the, plan your source category to ease the querying process. A hierarchical approach allows you to make use of wildcards. For example: \
Azure/DB/SQL/Logs - Push logs from Azure Monitor to Event Hub. Various Azure Services connect to Azure Monitor to send monitoring data to an Event Hub. For more information, see Azure Monitor: Send monitoring data to an event hub and How do I set up Azure platform monitoring data to be streamed to an event hub? in Azure help.
- Login into Azure Portal.
- Click Azure SQL. Select the SQL database from which you want to collect logs.
- In the Monitoring Section, the Diagnostic Settings blade displays any existing settings. Click Edit Setting if you want to change your existing settings, or click Add diagnostic setting to add a new one. You can have a maximum of three settings.
- Enter a name.
- Check the Stream to an event hub box and click Event hub / Configure.
- Select an Azure subscription.
- Select the Event Hubs namespace you created in Step 2 of Collect Logs from Azure Monitor. It should start with
“SumoAzureLogsNamespace<UniqueSuffix>”. - Select insights-operational-logs from the Select event hub name dropdown.
- Select RootManageSharedAccessKey from Select event hub policy name dropdown.
- Click OK to exit event hub configuration.
- Check the box under Logs labeled “Audit”.
- Click Save.
Collect metrics from Azure Monitor by streaming to EventHub
In this step, you configure a pipeline for shipping metrics from Azure Monitor to an Event Hub, on to an Azure Function, and finally to an HTTP Source on a hosted collector in Sumo Logic. The pipeline is described on Collect Metrics from Azure Monitor.
- Perform Steps 1 and Step 2 of Collect Metrics from Azure Monitor.
In Step 1, you create an HTTP source. When you configure the, plan your source category to ease the querying process. A hierarchical approach allows you to make use of wildcards. For example: \Azure/DB/SQL/Metrics - Push metrics from Azure Monitor to Event Hub.
- From the left pane, select **ALL Services.
- Search for and select "Monitor".
- In the Monitor pane, select Diagnostic Settings under Settings.
- Select the resource for which you want to export metrics. If diagnostics is not enabled click **Turn on Diagnostics Settings.
- Once diagnostics are enabled, click Add a diagnostic setting.
- The Diagnostic Settings page appears.
- In the left pane:
- Enter a name for the diagnostic setting.
- Click the Stream to an event hub checkbox.
- Select Configure event hub. The right pane appears.
- In the right pane:
- Choose a Subscription.
- Select
SumoMetricsNamespace_<UniqueSuffix>as the event hub namespace. - Select insights-metrics-pt1m as the event hub name.
- Select an event hub policy name. You can use the default policy RootManageSharedAccessKey.
- Check the AllMetrics box.
- Click OK.
- Save the Diagnostics Setting.
Installing the Azure SQL App
Now that you have set up a collection of Azure SQL logs and metrics, install the Azure SQL App to use the pre-configured searches and dashboards.
To install the app
Locate and install the app you need from the App Catalog. If you want to see a preview of the dashboards included with the app before installing, click Preview Dashboards.
- From the App Catalog, search for and select the app.
- To install the app, click Add to Library.
- App Name. You can retain the existing name, or enter a name of your choice for the app.
- Azure SQL Metrics Source. Select the source category that you configured for the .... source.
- Azure SQL Log Source. Select the source category that you configured for the ... source.
- Advanced. Select the Location in Library (the default is the Personal folder in the library), or click New Folder to add a new folder.
- Click Add to Library.
Once an app is installed, it will appear in your Personal folder, or other folder that you specified. From here, you can share it with your organization. See Welcome to the New Library for information on working with the library.
Panels will start to fill automatically. It's important to note that each panel slowly fills with data matching the time range query and received since the panel was created. Results won't immediately be available, but with a bit of time, you'll see full graphs and maps.
Viewing the Azure SQL Dashboards
This section describes the dashboards in the Sumo Logic App for Azure SQL.
Overview
See the count of logical servers, databases, errors; and the “top 10” active servers, resource groups, subscriptions, resources, databases, operations, and categories.
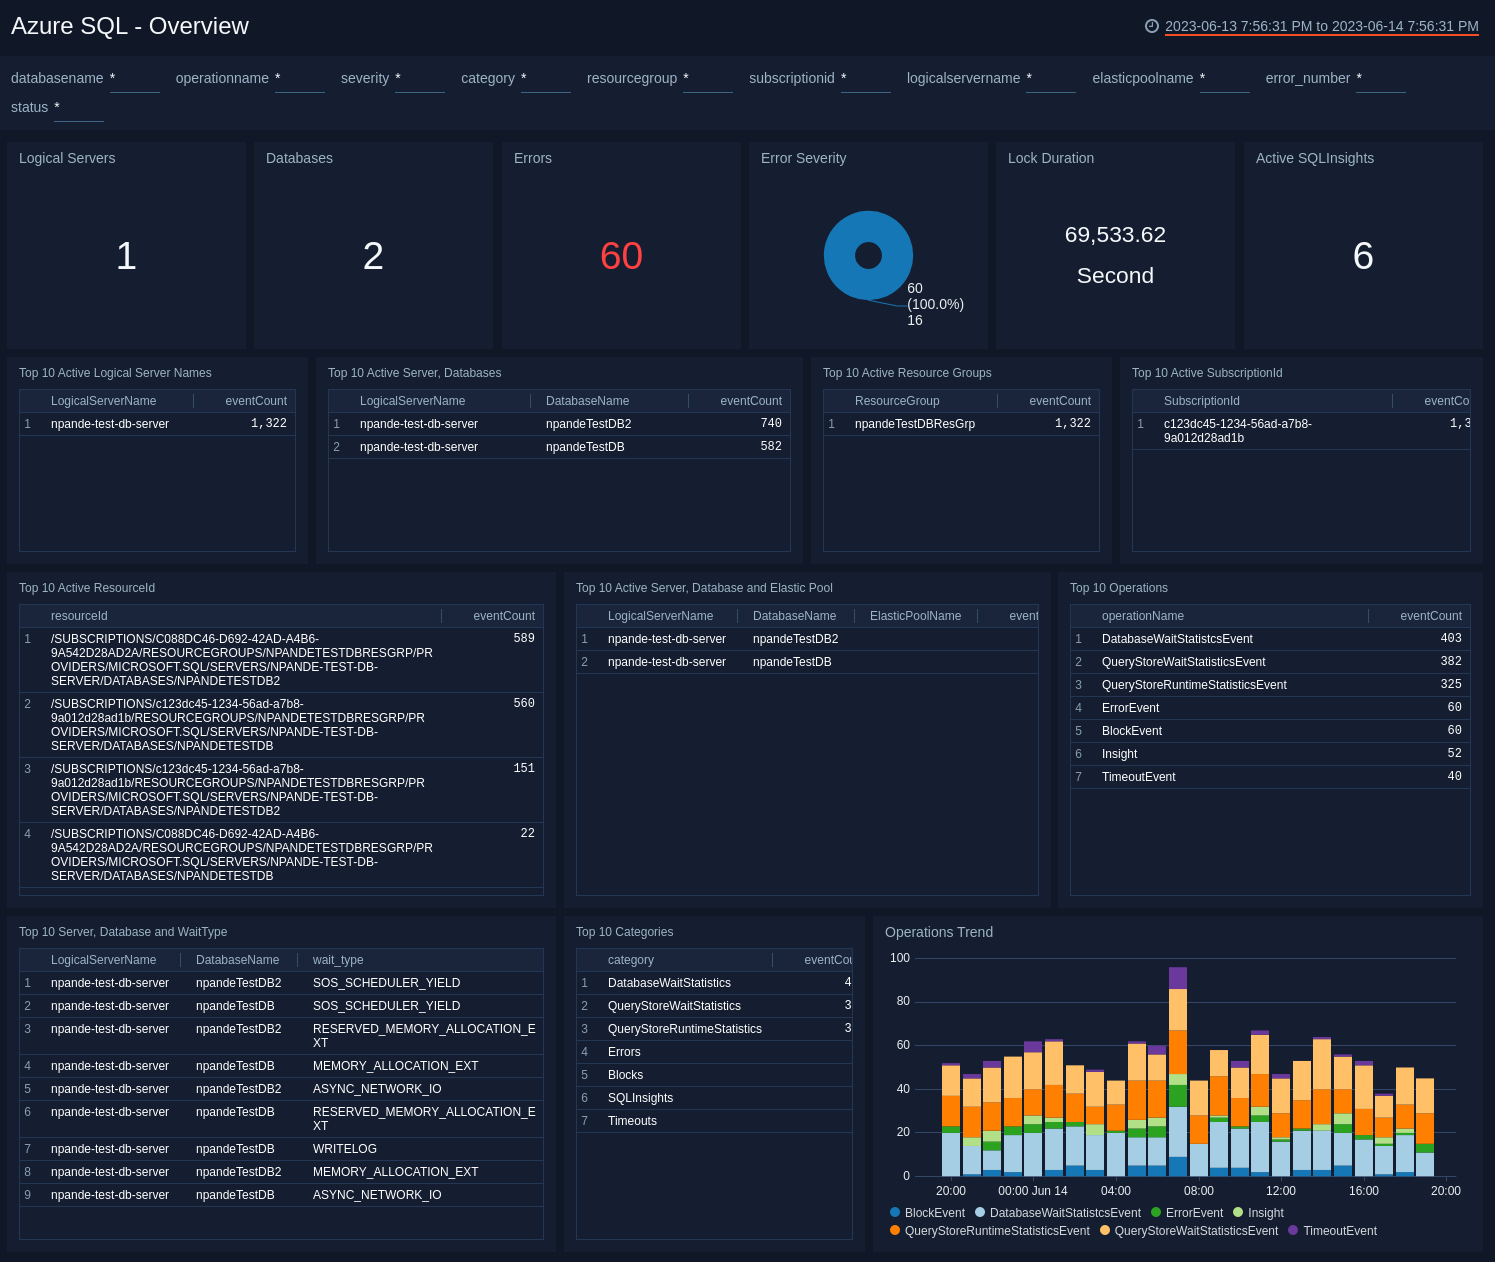
Logical Servers. The count of logical servers over the last 24 hours.
Databases. The count of databases over the last 24 hours.
Errors. The count of errors over the last 24 hours.
Error Severity. A donut chart that shows the breakdown of errors by severity over the last 24 hours.
Lock Duration. The total number of seconds that the database experienced locks in the last 24 hours.
Active SQLInsights. The count of performance issues detected by SQL Insights whose current status is “Active”.
Top 10 Active Logical Server Names. The names of the 10 logical servers that have experienced the most events over the last 24 hours, and the event count for each.
Top 10 Active Server, Databases. Lists the 10 logical server-database combinations that have experienced the most events over the last 24 hours, and the event count for each.
Top 10 Active Resource Groups. Lists the 10 active resource groups that have experienced the most events over the last 24 hours, and the event count for each.
Top 10 Active SubscriptionId. Lists the 10 active SubscriptionIds that have experienced the most events over the last 24 hours, and the event count for each.
Top 10 Active ResourceId. Lists the 10 active ResourceIds that have experienced the most events over the last 24 hours , and the event count for each.
Top 10 Active Server, Databases and Elastic Pool. Lists the 10 logical server-database-elastic pool combinations that have experienced the most events over the last 24 hours, and the event count for each.
Top 10 Operations. Lists the 10 operations with the most events over the last 24 hours.
Top 10 Active Server, Databases and WaitType. Lists the 10 logical server-database-wait type combinations that have experienced the most events over the last 24 hours, and the event count for each.
Top 10 Categories.The top 10 log categories for Azure diagnostic logs emitted over the last 24 hours.
Operations Trend. A stacked bar chart that shows the count of different operations over the last 24 hours.
Blocking Stats
See information about blocking queries in Azure SQL, including lock mode usage, lock duration, and details about block events.
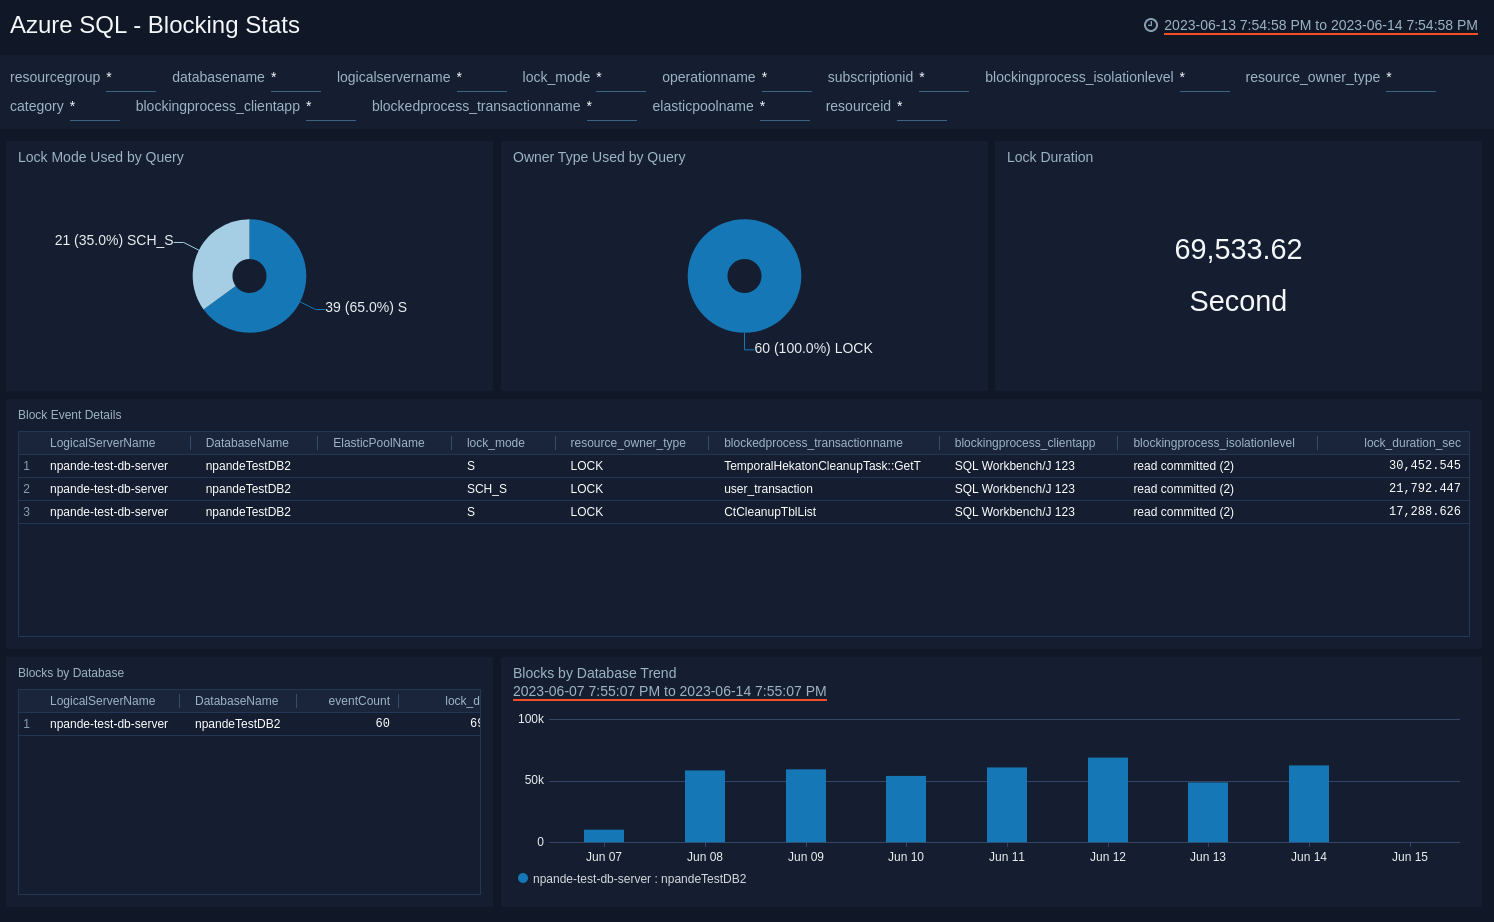
Lock Mode Used by Query. A donut chart that shows the breakdown of lock modes for blocked queries over the last 7 days.
Owner Type Used by Query. A donut chart the shows the breakdown of resource owner types for blocked queries over the last 7 days.
Lock Duration. The total number of seconds that database updates were blocked over the last 7 days.
Block Event Details. A table that lists details for blocking events over the last 7 days.
Blocks by Database. A table that lists the count of blocking events and the total lock duration by logical server and database over the last 7 days.
Blocks by Database Trend. A bar chart that shows the total lock duration by logical server and database on a timeline for the last 7 days.
Azure SQL - DatabaseWait Stats
Wait Events by Database. A donut chart that shows the count of wait events by logical server-database combination over the last 24 hours.
Wait Events Breakdown by Database. A stacked bar chart that shows the breakdown of wait events by wait type on a timeline over the last 24 hours.
Wait Type Trend. A stacked column chart that shows wait event over time, broken down by wait type.
Average Wait Time Per Task. A table that lists task-level information about wait events by logical server-database-wait type combination over the last 24 hours, including the count of waiting tasks, total wait time for those tasks, and the average wait time per task.
Detailed Stats. A table that lists information about wait events in the last 24 hours.
Errors
See information about errors in Azure SQL, including total error count, top 10 error numbers and error messages, errors by severity and database, error trend and comparison analyses, and error details.
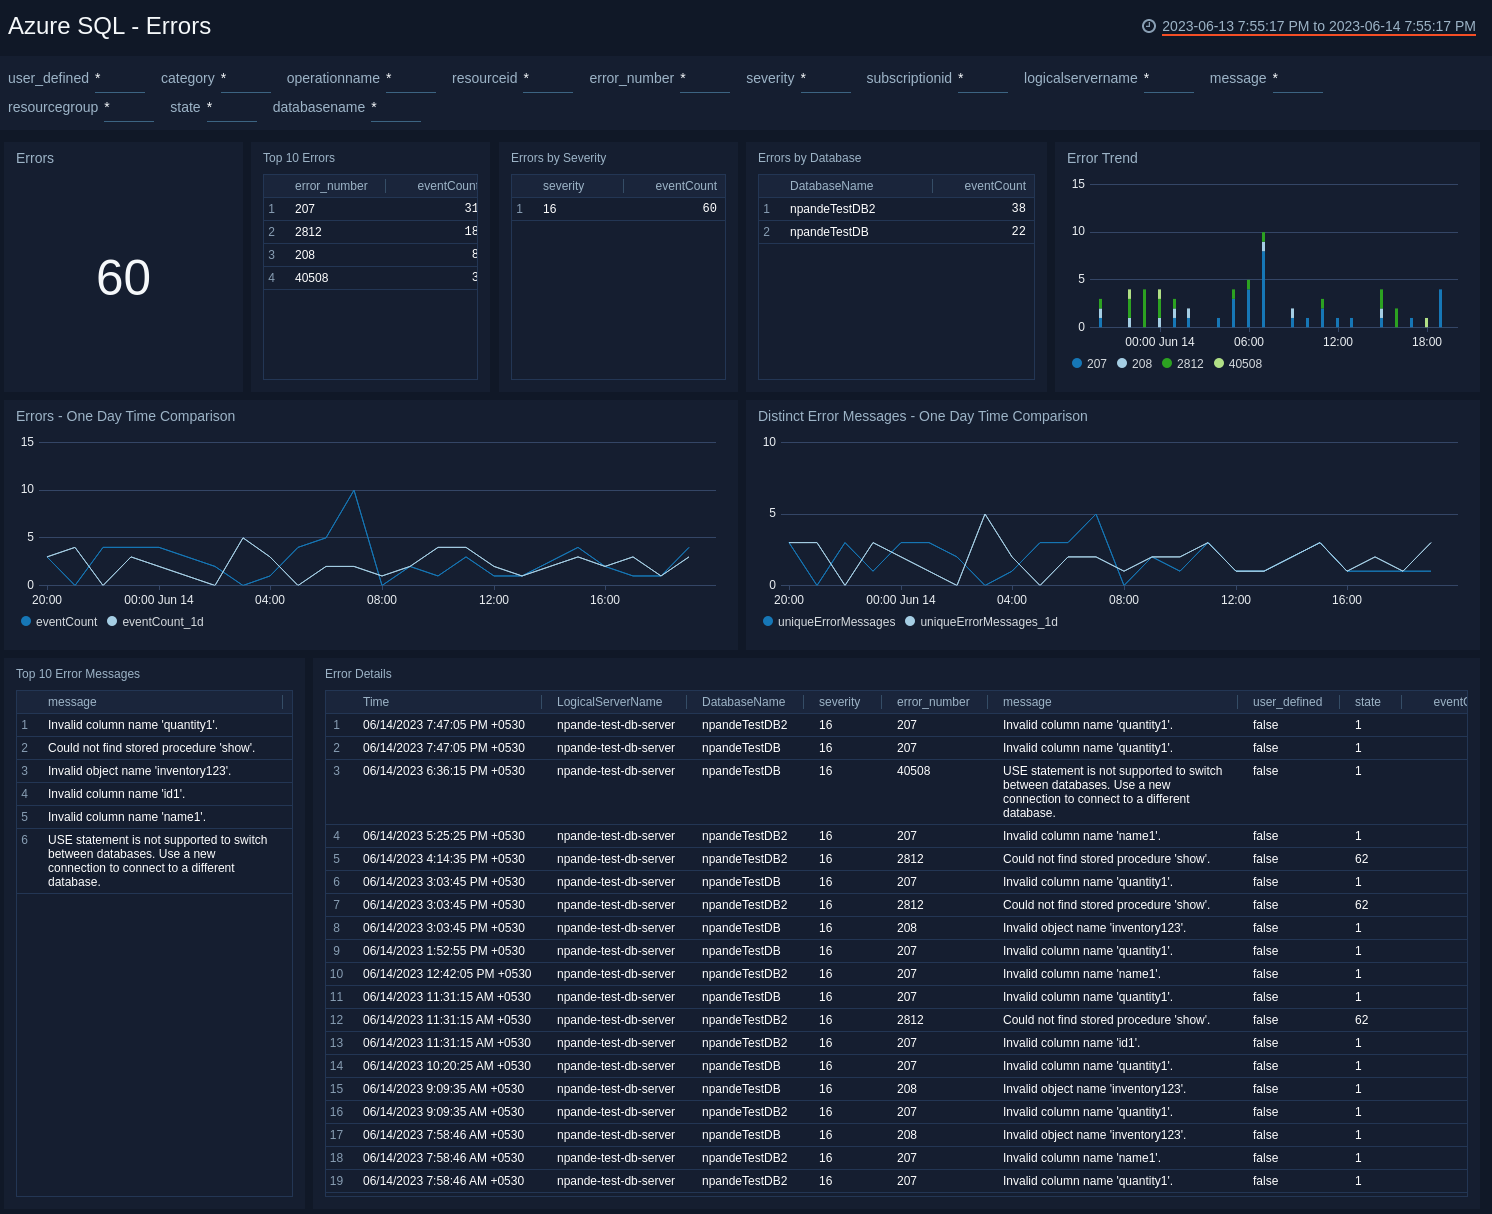
Errors. Count of errors over the last 24 hours.
Top 10 Errors. A table that lists the top 10 error numbers over the last 24 hours and the count of each error number.
Errors by Severity. A table that lists the severity of errors over the last 24 hours and the count of errors with each severity.
Errors by Database. A table that lists the error count for each database over the last 24 hours.
Error Trend. A stacked bar chart that shows the count of each error number over time.
Errors - One Day Time Comparison. A line chart that shows the count of errors per timeslice over the last 24 hours, compared with the count of errors one day previous.
Distinct Error Messages - One Day Time Comparison. A line chart that shows the count of distinct errors (unique messages) per timeslice over the last 24 hours, compared with the same count one day previous.
Top 10 Error Messages. A table that lists the top 10 error messages, and the count of each over the last 24 hours.
Error Details. A table that lists the details of errors that occurred during the previous 24 hours.
Metrics
See metrics for connections attempts; Database Transaction Unit (DTUs), CPU and storage utilization; and for deadlocks, sessions, and workers.
For information about the metrics presented in the Metrics dashboards, see All metrics and Microsoft.Sql/servers/databases in Azure help.
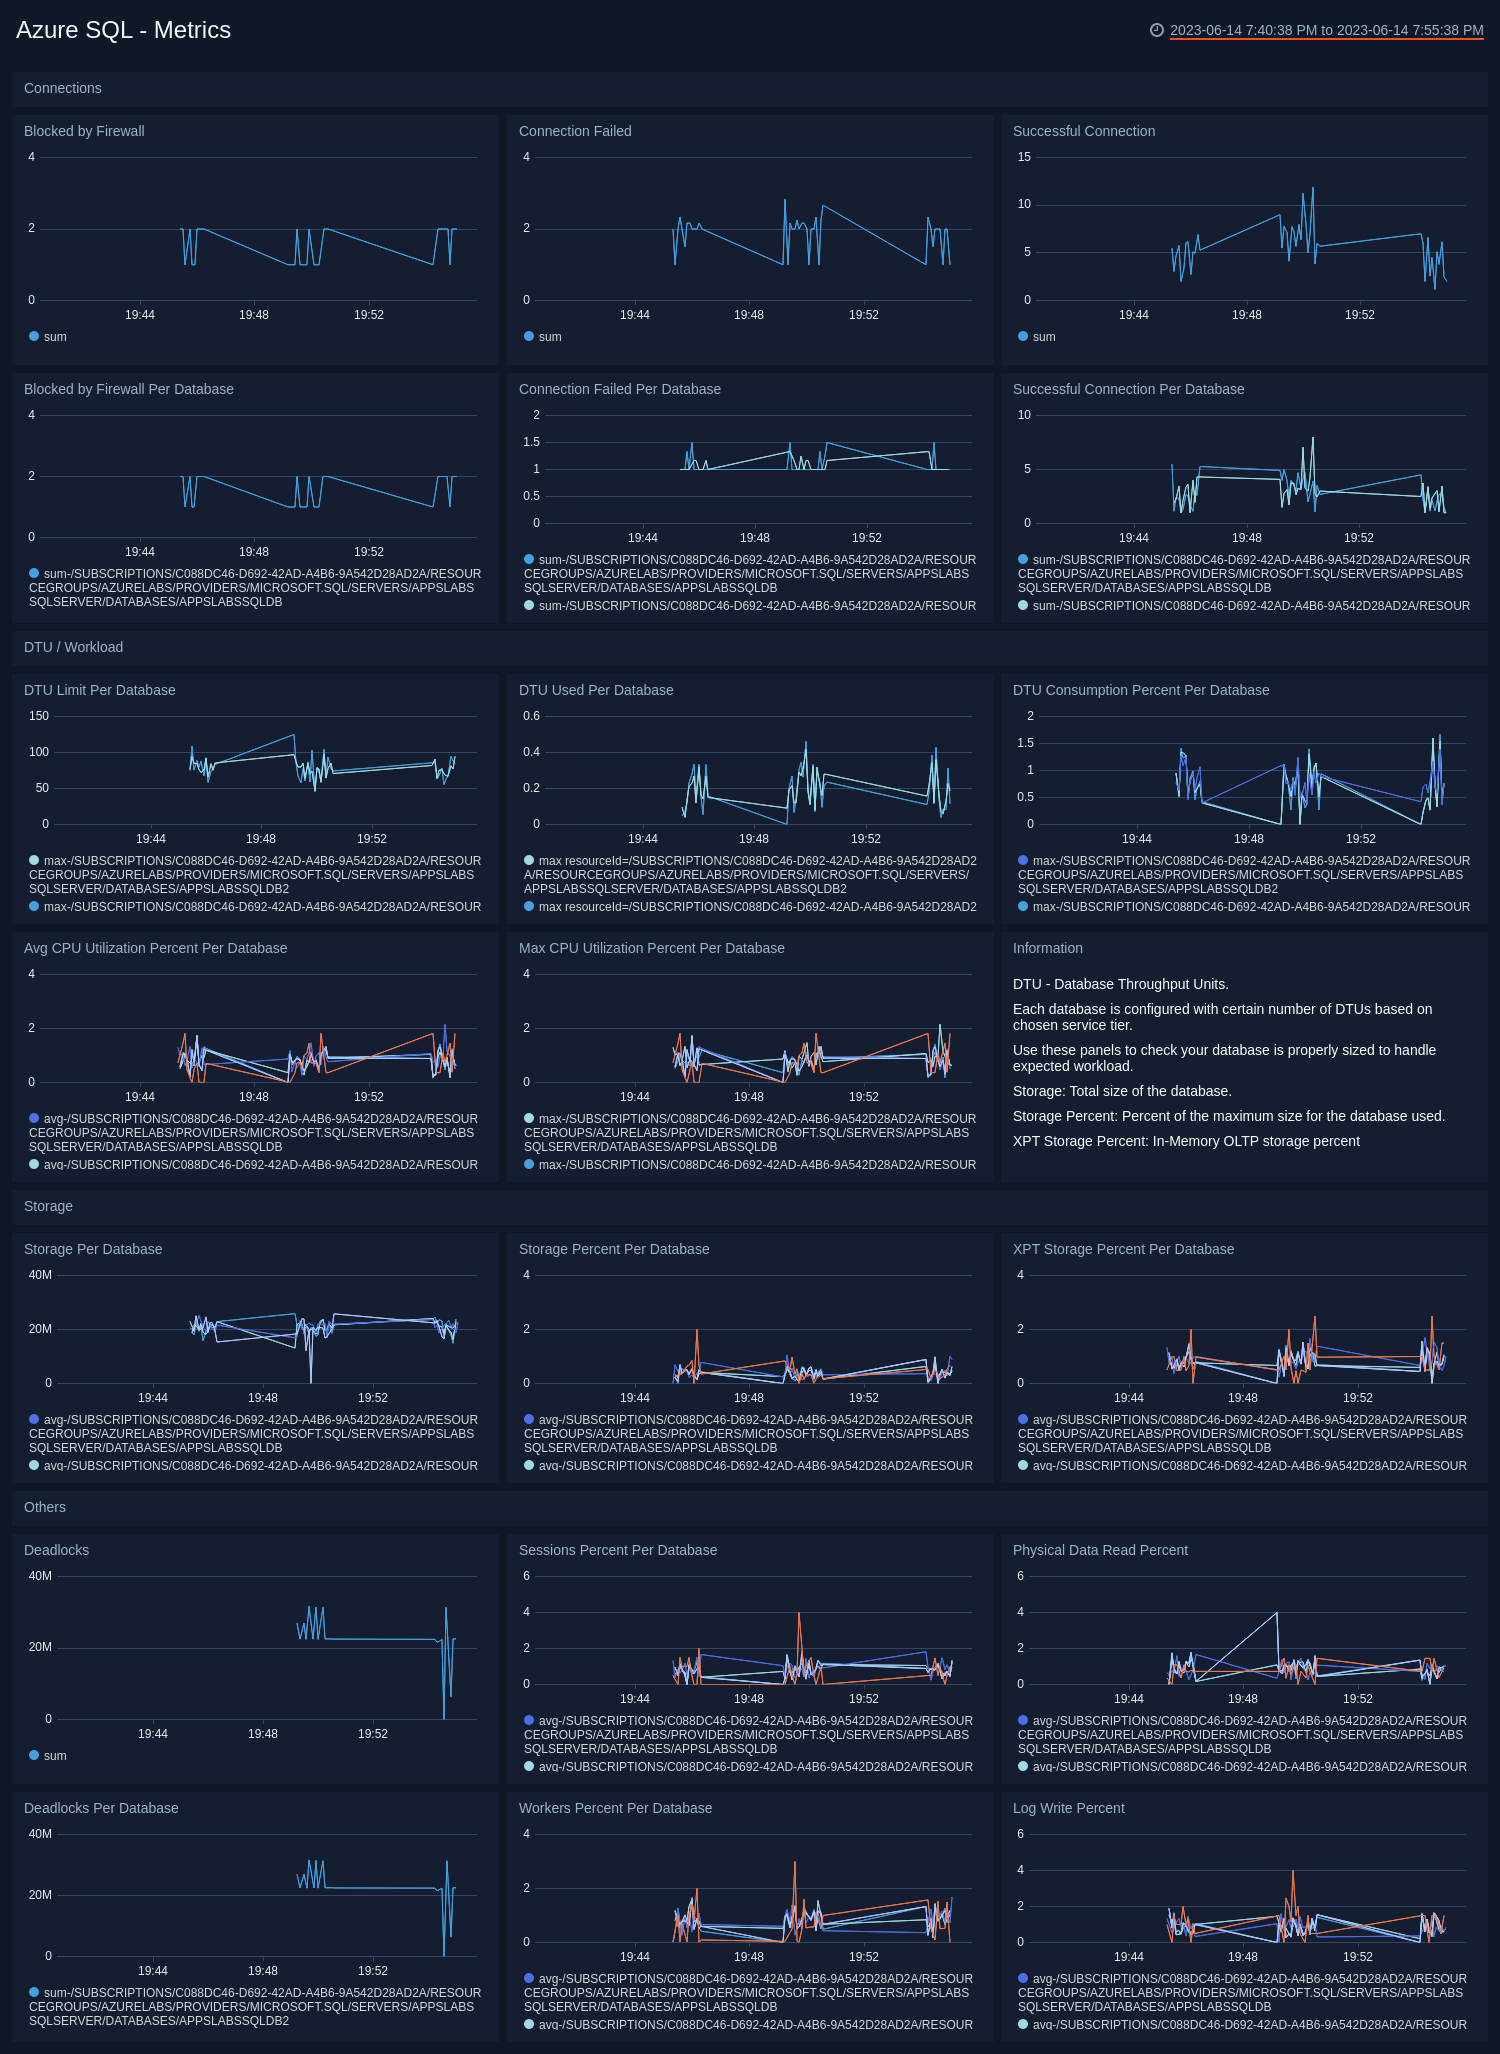
Blocked by Firewall. A line chart showing the count of connections blocked by a firewall over the last 24 hours.
Connection Failed. A line chart showing the count of failed connections over the last 24 hours.
Successful Connection. A line chart showing the count of successful connections over the last 24 hours.
Blocked by Firewall Per Database. A line chart showing the count of connections to each database blocked by a firewall over the last 24 hours.
Connection Failed Per Database. A line chart showing the count of failed connections to each database over the last 24 hours.
Successful Connection Per Database. A line chart showing the count of successful connections to each database over the last 24 hours.
DTU Limit Per Database. A line chart showing the Database Throughput Unit (DTU) limit for each database over the last 24 hours.
DTU Used Per Database. A line chart showing the DTU used for each database over the last 24 hours.
DTU Consumption Percent Per Database. A line chart showing the percentage of the DTU limit was consumed by each database over the last 24 hours.
Avg CPU Utilization Percent Per Database. A line charge showing the average percentage of CPU used by each database over the last 24 hours.
Max CPU Utilization Percent Per Database. A line charge showing the maximum percentage of CPU used by each database over the last 24 hours.
Storage Per Database. The total size in bytes of each database over the last 24 hours.
Storage Percent Per Database. The percentage of the maximum allowed database size used by each database over the last 24 hours.
XPT Storage Percent Per Database. The percentage of in-memory OLTP storage used by each database over the last 24 hours.
Deadlocks. Count of deadlocks over the last 24 hours.
Sessions Percent Per Database. The percentage of allowed sessions used by each database over the last 24 hours.
Physical Data Read Percent. Displays average data I/O percentage over the last 24 hours.
Deadlocks Per Database. Count of deadlocks by database over the last 24 hours.
Workers Percent Per Database. The percentage of the allowed workers used by each database over the last 24 hours.
Log Write Percent. Displays average log I/O percentage over the last 24 hours.
QueryStoreRuntime Stats
See query runtime execution statistics such as CPU usage and query duration.
For more information about the statistics presented on the QueryStoreRuntime Stats dashboard, see Query Store runtime statistics in Azure help.
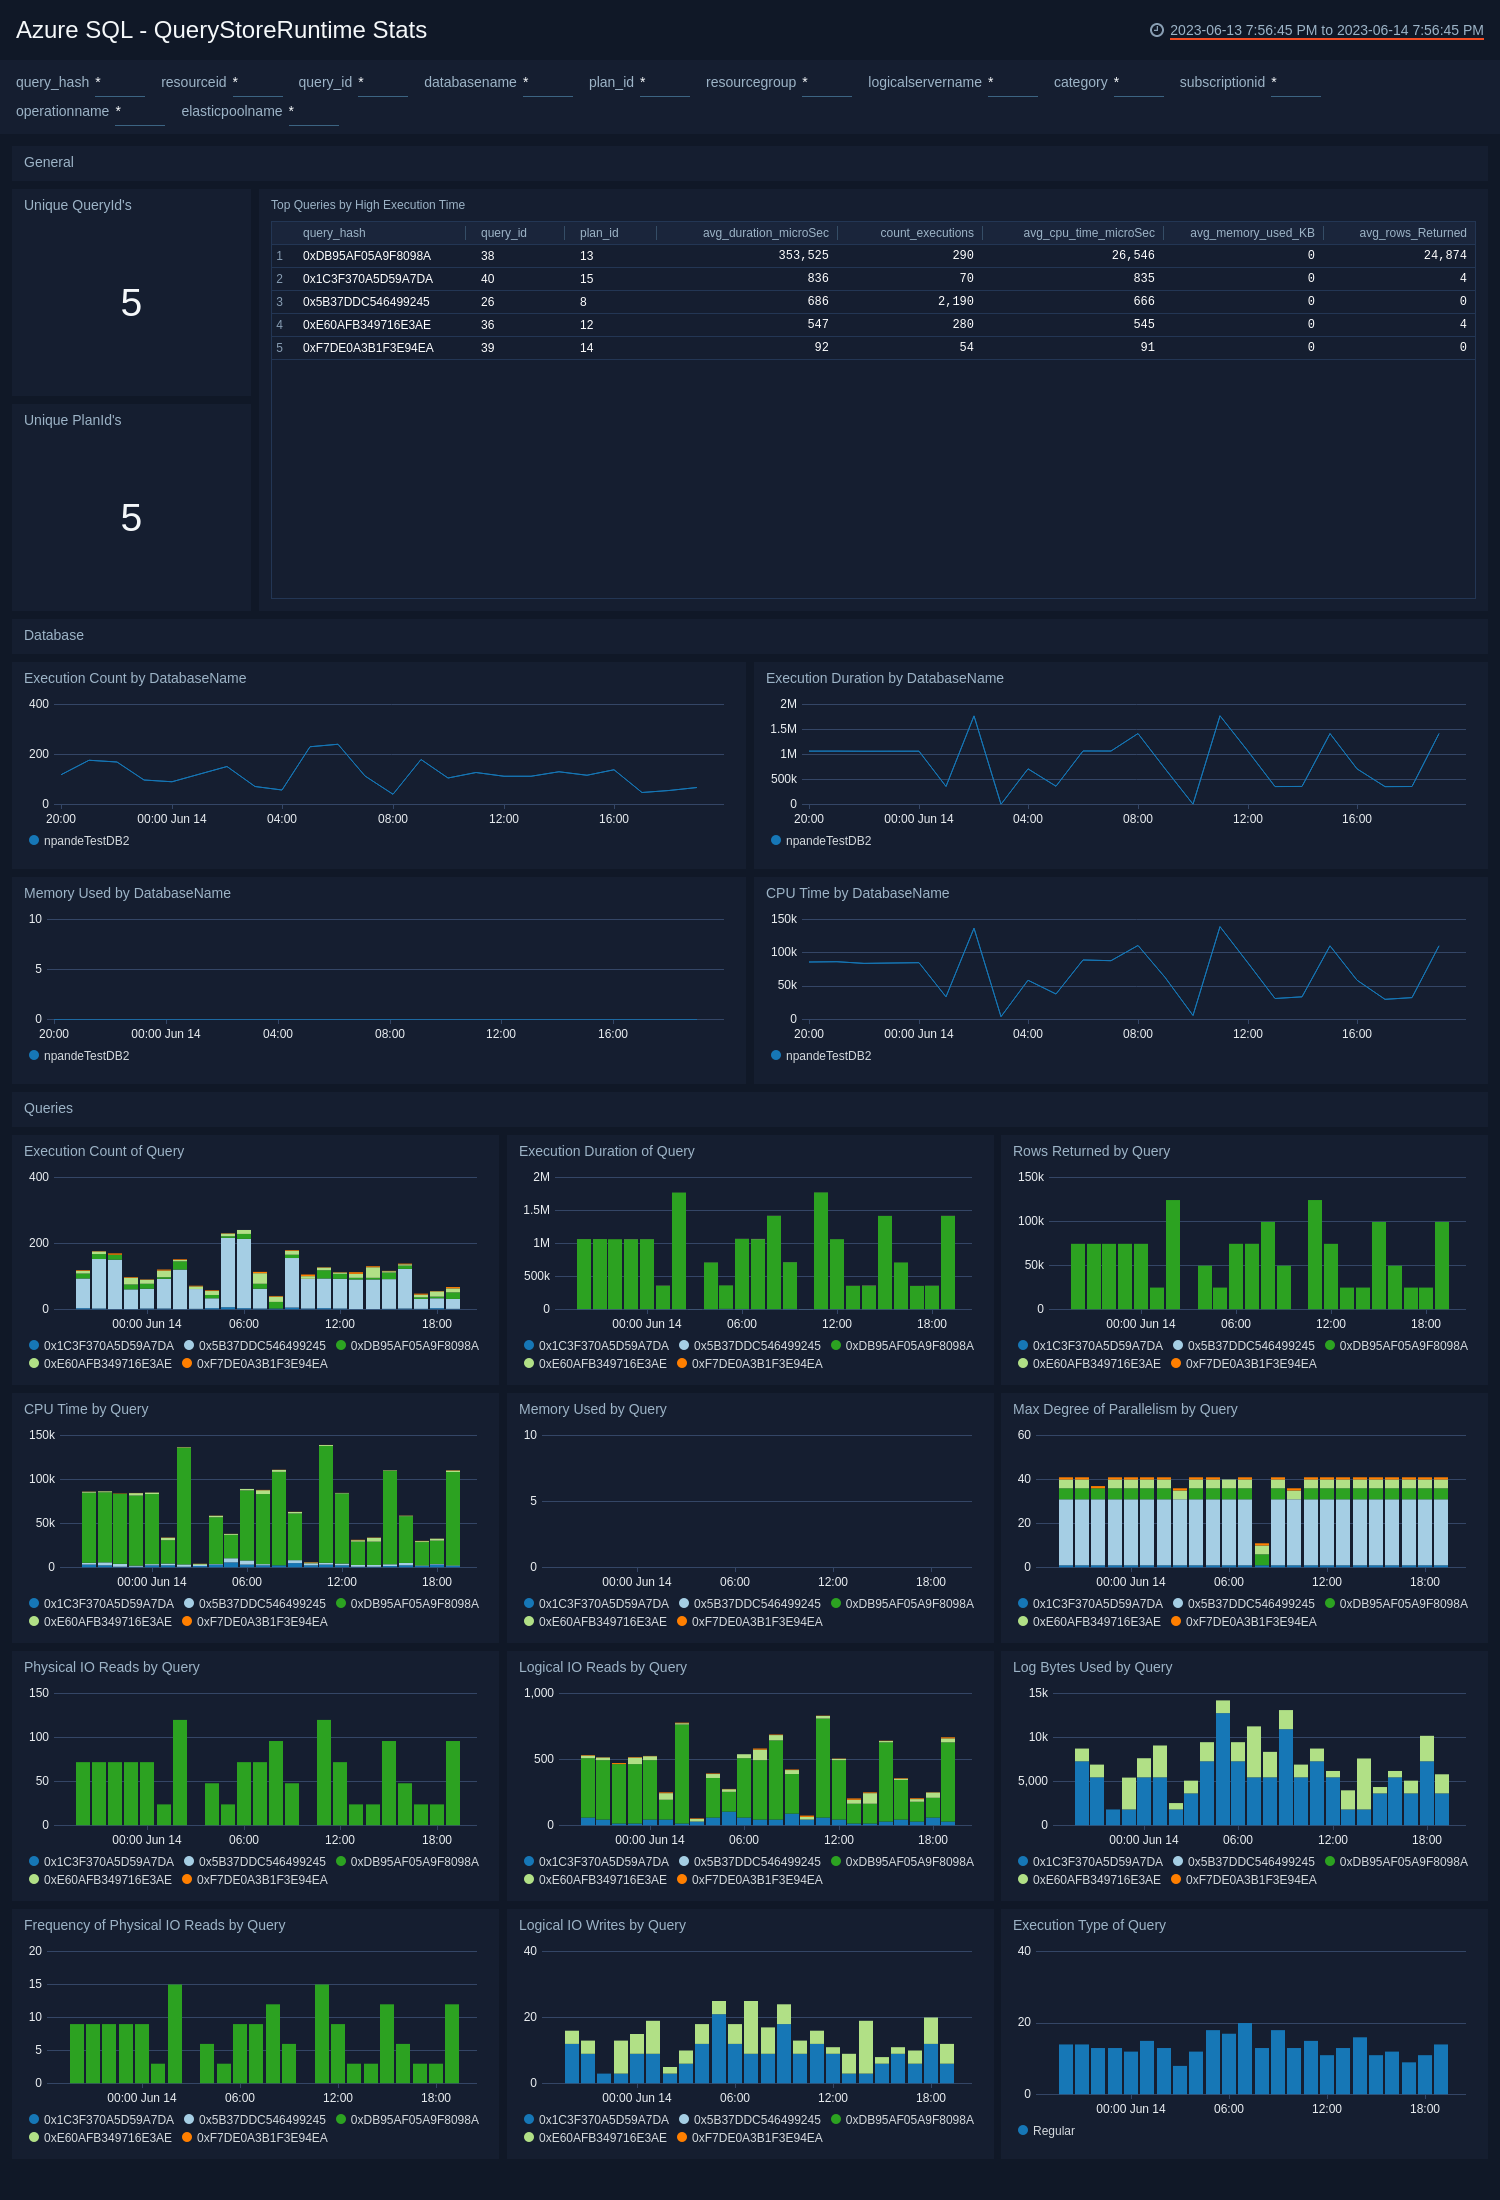
Unique QueryId's. The count of unique queryIDs over the last 24 hours.
Unique PlanId's.The count of unique PlanIDs over the last 24 hours.
Top Queries by High Execution Time. A table that lists the 15 queries with the longest execution time over the last 24 hours, and information about those queries.
Execution Count by DatabaseName. A line chart that shows the count of queries per timeslice for each database over the last 24 hours.
Execution Duration by DatabaseName. A line chart that shows the total duration (in milliseconds) of queries per timeslice for each database over the last 24 hours.
Memory Used by DatabaseName. A line chart that shows the maximum memory used per timeslice by each database over the last 24 hours.
CPU Time by DatabaseName. A line chart that shows the CPU time consumed (in microseconds) by queries per timeslice by each database over the last 24 hours.
Execution Count of Query. A stacked column chart that shows the count of each query per timeslice over the last 24 hours.
Execution Duration of Query. A stacked column chart that shows the total execution time in milliseconds for each query per timeslice over the last 24 hours.
Rows Returned by Query. A stacked column chart that shows the rows returned by each query per timeslice over the last 24 hours.
CPU Time by Query. A stacked column chart that shows the CPU time used by each query per timeslice over the last 24 hours.
Memory Used by Query. A stacked column chart that shows the memory used by each query per timeslice over the last 24 hours.
Max Degree of Parallelism by Query. A stacked column chart that shows the maximum degree of parallelism for each query per timeslice over the last 24 hours.
Physical IO Reads by Query. A stacked column chart that shows the count of reads from disk for each query per timeslice over the last 24 hours.
Logical IO Reads by Query. A stacked column chart that shows the count of reads from memory for each query per timeslice over the last 24 hours.
Log Bytes Used by Query. A stacked column chart that shows the count bytes written to the transaction log for each query per timeslice over the last 24 hours.
Execution Type of Query. A stacked column chart that shows the count of queries by execution type: Regular, Aborted, or Exception over the last 24 hours.
QueryStoreWait Stats
See information about how much time a database spent waiting on different wait types.
For more information about the statistics presented on the QueryStoreWaitStats dashboard, see Query Store wait statistics in Azure help.
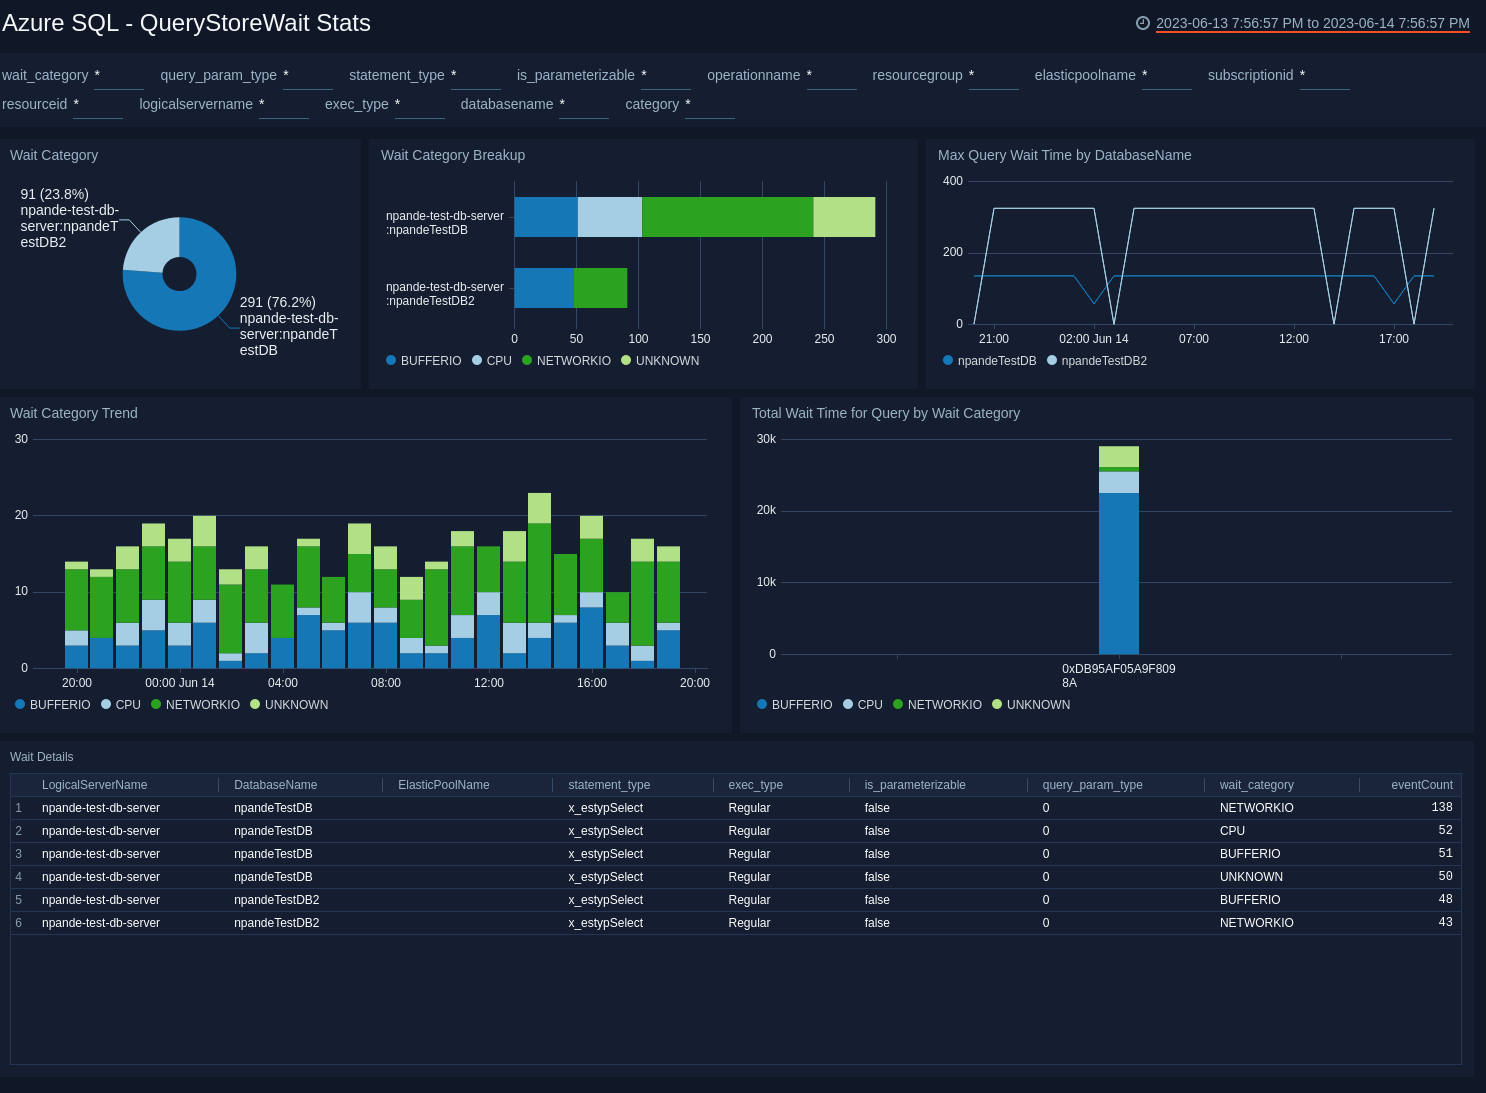
Wait Category. A donut chart that shows the breakdown of wait events by database over the last 24 hours.
Wait Category Breakup. A horizontal bar chart that shows the breakdown of wait event by category for each database over the last 24 hours.
Max Query Wait Time by DatabaseName. A line chart that shows that maximum query wait type per timeslice for each database over the last 24 hours.
Wait Category Trend. A stacked column chart that shows the count of wait events by category per timeslice over the last 24 hours.
Total Wait Time for Query by Wait Category. A stacked column chart that shows, for each query, the length of time a query spent waiting in each Wait Category over the last 24 hours.
Wait Details. The table displays wait statistics as encountered by queries on a given database, residing on a given logical server in the last 24 hours.
SQLInsights
See database performance analytics obtained from Azure SQL Database Intelligent Insights, including information about issues like excessive wait times, critical exceptions, and so on.
For more information about the data presented on the SQLInsights dashboard, see Use the Intelligent Insights Azure SQL Database performance diagnostics log in Azure help.
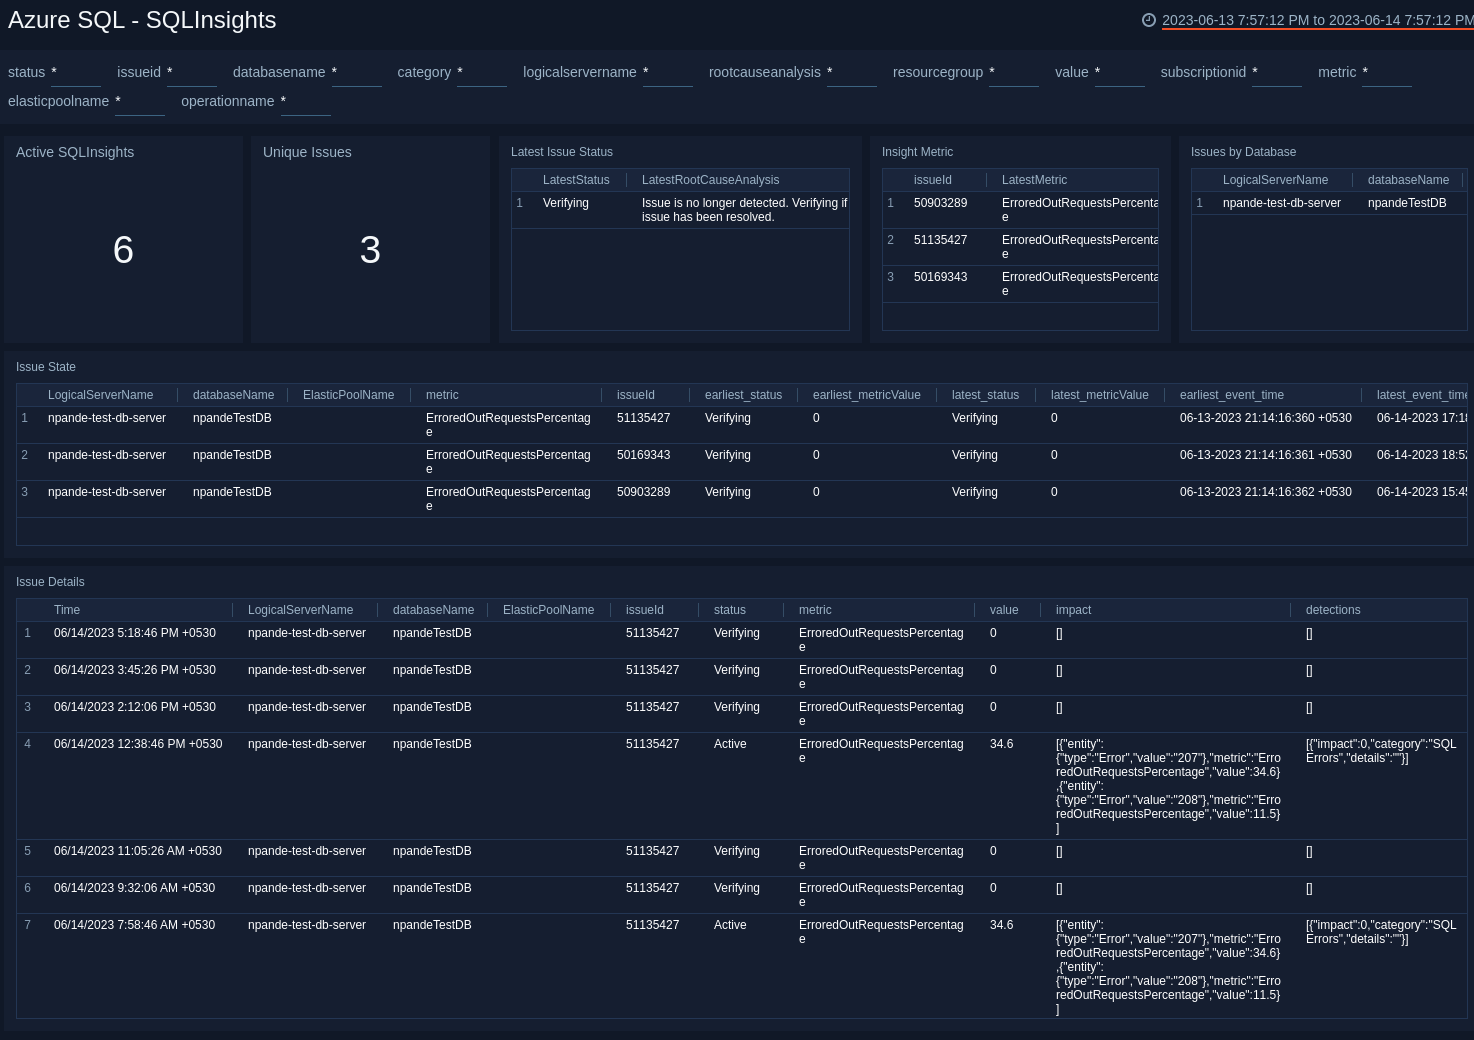
Active SQLInsights. Count of active SQL Insights issues as of the current time.
Unique Issues. Count of issues identified, whether resolved or not.
Latest Issue Status. Displays count of issues with latest state and root cause.
Insight Metric. Displays the performance metric for which an issue is identified, by IssueID.
Issues by Database. A table that shows the count of unique issues by database over the last 7 days.
Issue State. A table that shows the current state of unique issues, along with additional information about the issues over the last 7 days.
Issue Details. Displays information about the progress of issues throughout the resolution process.
Timeouts
See information about timeouts in Azure SQL.
For more information about the data presented on the Timeouts dashboard, see Time-outs dataset in Azure help.
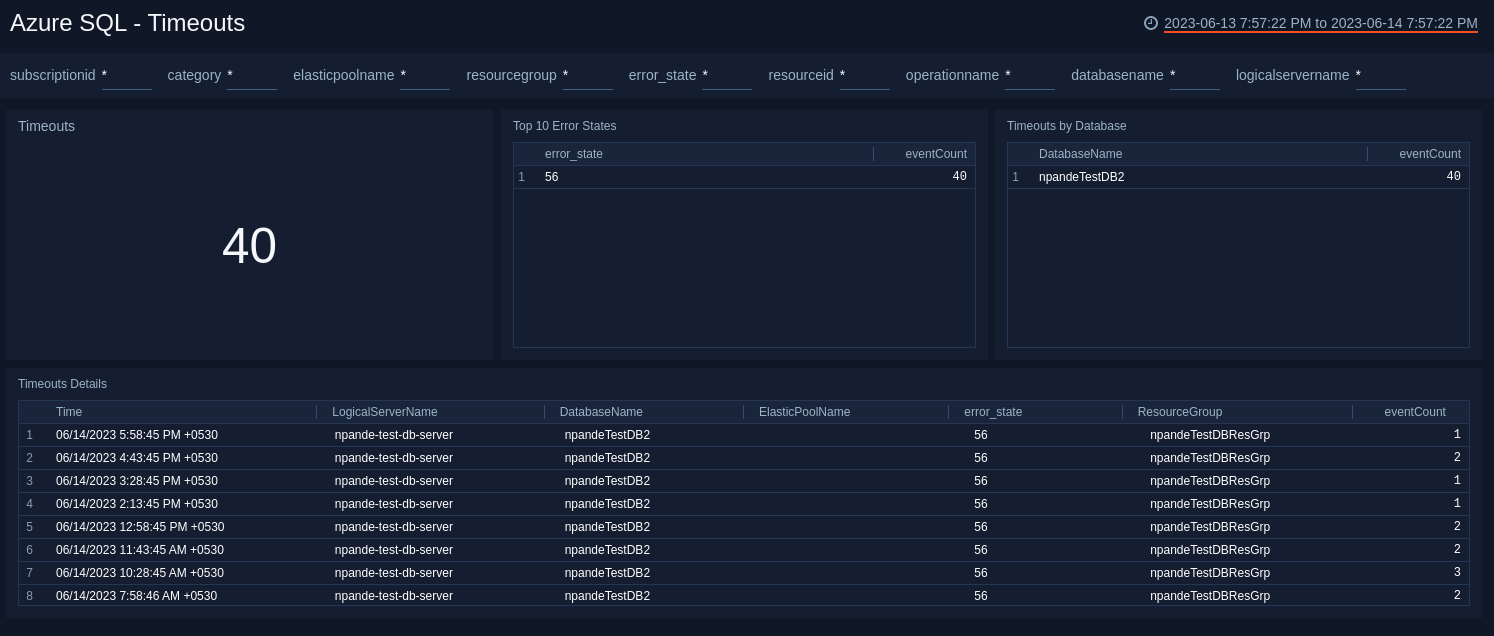
Timeouts. The count of timeouts over the last 7 days.
Top 10 Error States. A table that lists the top 10 errors states that have occurred over the last 7 days and the count of errors in each state.
Timeouts by Database. A table that lists the count of timeouts by database over the last 7 days.
Timeouts Details. A table that lists information about timeouts that have occurred over the last 7 days.