IIS 10 Legacy App

The IIS 10 (Legacy) App monitors the performance and reliability of your Microsoft Internet Information Services (IIS) infrastructure, identifying customer-facing and internal operational issues. This app also provides the ability to monitor customer paths and interactions, so you can analyze how customers are using your product. The app provides predefined searches and Dashboards, that give visibility into your environment for real-time and historical analysis.
Log Types
IIS 10 (Legacy) App uses IIS version 10 logs. This section demonstrates how to enable logging from Microsoft Internet Information Services (IIS) and HTTP Error Logs on your Windows server and ingest those logs into Sumo Logic.
IIS 10 App is backward compatible with IIS 8.5. IIS 10 App uses default log formats.
- IIS allows you to choose fields to log in IIS access logs. For explanations on the various fields and their significance see this link.
- For information on how to configure HTTP Error Logs, and for explanations on the various HTTP Error Log fields and their significance see this link.
This section covers the following default log formats for IIS 10 and IIS 8.5:
IIS Log files are generated as local files. For a standard Windows Server, the default log location is as follows:
%SystemDrive%\inetpub\logs\LogFiles
For example:
c:\inetpub\logs\LogFiles\
Within the folder, you will find subfolders for each site configured with IIS. The logs are stored in folders that follow a naming pattern like W3SVC1, W3SVC2, W3SVC3, etc. The number at the end of the folder name corresponds to your site ID. For example, W3SVC2 is for site ID 2.
Sample Log Messages
This section provides samples of the following log message types:
- IIS Access Logs
- HTTP Error Logs
- IIS Performance Logs
IIS Access Logs (W3C default format)
Sumo Logic expects logs in W3C format with following fields for our Field Extraction Rules and IIS 10 Application:
#Fields: date time s-ip cs-method cs-uri-stem cs-uri-query s-port cs-username c-ip
cs(User-Agent) cs(Referrer) sc-status sc-substatus sc-win32-status time-taken
IIS allows you to choose fields to log in IIS access logs. For explanations on the various fields and their significance see this link.
2019-03-14 07:58:10 10.0.0.104 PUT /Internal/RemoteShare/ ReturnUrl=%2fConfigWeb%2fAudit.aspx
443 - 160.44.59.168 Mozilla/5.0+(Windows+NT+6.1;+rv:50.0)+Gecko/20100101+Firefox/50.0
http://www.greylock.com 304 8 12030 58
2019-03-14 08:10:41 10.0.0.103 GET /welcome.png v=4.5.0 80 - 205.168.30.201
Mozilla/5.0+(compatible;+Googlebot/2.1;++http://www.google.com/bot.html)
http://www.bing.com/search?q=sumo%20applications&src=IE-SearchBox&FORM=IE11SR 200 8 12030 6
HTTP Error Logs
2019-03-14 20:10:10 10.20.190.10 45082 10.24.170.60 80 HTTP/1.1 GET
/GlobalVilla/MySwimmingPool/images/favicons/%2e%2e/%2e%2e/%2e%2e/%2e%2e/%2e%2e/%2e%2e/%2e%2e/%2e%2e/%2e%2e/%2e%2e/%2e%2e/%2e%2e/etc/passwd
403 - Forbidden -
2019-03-14 23:10:10 10.20.190.10 41095 10.24.170.60 80 HTTP/1.1 POST
/GlobalVilla/MySwimmingPool/sumodemo/upload.php 411 - LengthRequired -
2019-03-14 23:09:41 10.20.190.10 58152 10.24.170.60 80 - - - - - Timer_ConnectionIdle -
#Fields: date time c-ip c-port s-ip s-port protocol_version verb cookedurl_query
protocol_status siteId Reason_Phrase Queue_Name
For information on how to configure HTTP Error Logs, and for explanations on the various HTTP Error Log fields and their significance see this link.
IIS Performance Logs
Output of Perfmon queries to be configured at Installed Collector, "Windows Performance" Source.
#Fields: date time s-ip cs-method cs-uri-stem cs-uri-query s-port cs-usern…" with
"IIS Access Logs (W3C format) #Fields: date time s-ip cs-method cs-uri-stem cs-uri-query
s-port cs-us…
Below are examples of IIS Performance Log formats produced by two different queries. For more information on other W3SVC WebServices Perfmon Counters refer to this documentation.
This Perfmon query:
select TotalMethodRequestsPerSec, GetRequestsPerSec, PostRequestsPerSec, CurrentConnections,
CurrentAnonymousUsers, CurrentNonAnonymousUsers, CGIRequestsPerSec, ISAPIExtensionRequestsPerSec,
BytesReceivedPerSec, BytesSentPerSec, FilesReceivedPerSec, FilesSentPerSec, ServiceUptime,
BytesTotalPerSec from Win32_PerfFormattedData_W3SVC_WebService
Produces the following log format:
instance of Win32_PerfFormattedData_W3SVC_WebService
{
BytesReceivedPersec = "50";
BytesSentPersec = "125";
BytesTotalPersec = "75";
CGIRequestsPersec = 0;
CurrentAnonymousUsers = 10;
CurrentConnections = 9;
CurrentNonAnonymousUsers = 8;
FilesReceivedPersec = 0;
FilesSentPersec = 0;
GetRequestsPersec = 6;
ISAPIExtensionRequestsPersec = 0;
Name = "_Total";
PostRequestsPersec = 2;
ServiceUptime = 2398147;
TotalMethodRequestsPersec = 0;
};
This Perfmon query:
Select ArrivalRate, CurrentQueueSize, CacheHitRate, RejectionRate, MaxQueueItemAge from
Win32_PerfFormattedData_Counters_HTTPServiceRequestQueues
Produces the following log format:
instance of Win32_PerfFormattedData_Counters_HTTPServiceRequestQueues
{
ArrivalRate = "100";
CacheHitRate = "27";
CurrentQueueSize = 0;
MaxQueueItemAge = "0";
Name = "GlobalVillage";
RejectionRate = "0";
};
Sample Queries
The following query sample is taken from the Top Server Errors by Server panel on the IIS 10 - Server Operations - Error dashboard.
_sourceCategory=Webserver/IIS/Access 5*
| parse regex "(?<server_ip>\d{1,3}\.\d{1,3}\.\d{1,3}\.\d{1,3}) (?<method>\S+?)
(?<cs_uri_stem>\S+?) (?<cs_uri_query>\S+?) (?<s_port>\S+?) (?<cs_username>\S+?)
(?<c_ip>\S+?) (?<cs_User_Agent>\S+?) (?<cs_referer>\S+?) (?<sc_status>\S+?)
(?<sc_substatus>\S+?) (?<sc_win32_status>\S+?) (?<time_taken>\S+?)$"
| where sc_status matches "5*"
| count by server_ip, cs_uri_stem, sc_status, sc_substatus, sc_win32_status | sort - _count
The following query sample is taken from the Top Reason Phrase panel on the IIS 10 - HTTP Error dashboard.
_sourceCategory=Webserver/IIS/Error
| parse regex "(?<c_ip>\d{1,3}\.\d{1,3}\.\d{1,3}\.\d{1,3}) (?<c_port>\S+?)
(?<server_ip>\d{1,3}\.\d{1,3}\.\d{1,3}\.\d{1,3}) (?<s_port>\S+?) (?<protocol_version>\S+?)
(?<verb>\S+?) (?<cookedurl_query>\S+?) (?<Protocol_Status>\S+?) (?<SiteId>\S+?)
(?<Reason_Phrase>\S+?) (?<Queue_Name>\S+?)$"
| count by Reason_Phrase
| top 10 Reason_Phrase by _count, Reason_Phrase
The following query sample is taken from the IIS Site Uptime panel on the IIS 10 (Legacy) - Overview dashboard.
_sourceCategory=Webserver/IIS/PerfCounter
Win32_PerfFormattedData_W3SVC_WebService ServiceUptime
| parse "Name = \"*\";" as Name
| parse "ServiceUptime = *;" as ServiceUptime
| withtime ServiceUptime
| most_recent(ServiceUptime_withtime) as ServiceUptime by Name
| ServiceUptime / (60*60*24) as ServiceUptimeDays
| sort by ServiceUptimeDays, Name asc
| fields -ServiceUptime
Collecting Logs for the IIS 10 (Legacy) App
Prerequisite tasks
The following tasks are required to prepare for logging IIS events:
- Enable logging on your IIS server, if not already enabled
- Verify log files are being created
- Enable HTTP Error Logs on your Windows server
Enable logging on your IIS Server
Perform the following task, if logging on your IIS Server is not already enabled.
To enable logging on your IIS Server, do the following:
- Open IIS Manager.
- Select the site or server in the Connections pane, and then double-click Logging.
Enhanced logging is only available for site-level logging. If you select the server in the Connections pane, then the Custom Fields section of the W3C Logging Fields dialog is disabled.
In the Format field under Log File, select W3C and then click Select Fields. IIS 10 App works on default fields selection.
Select following fields, if not already selected. Sumo Logic expects these fields in IIS logs for the IIS Application and Field Extraction Rule by default:
date time s-ip cs-method cs-uri-stem cs-uri-query s-port
cs-username c-ip cs(User-Agent) cs(Referer) sc-status
sc-substatus sc-win32-status time-taken
For more information about IIS log format and log configuration refer link.
Verify that log files are created
Perform the following task to ensure that log files are being created.
To confirm log files are being created, do the following:
- Open a command-line window and change directories to C:\inetpub\Logs\LogFiles. This is the same path you will enter when you configure the Source to collect these files.
- Under the \W3SVC1 directory, you should see one or more files with a .log extension. If the file is present, you can collect it.
Enable HTTP Error Logs on your Windows Server
Perform the following task to enable HTTP Error Logs on your Windows Server, that is hosting the IIS Server.
To enable HTTP Error Logs on the Windows Server hosting IIS Server, do the following:
- To configure HTTP Error Logging, refer to this document link.
- To understand HTTP Error Log format, refer to this document link.
HTTP Error Log files are generated as local files. The default HTTP Error log file location is:
C:\Windows\System32\LogFiles\HTTPERR
Configure a Collector
Sumo Logic recommends that you install the collector on the same system that hosts the logs.
To collect logs for the IIS 10 App, you will install a local Collector on the same server that hosts the logs.
- Follow the instructions for an Installed Collector (Windows).
Configure Sources
This section demonstrates how to configure sources for the following log types:
Configure Source for IIS Access Logs
This section demonstrates how to configure a Local File Source for IIS Access Logs, for use with an Installed Collector. You may configure a Remote File Source, but the configuration is more complex.
Sumo Logic recommends using a Local File Source whenever possible.
To configure a local file source for IIS Access Logs, do the following:
- Configure a Local File Source.
- Specify Local File Source Fields as follows:
- Name: Required (for example, "IIS")
- Description. (Optional)
- File Path (Required).C:\inetpub\Logs\LogFiles\W3SVC**.log
- Collection start time. Choose how far back you would like to begin collecting historical logs. For example, choose 7 days ago to being collecting logs with a last modified date within the last seven days.
- Source Host. Sumo Logic uses the hostname assigned by the operating system by default, but you can enter a different host name.
- Source Category (Required). For example, "Webserver/IIS/Access". (The Source Category metadata field is a fundamental building block to organize and label Sources. For details see Best Practices.)
- Configure the Advanced section: 7. Timestamp Parsing Settings: Make sure the setting matches the timezone on the log files. 8. Enable Timestamp Parsing: Select Extract timestamp information from log file entries. 9. Time Zone: Select the option to Use time zone from log file. If none is present use: and set the timezone to UTC. 10. Timestamp Format: Select the option to Automatically detect the format. 11. Encoding. UTF-8 is the default, but you can choose another encoding format from the menu if your IIS logs are encoded differently. 12. Enable Multiline Processing. Uncheck the box to Detect messages spanning multiple lines. Since IIS Error logs are single line log files, disabling this option will ensure that your messages are collected correctly.
- Click Save.
After a few minutes, your new Source should be propagated down to the Collector and will begin submitting your IIS log files to the Sumo Logic service.
Configure Source for HTTP Error Logs
This section demonstrates how to configure a Local File Source for HTTP Error Logs, for use with an Installed Collector. You may configure a Remote File Source, but the configuration is more complex.
Sumo Logic recommends using a Local File Source whenever possible.
To configure a local file source for HTTP Error Logs, do the following:
- Configure a Local File Source.
- Specify the Local File Source Fields as follows:
- Name: Required (for example, "HTTP Error Logs")
- Description. (Optional)
- File Path (Required). C:\Windows\System32\LogFiles\HTTPERR*.*
- Collection start time. Choose how far back you would like to begin collecting historical logs. For example, choose 7 days ago to being collecting logs with a last modified date within the last seven days.
- Source Host. Sumo Logic uses the hostname assigned by the operating system by default, but you can enter a different host name.
- Source Category (Required). For example, "Webserver/IIS/Error". (The Source Category metadata field is a fundamental building block to organize and label Sources. For details see Best Practices.)
- Configure the Advanced section: 7. Timestamp Parsing Settings: Make sure the setting matches the timezone on the log files. 8. Enable Timestamp Parsing: Select Extract timestamp information from log file entries. 9. Time Zone: Select the option to Use time zone from log file. If none is present use: and set the timezone to UTC. 10. Timestamp Format: Select the option to Automatically detect the format. 11. Encoding. UTF-8 is the default, but you can choose another encoding format from the menu if your IIS logs are encoded differently. 12. Enable Multiline Processing. Uncheck the box to Detect messages spanning multiple lines. Since IIS Error logs are single line log files, disabling this option will ensure that your messages are collected correctly.
- Click Save.
After a few minutes, your new Source should be propagated down to the Collector and will begin submitting your IIS HTTP Error log files to the Sumo Logic service.
Configure Source for IIS Performance (Perfmon) Logs
This section demonstrates how to configure a Windows Performance Source, for use with an Installed Collector.
Sumo Logic recommends using a Local Windows Performance source whenever possible.
Use the appropriate source for your environment:
To configure a Source for IIS Performance Logs, do the following:
- Configure a Local Windows Performance Monitor Log Source.
- Configure the Local Windows Performance Source Fields as follows:
- Name: Required (for example, "IIS Performance")
- Source Category (Required). For example, Webserver/IIS/PerfCounter. (The Source Category metadata field is a fundamental building block to organize and label Sources. For details see Best Practices.)
- Frequency: Every Minute (you may custom choose frequency)
- Description. (Optional)
- Under Perfmon Queries Click Add Query.
- Add the following two queries:
- Query 1:
- For Name, enter WebServices
- For Query, enter select TotalMethodRequestsPerSec, GetRequestsPerSec, PostRequestsPerSec, CurrentConnections, CurrentAnonymousUsers, CurrentNonAnonymousUsers, CGIRequestsPerSec, ISAPIExtensionRequestsPerSec, BytesReceivedPerSec, BytesSentPerSec, FilesReceivedPerSec, FilesSentPerSec, ServiceUptime, BytesTotalPerSec from Win32_PerfFormattedData_W3SVC_WebService
- Query 2:
- For Name, enter HTTPServiceRequestQueues
- For Query, enter Select ArrivalRate, CurrentQueueSize, CacheHitRate, RejectionRate, MaxQueueItemAge from Win32_PerfFormattedData_Counters_HTTPServiceRequestQueues
- Click Save.
Field Extraction Rules
This section provides examples of the following field extraction rule types:
- IIS Access Logs
- HTTP ERROR Logs
- Performance Logs (perfmon Query for W3SVC_WebService)
- Performance Logs (perfmon Query for Counters_HTTPServiceRequestQueues)
IIS Access Logs Field Extraction Rule
_sourceCategory=Webserver/IIS/Access
| parse regex "(?<server_ip>\d{1,3}\.\d{1,3}\.\d{1,3}\.\d{1,3}) (?<method>\S+?)
(?<cs_uri_stem>\S+?) (?<cs_uri_query>\S+?) (?<s_port>\S+?) (?<cs_username>\S+?)
(?<c_ip>\S+?) (?<cs_User_Agent>\S+?) (?<cs_referer>\S+?) (?<sc_status>\S+?)
(?<sc_substatus>\S+?) (?<sc_win32_status>\S+?) (?<time_taken>\S+?)$"
HTTP ERROR Logs Field Extraction Rule
_sourceCategory=Webserver/IIS/Error
| parse regex "(?<c_ip>\d{1,3}\.\d{1,3}\.\d{1,3}\.\d{1,3}) (?<c_port>\S+?)
(?<server_ip>\d{1,3}\.\d{1,3}\.\d{1,3}\.\d{1,3}) (?<s_port>\S+?) (?<protocol_version>\S+?)
(?<verb>\S+?) (?<cookedurl_query>\S+?) (?<Protocol_Status>\S+?) (?<SiteId>\S+?)
(?<Reason_Phrase>\S+?) (?<Queue_Name>\S+?)$"
Performance Logs (perfmon Query for W3SVC_WebService) Field Extraction Rule
_sourceCategory=Webserver/IIS/PerfCounter Win32_PerfFormattedData_W3SVC_WebService
| parse "Name = \"*\";" as Name nodrop
| parse "BytesReceivedPersec = \"*\";" as BytesReceivedPersec nodrop
| parse "BytesSentPersec = \"*\";" as BytesSentPersec nodrop
| parse "BytesTotalPersec = \"*\";" as BytesTotalPersec nodrop
| parse "CGIRequestsPersec = *;" as CGIRequestsPersec nodrop
| parse "CurrentAnonymousUsers = *;" as CurrentAnonymousUsers nodrop
| parse "CurrentConnections = *;" as CurrentConnections nodrop
| parse "CurrentNonAnonymousUsers = *;" as CurrentNonAnonymousUsers nodrop
| parse "FilesReceivedPersec = *;" as FilesReceivedPersec nodrop
| parse "FilesSentPersec = *;" as FilesSentPersec nodrop
| parse "GetRequestsPersec = *;" as GetRequestsPersec nodrop
| parse "ISAPIExtensionRequestsPersec = *;" as GetRequestsPersec nodrop
| parse "PostRequestsPersec = *;" as PostRequestsPersec nodrop
| parse "ServiceUptime = *;" as ServiceUptime nodrop
| parse "TotalMethodRequestsPersec = *;" as TotalMethodRequestsPersec nodrop
Performance Logs (perfmon Query for Counters_HTTPServiceRequestQueues) Field Extraction Rule
1 | _sourceCategory=Webserver/IIS/PerfCounter Win32_PerfFormattedData_Counters_HTTPServiceRequestQueues |
2 | | parse "Name = \"*\";" as Name nodrop |
3 | | parse "ArrivalRate = \"*\";" as ArrivalRate nodrop |
4 | | parse "CacheHitRate = \"*\";" as CacheHitRate nodrop |
5 | | parse "CurrentQueueSize = *;" as CurrentQueueSize nodrop |
6 | | parse "MaxQueueItemAge = \"*\";" as MaxQueueItemAge nodrop |
7 | | parse "RejectionRate = \"*\";" as RejectionRate nodrop |
Installing the IIS 10 (Legacy) App
This section demonstrates how to install the IIS 10 (Legacy) App and provides examples and explanations for each of the app's predefined dashboards.
Now that you have set up collection for IIS 10, you are ready to install the Sumo Logic App for IIS 10 that provides preconfigured searches and dashboards that monitor events generated by IIS 10.
To install the app, do the following:
Locate and install the app you need from the App Catalog. If you want to see a preview of the dashboards included with the app before installing, click Preview Dashboards.
- From the App Catalog, search for and select the app.
- Select the version of the service you're using and click Add to Library.
Version selection is applicable only to a few apps currently. For more information, see Installing the Apps from the Library.
- To install the app, complete the following fields.
- App Name. You can retain the existing name, or enter a name of your choice for the app.
- Data Source. Select either of these options for the data source.
- Choose Source Category, and select a source category from the list.
- Choose Enter a Custom Data Filter, and enter a custom source category beginning with an underscore. Example: (
_sourceCategory=MyCategory).
- Advanced. Select the Location in Library (the default is the Personal folder in the library), or click New Folder to add a new folder.
- Click Add to Library.
Once an app is installed, it will appear in your Personal folder, or other folder that you specified. From here, you can share it with your organization.
Panels will start to fill automatically. It's important to note that each panel slowly fills with data matching the time range query and received since the panel was created. Results won't immediately be available, but with a bit of time, you'll see full graphs and maps.
Viewing IIS 10 (Legacy) Dashboards
Each dashboard has a set of filters that you can apply to the entire dashboard, as shown in the following example. Click the funnel icon in the top dashboard menu bar to display a scrollable list of filters that are applied across the entire dashboard.
You can use filters to drill down and examine the data on a granular level.
Each panel has a set of filters that are applied to the results for that panel only, as shown in the following example. Click the funnel icon in the top panel menu bar to display a list of panel-specific filters.
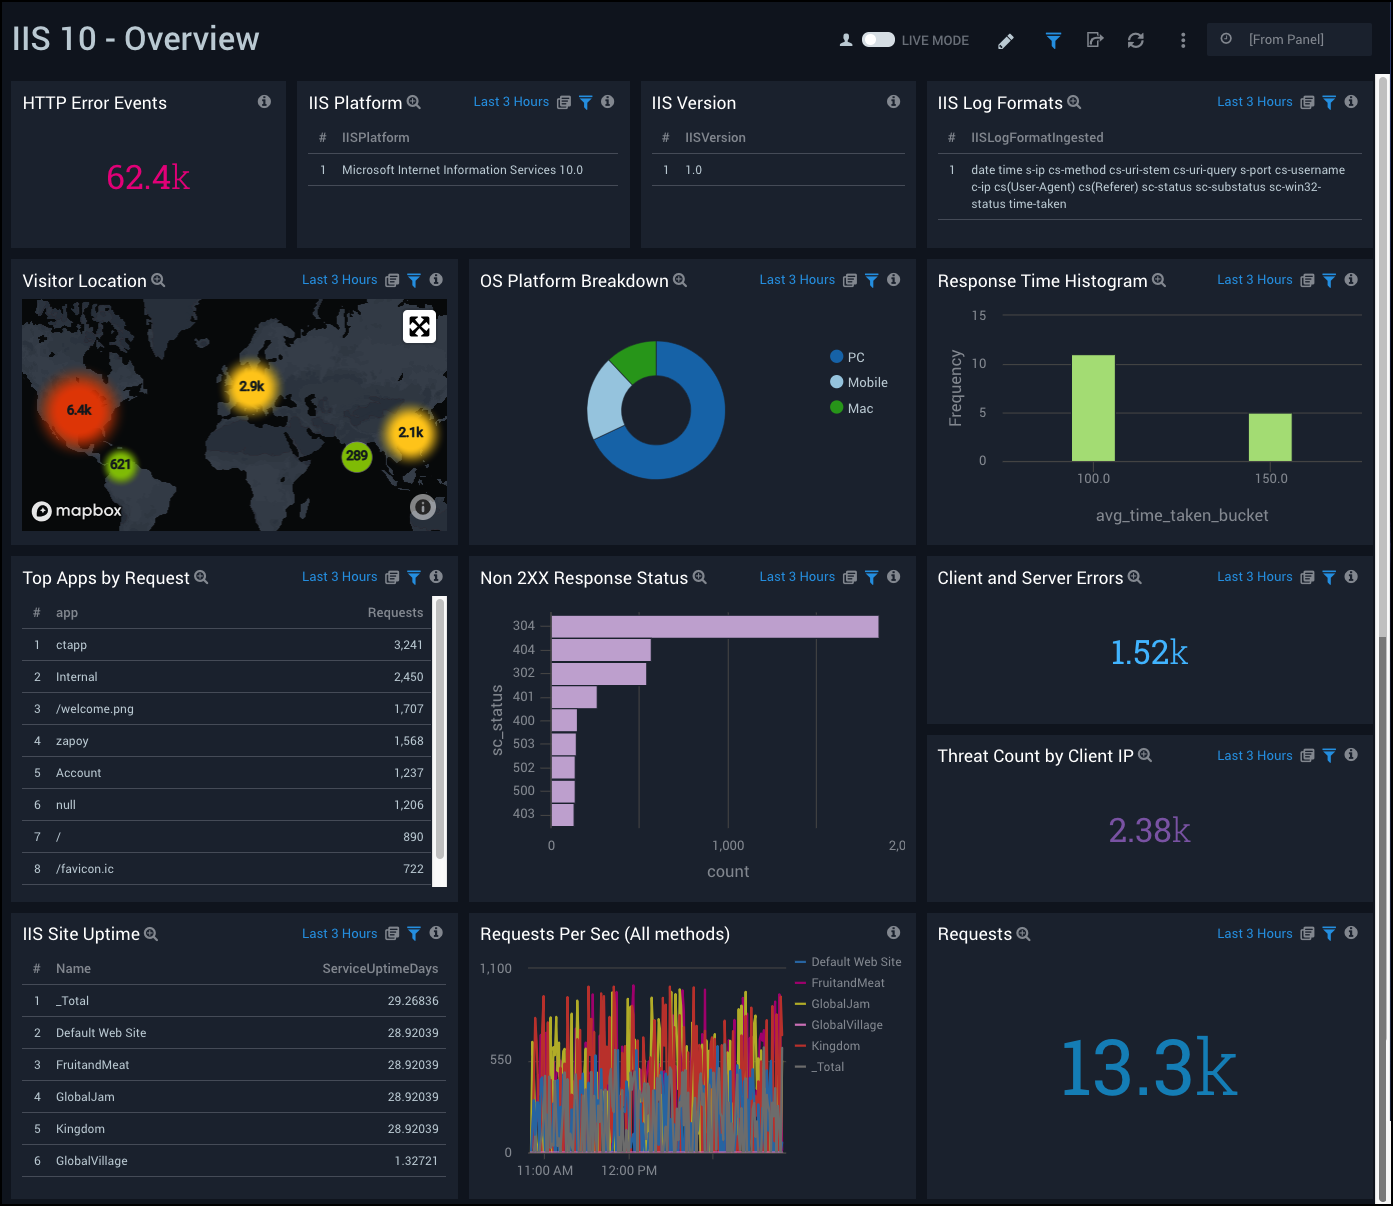
Overview Dashboard
The IIS 10 - Overview Dashboard provides a high-level view of the performance and integrity of your Microsoft Internet Information Services (IIS) infrastructure. Dashboard panels display visual graphs and detailed information on IIS versions, platforms, and log formats. Panels also show visitor geographic locations, top app requests. OS platforms, response status, response times, and client and server errors.
Use this dashboard to:
- Use this dashboard to get a high-level overview of sites, requests, client location, client platforms, error and threats identified.
- Drill Down to specific use cases by clicking on specific panels of interest.
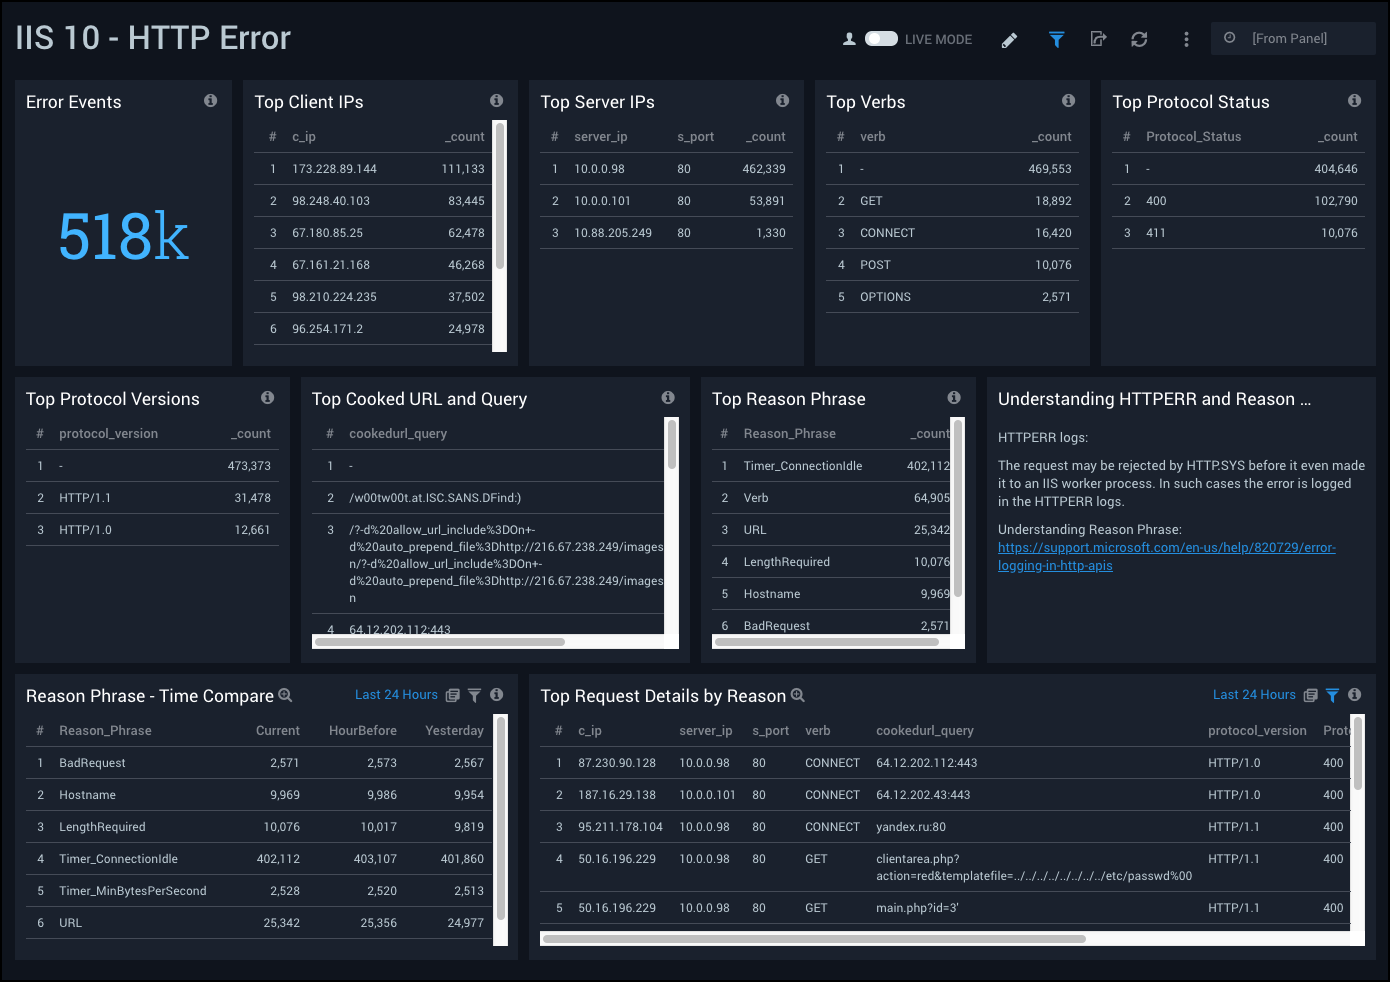
HTTP Error Dashboard
The IIS 10 - HTTP Error Dashboard provides detailed information on IIS error logging in HTTP. Dashboard panels show details on error events, top client and server IP addresses, top protocol versions and protocol status. Panels also show information on top reason phrases and verbs associated with HTTP errors, as well as top request details by reason.
Use this dashboard to:
- Monitor errors logged by HTTP.SYS. The client request may be rejected by HTTP.SYS before it made it to an IIS worker process. In such cases the error is logged in the HTTPERR logs.
- Identify the reason for failure. Check if the request violated the HTTP protocol, or if there was a WAS/the application pool failure.
- Correct the error identified to ensure a consistent and satisfactory user experience.
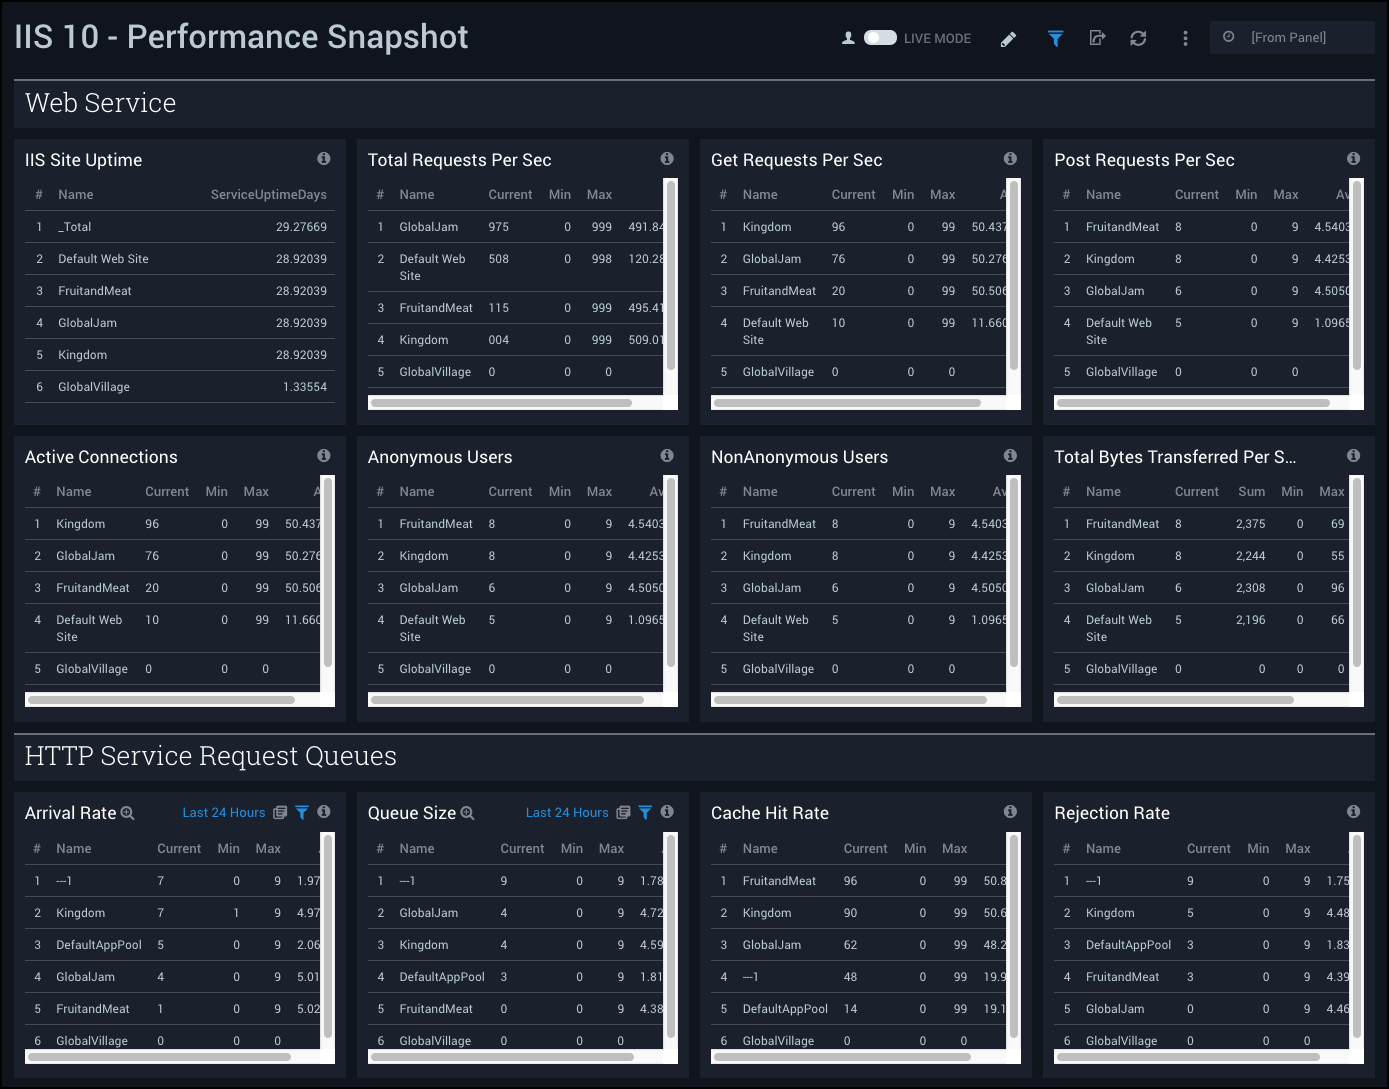
Performance Snapshot Dashboard
The IIS 10 - Performance Snapshot Dashboard provides detailed information on your IIS infrastructure integrity and performance. Dashboard panels show details on Web Service uptime, active connections, requests, user activity, and total bytes transferred. Panels also provide HTTP Service Request Queues details, such as arrivals, queue size, cache hit rate, and rejection rate.
Use this dashboard to:
- Monitor incoming request traffic, along with queue size and rejection rate to identify any bottlenecks.
- Monitor cache hit rates to check how requests are being served. Typically static content has high cache hit rates.
- Monitor current active connections to track sudden rises in connections. A sudden rise results in increased resource requirements. A sudden rise may also indicate security attack.
- Monitor the load on your site by looking into the rate of all the requests and rates based on specific types of HTTP methods, to anticipate resource needs and allocate them accordingly.
- Monitor Bytes/Files transferred, to check if there is a need to make page content more lightweight, or track the most typically transferred high data content. This can also be an indicator of a potential spike in traffic.
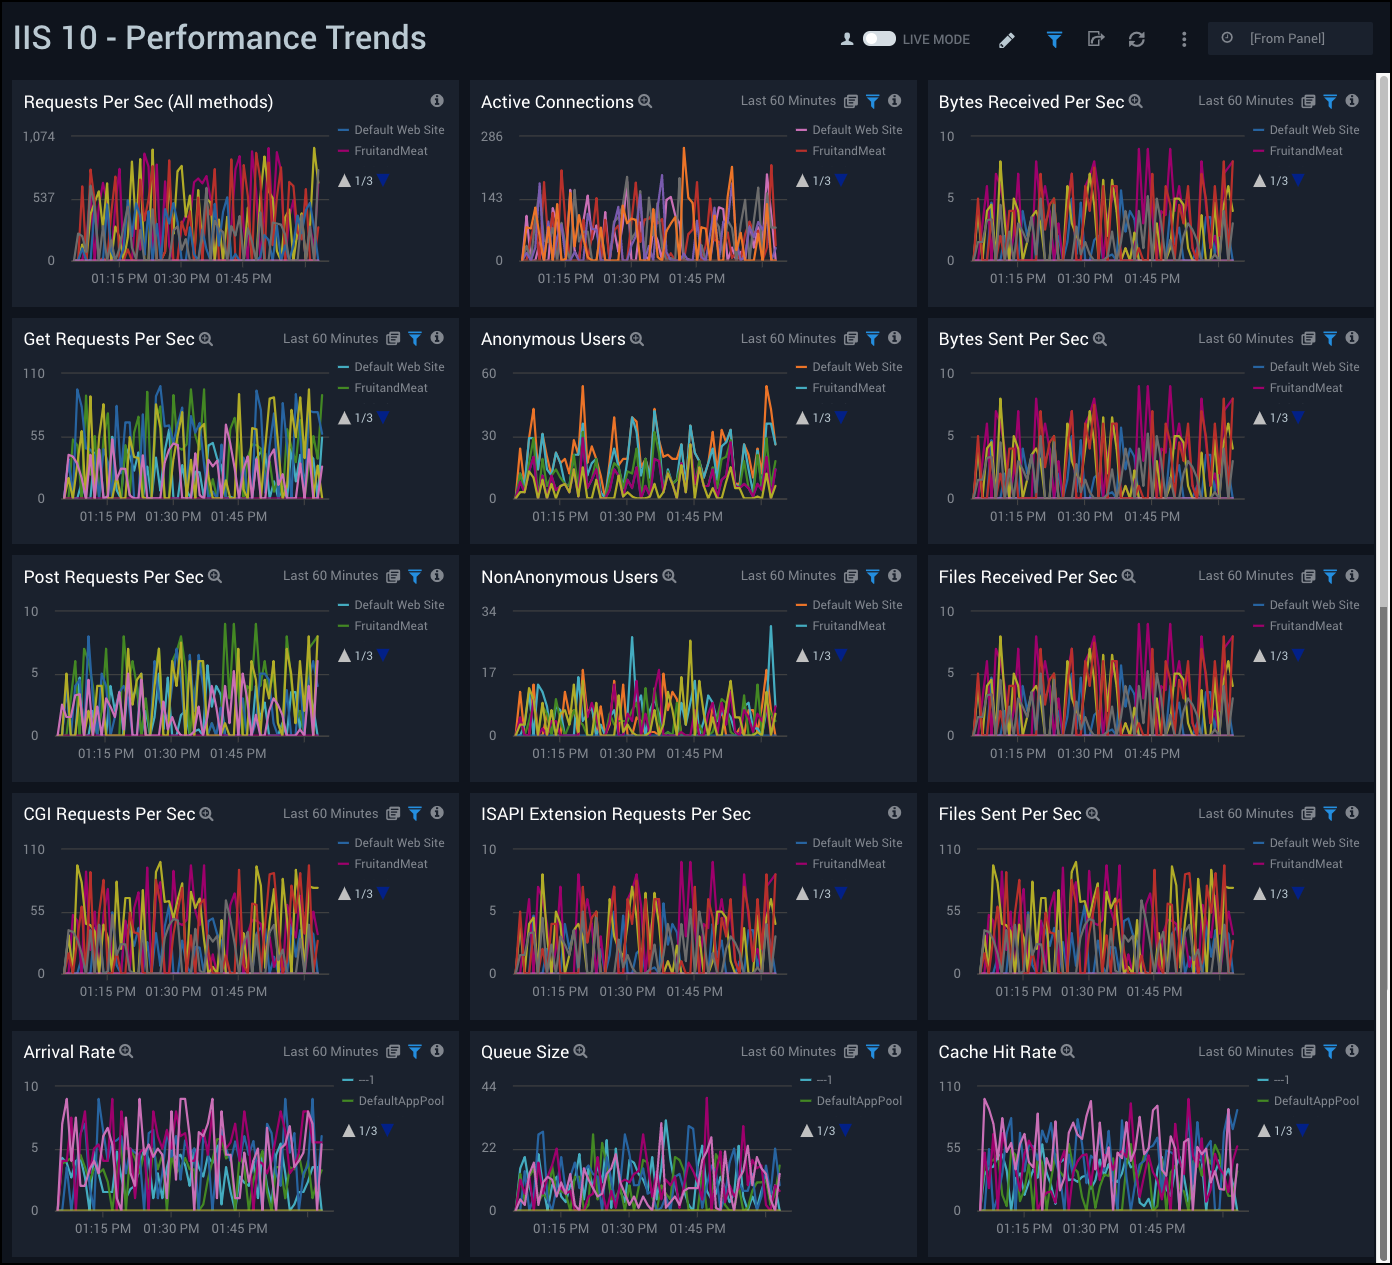
Performance Trends Dashboard
The IIS 10 - Performance Trends Dashboard provides details on ISS infrastructure trends for requests, active connections, bytes received and sent, files received and sent, queue size, arrival rate, and cache hit rate.
Use this dashboard to:
- Monitor trends of various metrics to keep track of how requests are served over time and anticipate potential performance bottlenecks.
- Acquire current performance snapshots of IIS servers. You can drill down to the Performance Snapshot by clicking the Requests Per Sec (All methods) panel.
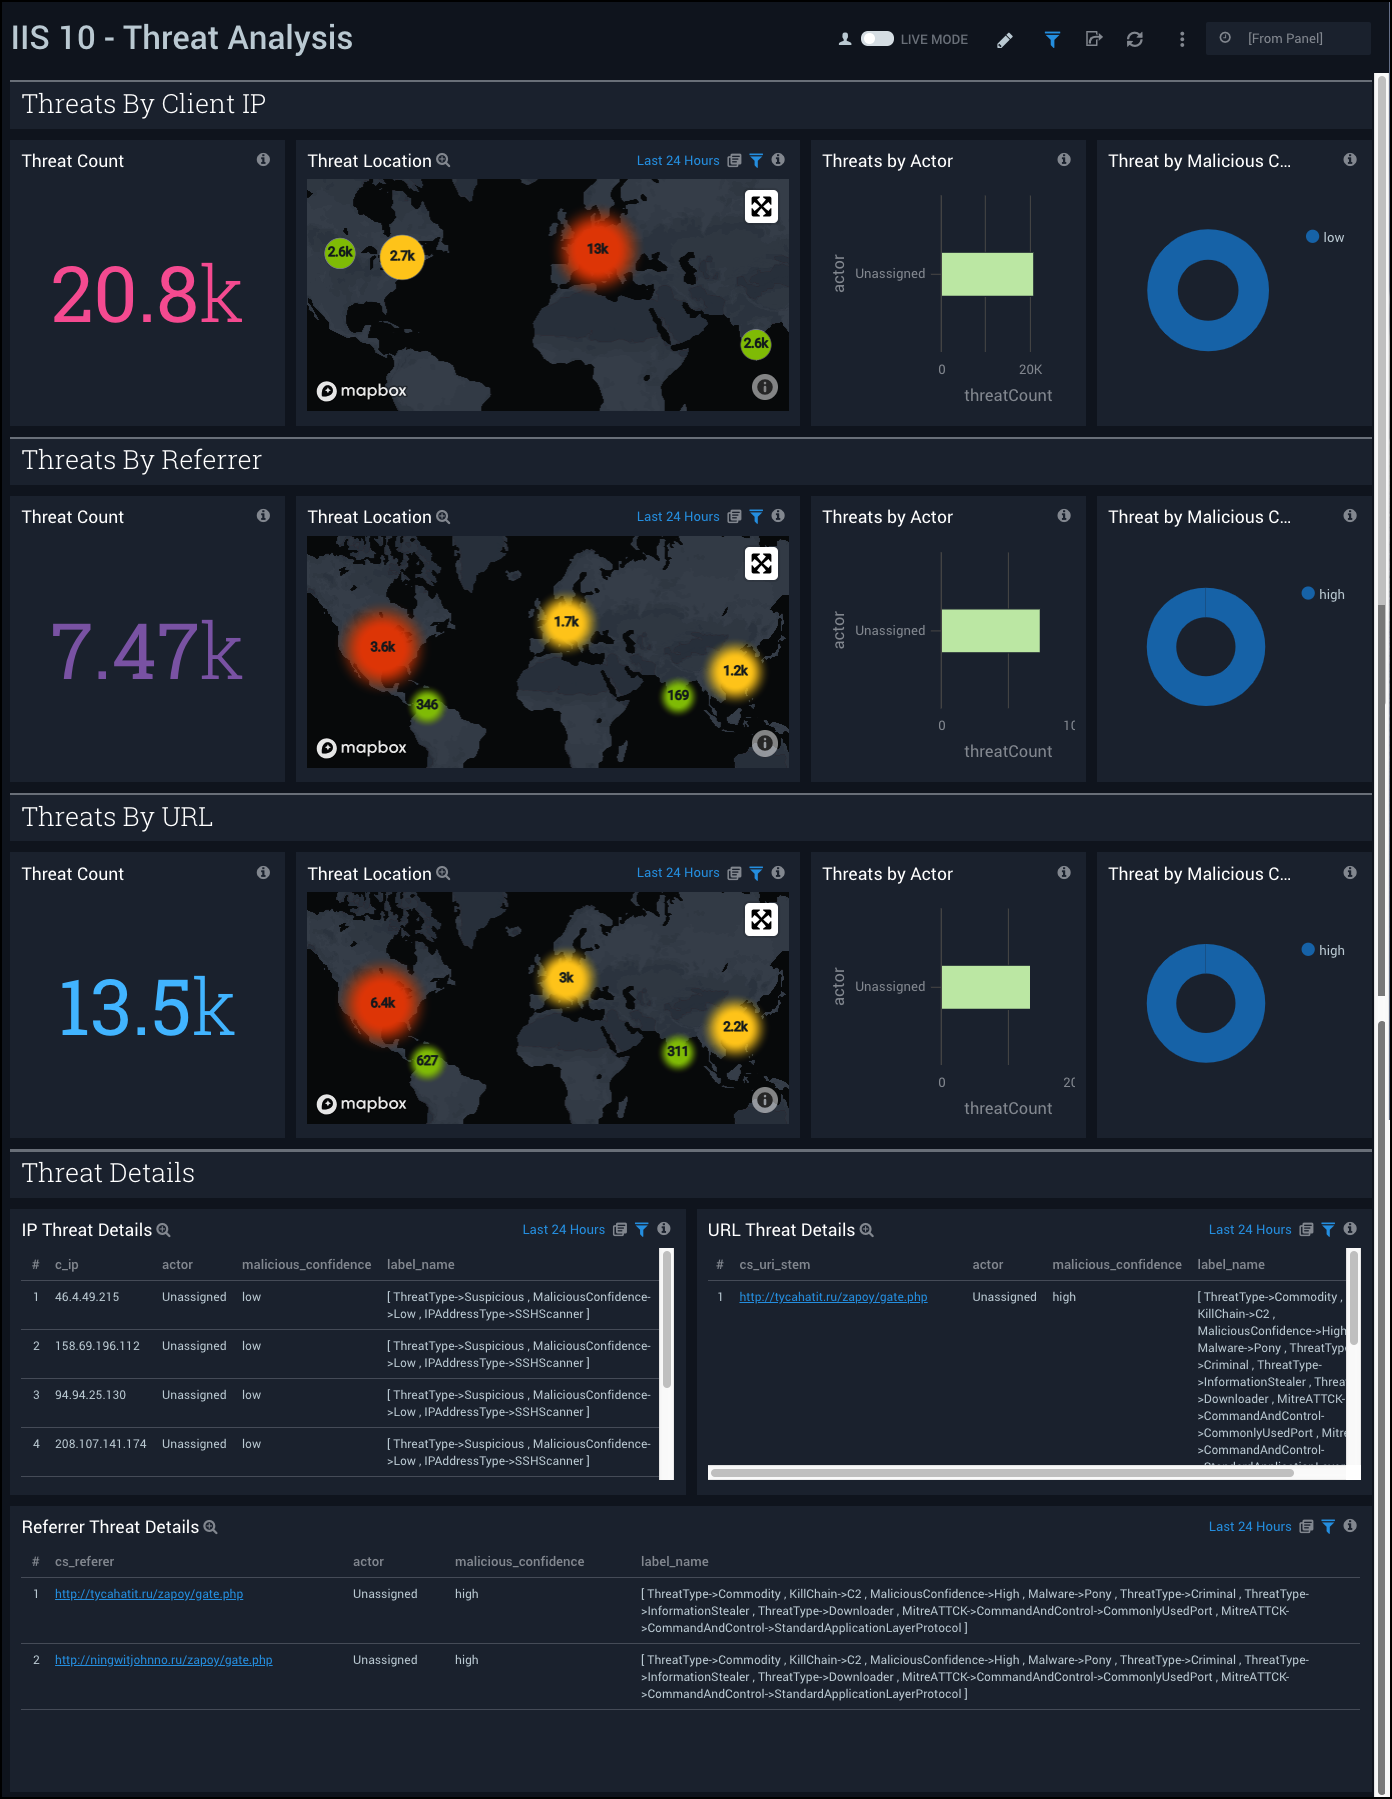
Threat Analysis Dashboard
The IIS 10 - Threat Analysis Dashboard provides high-level views of threats throughout your IIS network. Dashboard panels display visual graphs and detailed information on Threats by Client IP, Threats by Referrer, and Threats by URL.
Use this dashboard to:
- Identify potential threats and indicators of compromise.
- Monitor if your site is access through:
- bad Client IP
- referred by bad referrer
- your own webpage is page is tagged as malicious by CrowdStrike
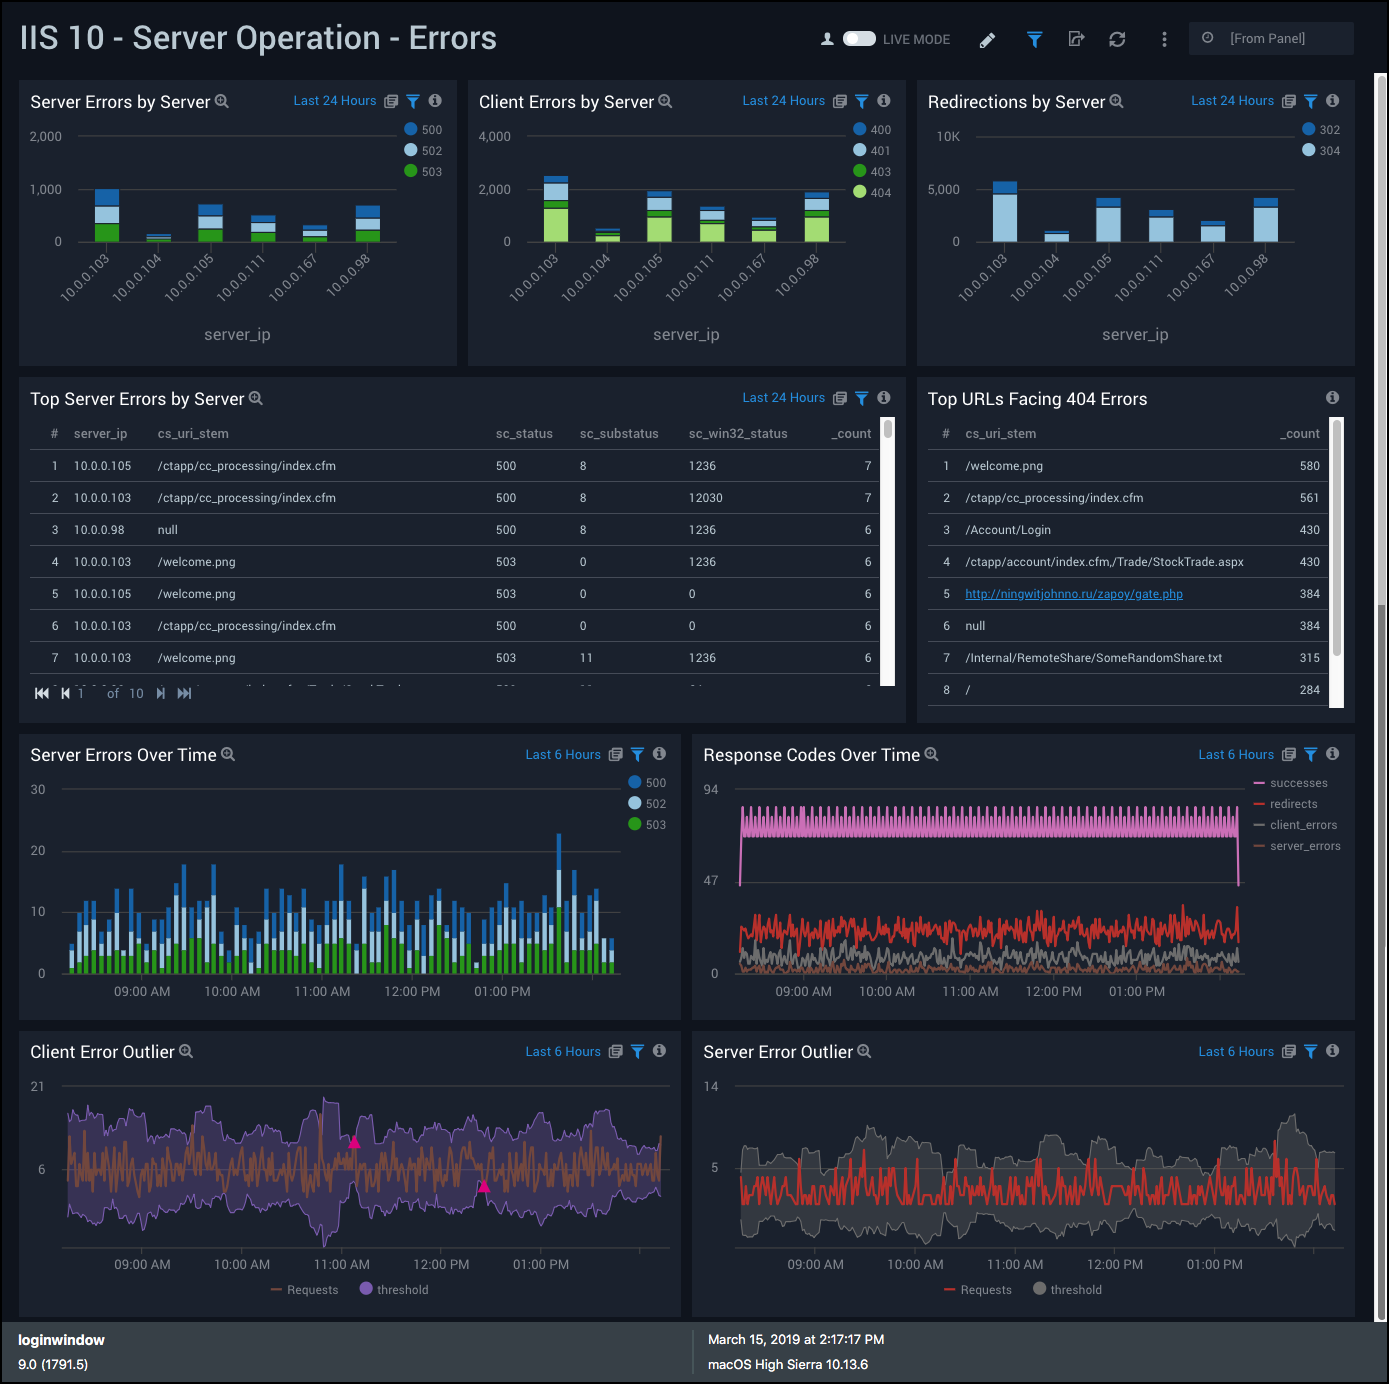
Server Operation - Errors Dashboard
The IIS 10 - Server Operation - Errors Dashboard provides visual graphs and detailed information on server operation errors in your IIS infrastructure. Dashboard panels show server errors by server, server errors over time, server error outliers, and redirections by server. Panels also show client errors by server, client error outliers, top URLS with 404 errors, and response codes over time.
Use this dashboard to:
- Monitor server errors (5xx), client errors (4xx) and redirections (3xx). Client errors indicate missing/error pages, user made some mistakes and needs clear direction to fix it. Server errors indicate some issues on the server end.
- Analyze redirection codes. Redirection indicates the document requested has moved and server is redirecting to new location. An SEO expert will be interested in 302 redirection code.
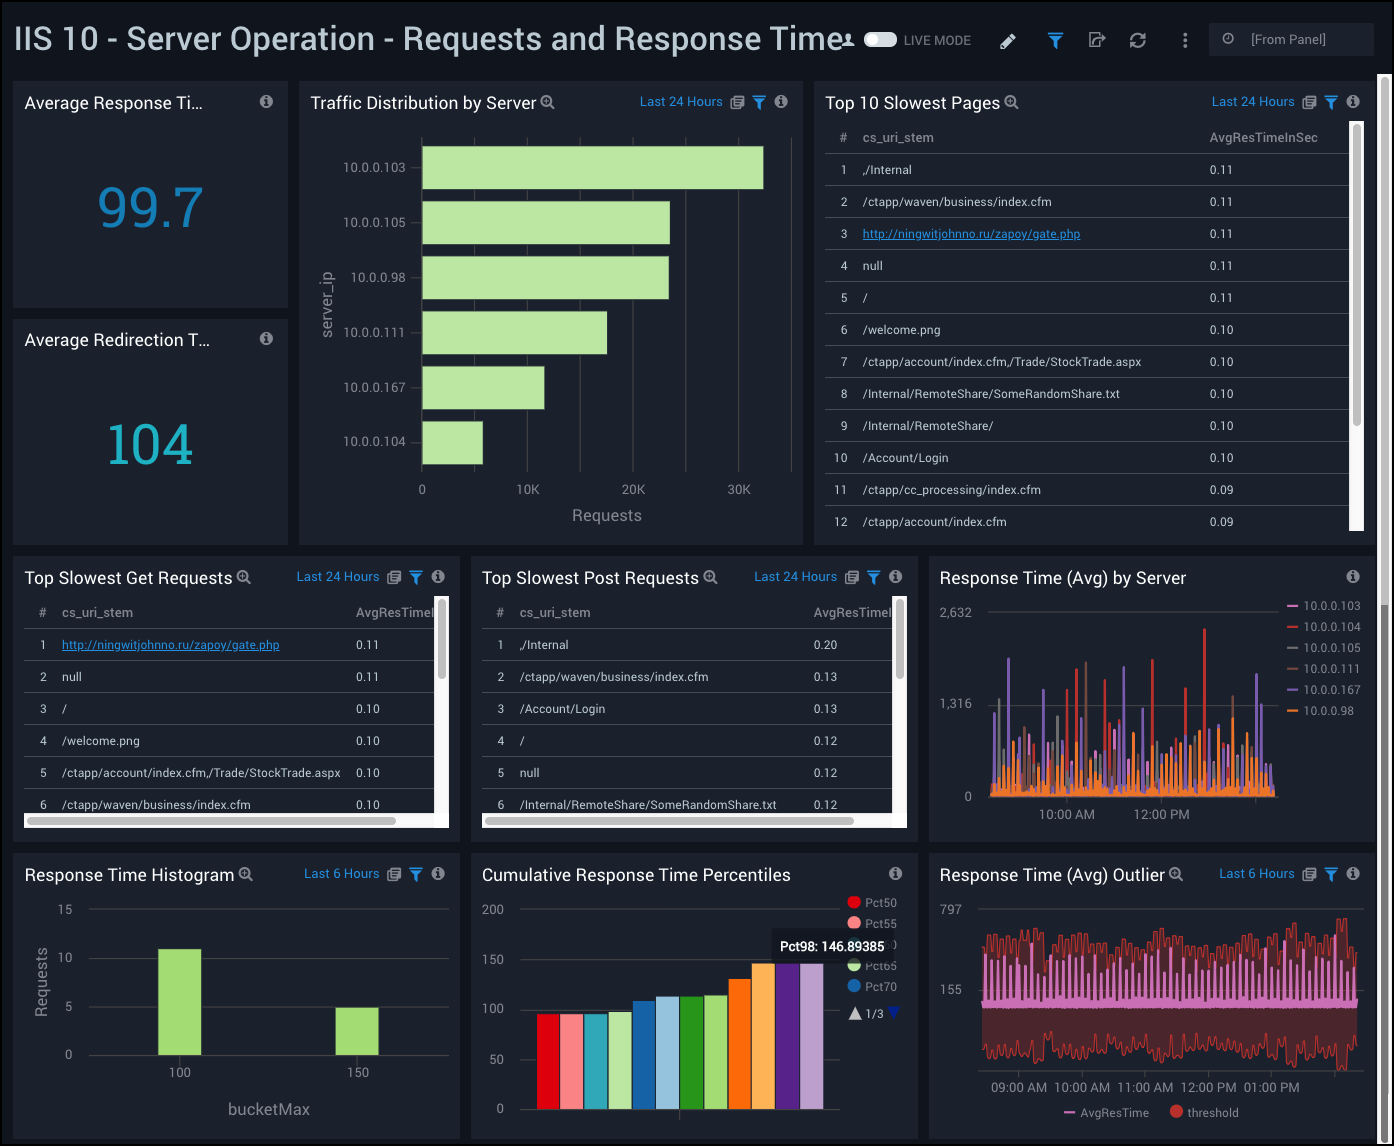
Server Operation - Requests and Response Time Dashboard
The IIS 10 - Server Operation - Requests and Response Time Dashboard provides visual graphs and detailed information for the integrity of performance throughout your IIS infrastructure. Dashboard panels show response time averages, cumulative percentiles, histograms, and outliers. Panels also show details for traffic distribution, slowest pages, slowest GET and POST requests, and average redirection time.
Use this dashboard to:
- Monitor response time details of each request. An increase in response time is a major cause for user dissatisfaction with any website.
- Diagnose the reason(s) for the deterioration in performance, in conjunction with the Performance dashboards.
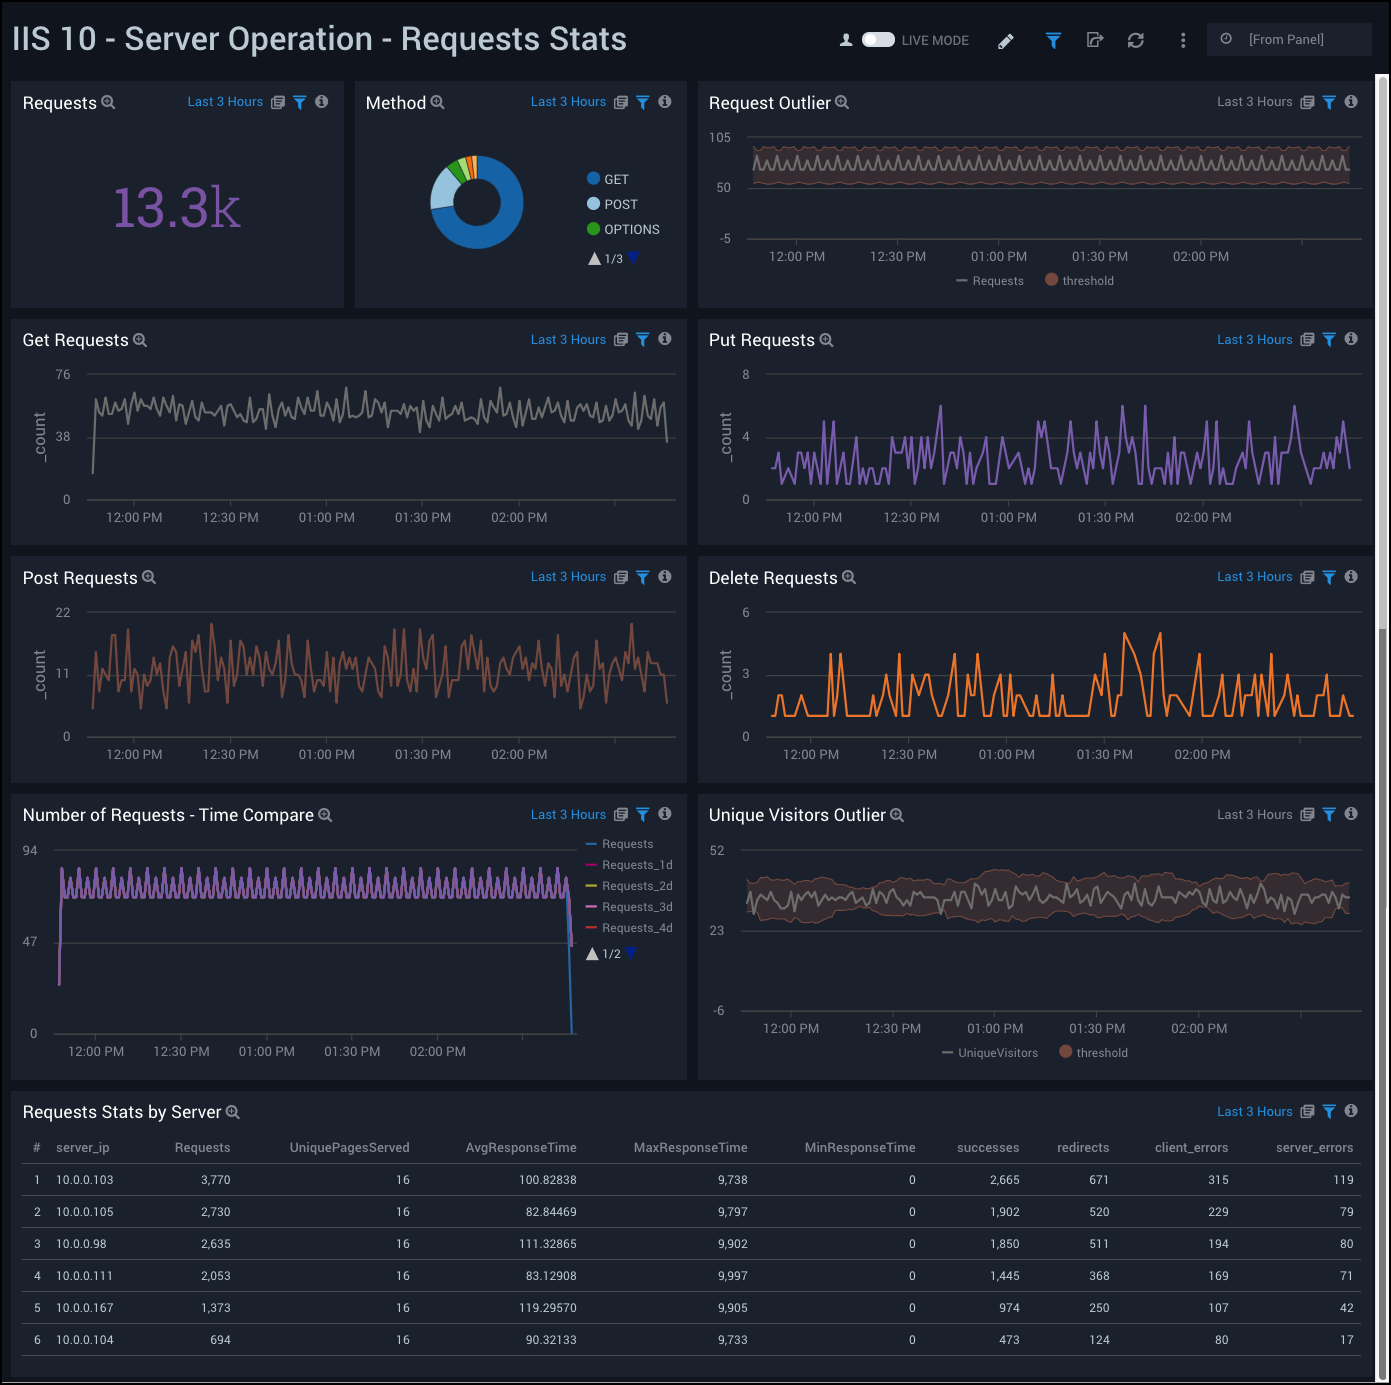
Server Operation - Requests Stats Dashboard
The IIS 10 - Server Operation - Requests Stats Dashboard provides visual graphs and statistics for requests made throughout your IIS infrastructure. Dashboard panels show the number of requests, request methods, request outliers, and requests by server. Panels also show details on GET, PUT, POST, and DELETE requests, as well as requests time compare and unique visitors outlier.
Use this dashboard to:
- Monitor the load on your site for all requests, based on specific type of HTTP request and by server. This information allows you to efficiently allocate resources.
- Identify outliers in requests.
- Analyze request volume trends are against last 7 days to understand business fluctuations.
- Identify how you are acquiring unique users with unique client outliers, and compare with positive and negative outliers.
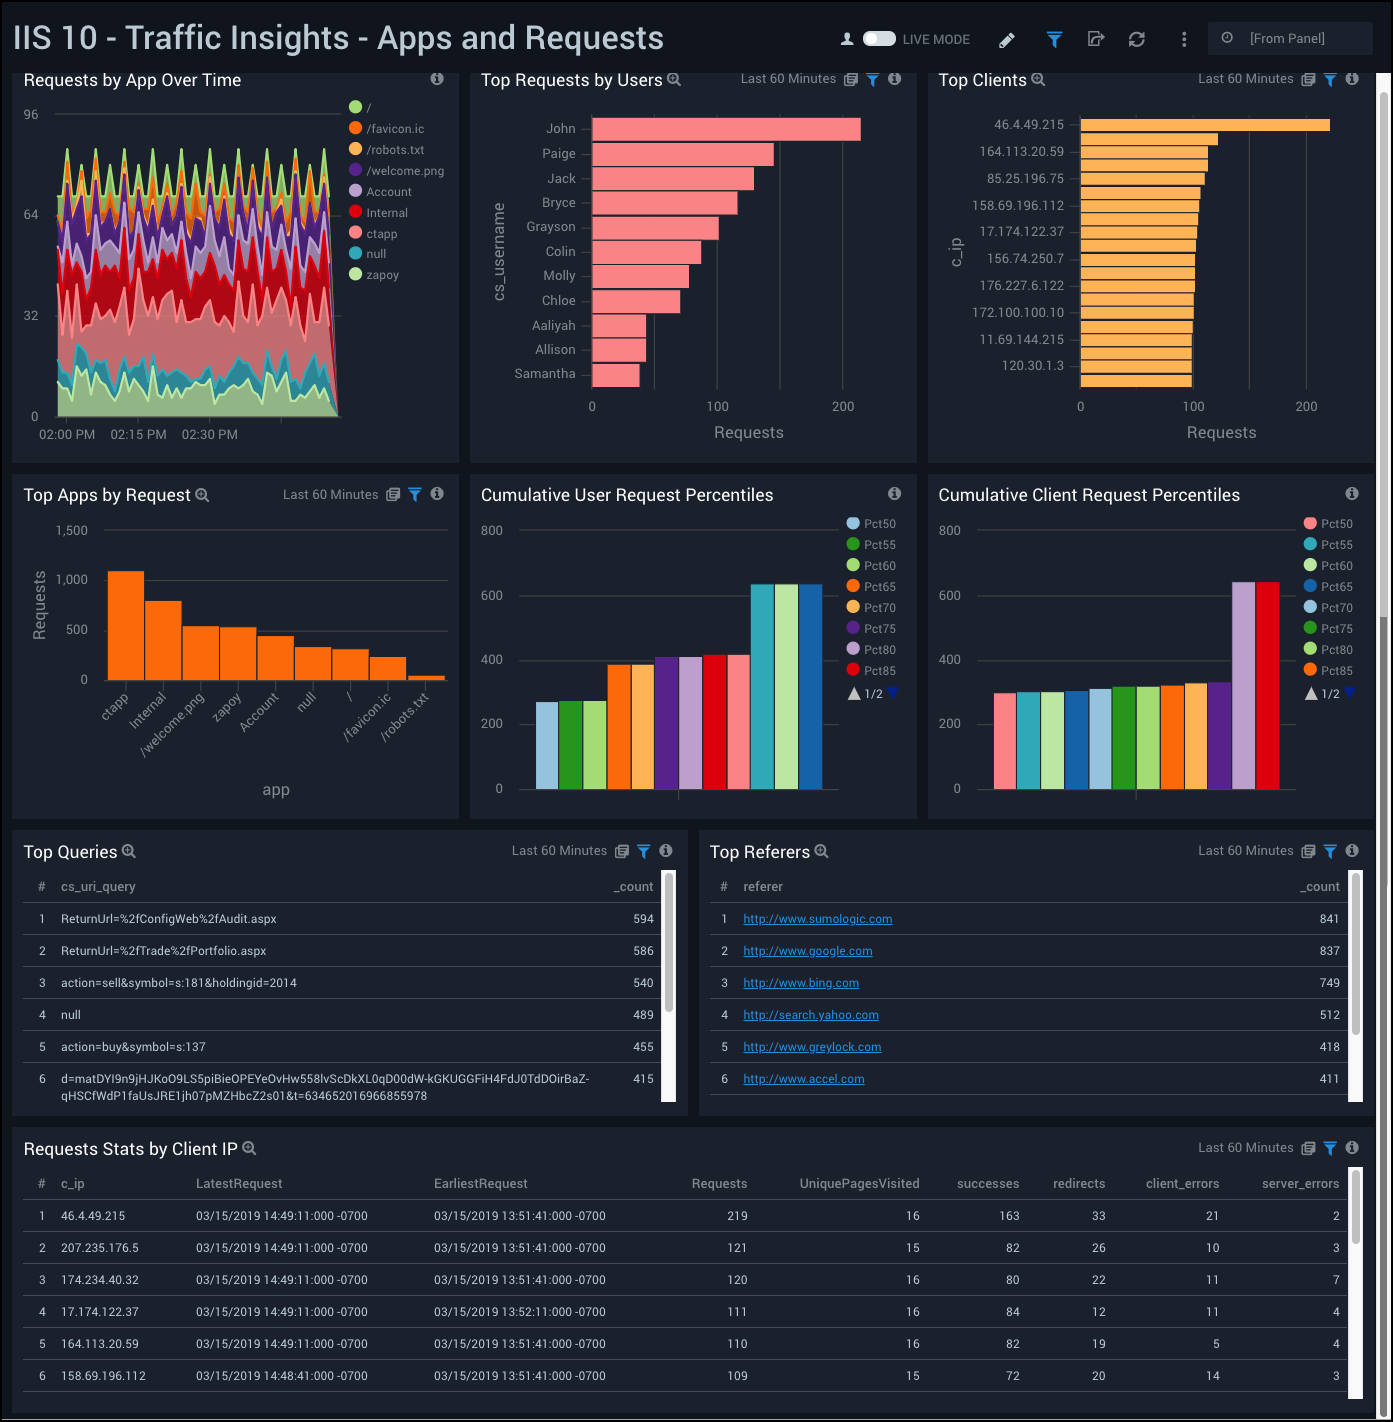
Traffic Insights - Apps and Requests Dashboard
The IIS 10 - Traffic Insights - Apps and Requests Dashboard provides high-level views and details on app requests throughout your IIS network. Dashboard panels show top app requests, app requests over time, top queries, and top referrers. Panels also show top user requests, user request percentiles, top clients, client request percentiles, and client IP stats.
Use this dashboard to:
- Monitor applications configured on a site and the most popular applications used by clients.
- Monitor Referrers of a site to know when to analyze marketing campaigns and advertising strategies.
- Monitor the most active clients with details on total requests, unique pages visited, and HTTP codes.
- Understand client activities and behavior to determine frequency of visits and number of pages visited, to plan strategies.
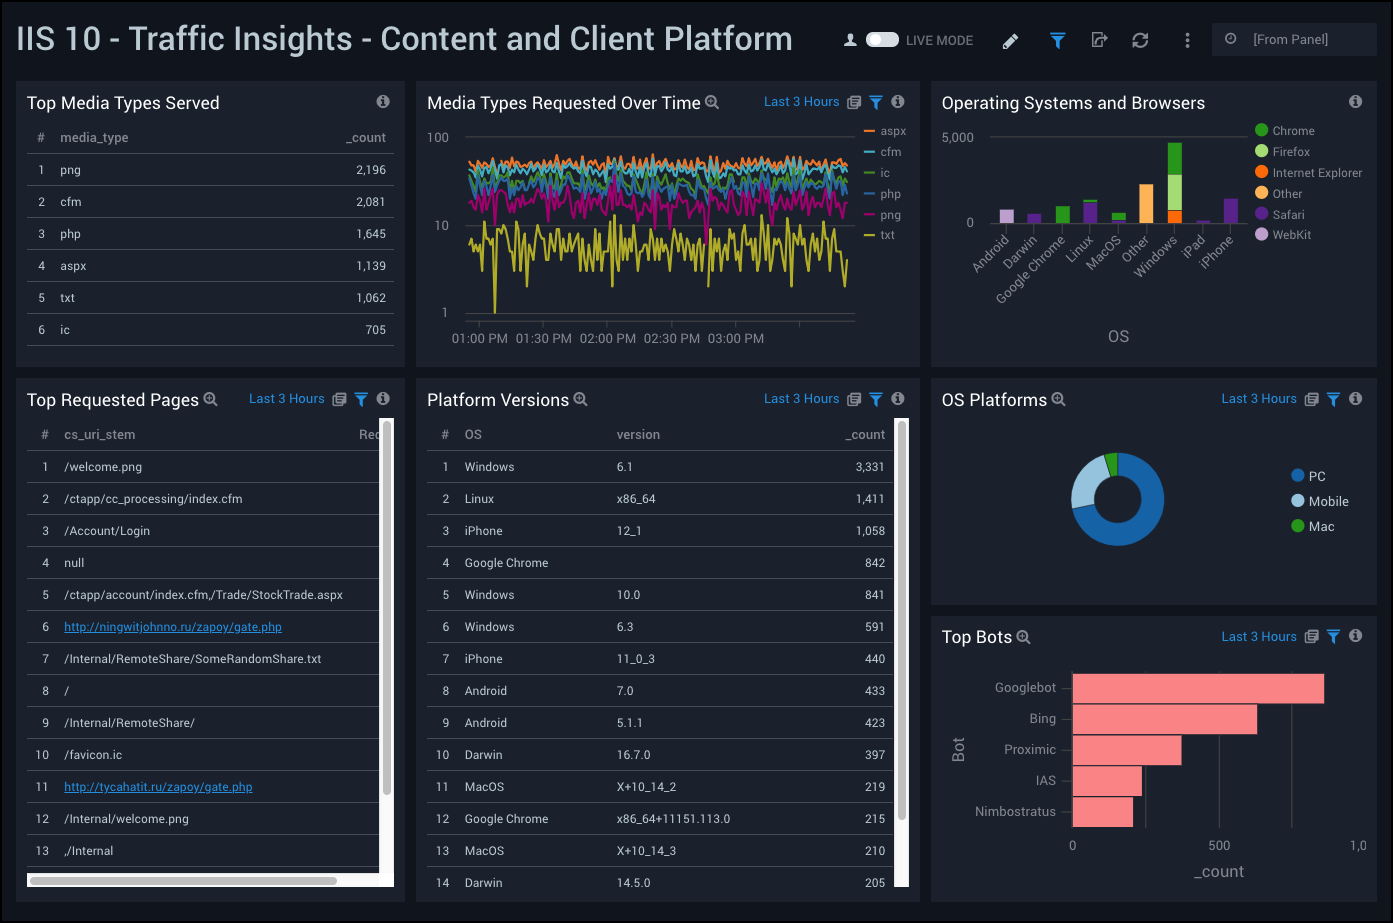
Traffic Insights - Content and Client Platform Dashboard
The IIS 10 - Traffic Insights - Content and Client Platform Dashboard provides detailed information on the platforms available on your IIS network and its media traffic. Dashboard panels show details on operating systems, platform versions, as well as the browsers used on the various operating systems. Panels also show the top media types served, media types requested over time, and the top requested pages.
Use this dashboard to:
- Monitor the location of data with IP addresses to personalize your site and pages personalized for any given location.
- Monitor operating systems (OS), browsers, and bots information available in user agents to analyze marketing campaigns and customer engagement. It also helps you to prioritize where engineering, support, and documentation teams should concentrate their efforts.
- Find out which pages and file types are the most popular for your web site clients.
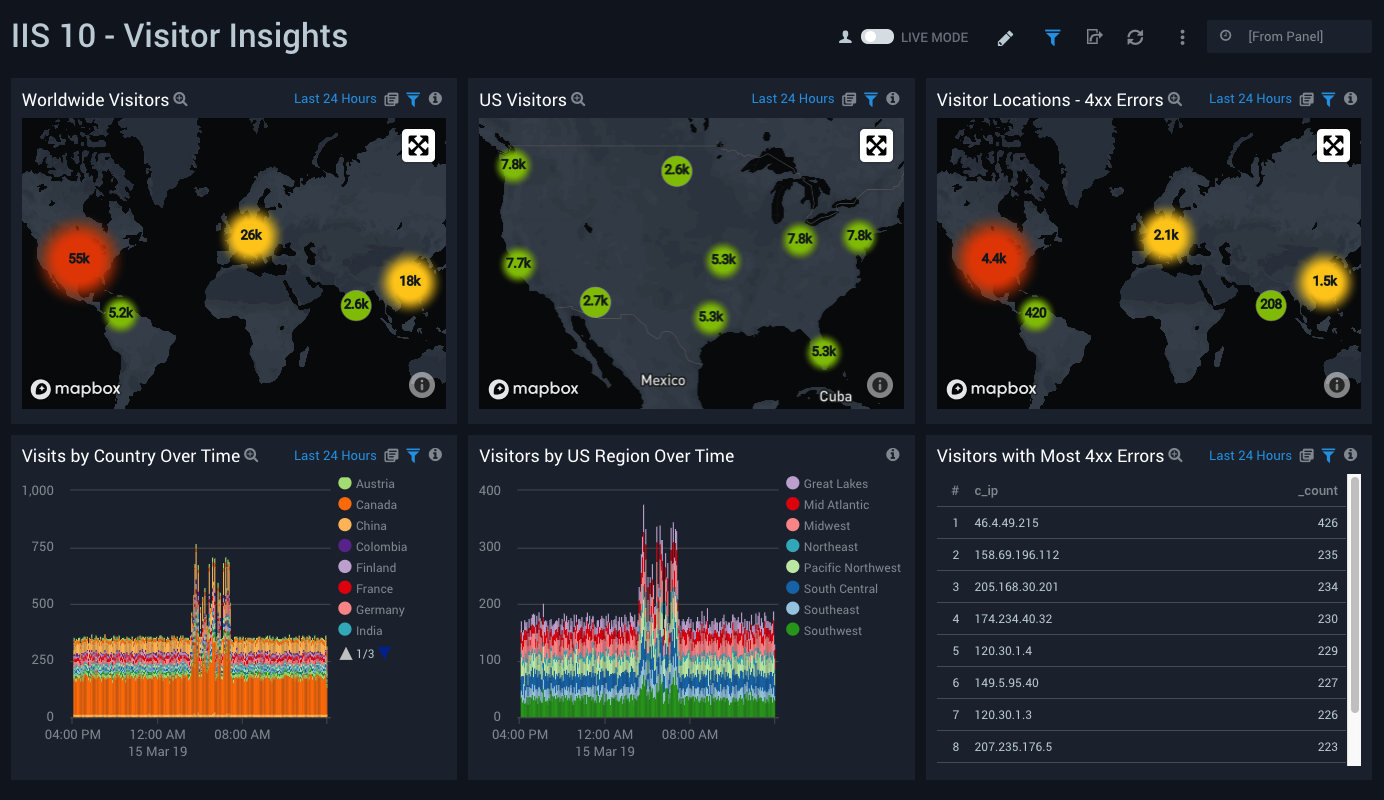
Visitor Insights Dashboard
The IIS 10 - Visitors Insights Dashboard provides at-a-glance details on visitors to your IIS network. Dashboard panels show the geographic distribution of worldwide visitors, United States visitors, visitor locations experiencing the highest number of errors, and the top visitors experiencing errors. Panels also show trends in visitors by country over time and trends in visitors by US region over time.
Use this dashboard to:
- Monitor the client location of visitors ti your site. This helps you to determine if you are getting hits from unexpected locations that should be tracked for security.
- Monitor which clients are experiencing HTTP Client Errors (4XX). 4xx are user errors and should clearly state what the nature of the error and how it can be avoided in the future.