Azure Active Directory

Azure Active Directory is a cloud-based directory and identity management service that provides directory services, application access management, and identity protection. The Sumo Logic App for Azure helps you monitor activity in the Azure Active Directory. The dashboards provide insight into role management, user management, group management, successful and failed sign-in events, directory management, and application management data that helps you understand your users' experience.
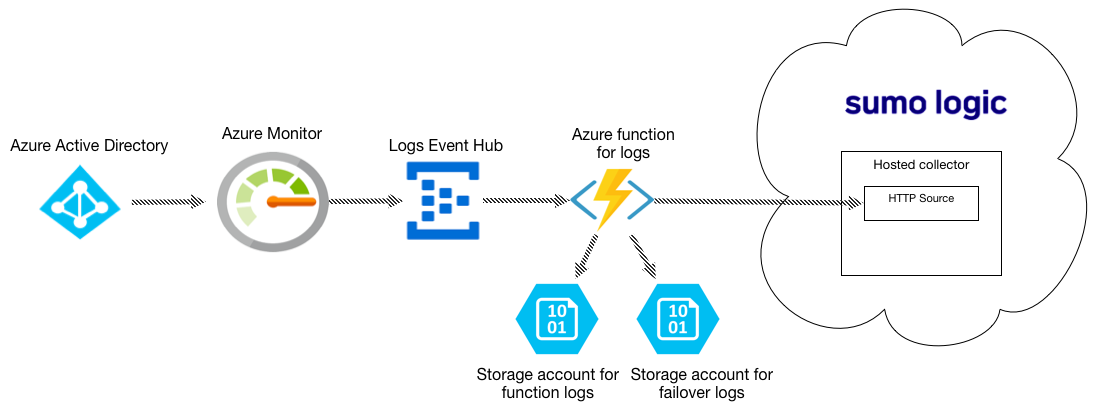
- Azure Monitor collects logs for Azure Active Directory and streams the data to an Azure Event Hub.
- Event Hub streams the logs collected by Azure Monitor to an Azure function.
- The Azure function is a small piece of code that is triggered by Event Hub to send Azure Active Directory logs to the Sumo HTTP Source. The function also logs to one Storage Account and logs failover data to another.
Prerequisites
- An Azure subscription must be associated (attached) to AAD. For more information, see this Azure Active Directory documentation.
- To export Azure Activity logs to reports, be sure you have met the Azure Active Directory requirements.
Log Types
The app uses the following log types:
- Audit and Sign-in logs
Only global administrators, security administrators, security readers, and report readers can view sign-ins and enable collection for Sign-in Events.
Collecting Logs for Azure Active Directory
This section has instructions for setting up the ingestion pipeline from Azure Active Directory to Sumo Logic.
The sections below are either for FedRamp Sumo Logic deployments or if you have been advised by the Sumo Logic support team to not use the Cloud to Cloud Integration based on your Azure environments.
Configure an HTTP Source
In this step, you configure an HTTP Source to receive logs from the Azure function.
- Select a Hosted Collector where you want to configure the HTTP Source. If desired, create a new Hosted Collector, as described on Configure a Hosted Collector.
- Configure an HTTP source, as described on HTTP Logs and Metrics Source.
Configure Azure Resources using ARM template
In this step, you use a Sumo-provided Azure Resource Manager (ARM) template to create an Event Hub, an Azure function and two Storage Accounts. The Azure function is triggered by Event Hub. Two storage accounts are used to store log messages from the Azure function and failover data from Event Hub.
- Download the azuredeploy_logs.json ARM template.
- Go to Template deployment in the Azure Portal.
- Click Create.
- On the Custom deployment blade, click Build your own template in the editor.
- Copy the contents of
azuredeploy_logs.json, and paste it into the editor window. - Click Save.
- Now you are back on the Custom deployment blade.
- Create a new Resource Group (recommended) or select an existing one.
- Choose Location.
- In the Sumo Endpoint URL field, enter the URL of the HTTP Source you configured in Step 1.
- Agree to the terms and conditions.
- Click Purchase.
- Verify the deployment was successful by looking at Notifications at the top right corner of Azure Portal.
- (Optional) In the same window, you can click Go to resource group to verify all resources have been created successfully. You will see something like this:
- Go to Storage accounts and search for “sumofailmsg”. Click on
sumofailmsg_<random-string>. - Under Blob Service, click Containers, then click + Container, enter the Name azureaudit-failover, and select Private for the Public Access Level. Click OK.
Troubleshooting the log collection
If logs are not flowing into Sumo Logic, follow the steps in Troubleshooting log collection in the following document.
Installing the Azure Active Directory App
Now that you have set up collection for the Azure Active Directory, install the Sumo Logic App to use the pre-configured searches and dashboards that provide visibility into your environment for real-time analysis of overall usage.
To install the app:
Locate and install the app you need from the App Catalog. If you want to see a preview of the dashboards included with the app before installing, click Preview Dashboards.
- From the App Catalog, search for and select the app.
- Select the version of the service you're using and click Add to Library. Version selection is applicable only to a few apps currently. For more information, see Installing the Apps from the Library.
- To install the app, complete the following fields.
- App Name. You can retain the existing name, or enter a name of your choice for the app.
- Data Source. Select either of these options for the data source.
- Choose Source Category, and select a source category from the list.
- Choose Enter a Custom Data Filter, and enter a custom source category beginning with an underscore. Example: (
_sourceCategory=MyCategory).
- Advanced. Select the Location in Library (the default is the Personal folder in the library), or click New Folder to add a new folder.
- Click Add to Library.
Once an app is installed, it will appear in your Personal folder, or other folder that you specified. From here, you can share it with your organization.
Panels will start to fill automatically. It's important to note that each panel slowly fills with data matching the time range query and received since the panel was created. Results won't immediately be available, but with a bit of time, you'll see full graphs and maps.
Viewing Azure Active Directory Dashboards
Overview
See an overview of Azure Active Directory activity, including operation names, audit event categories, log levels, and result types.
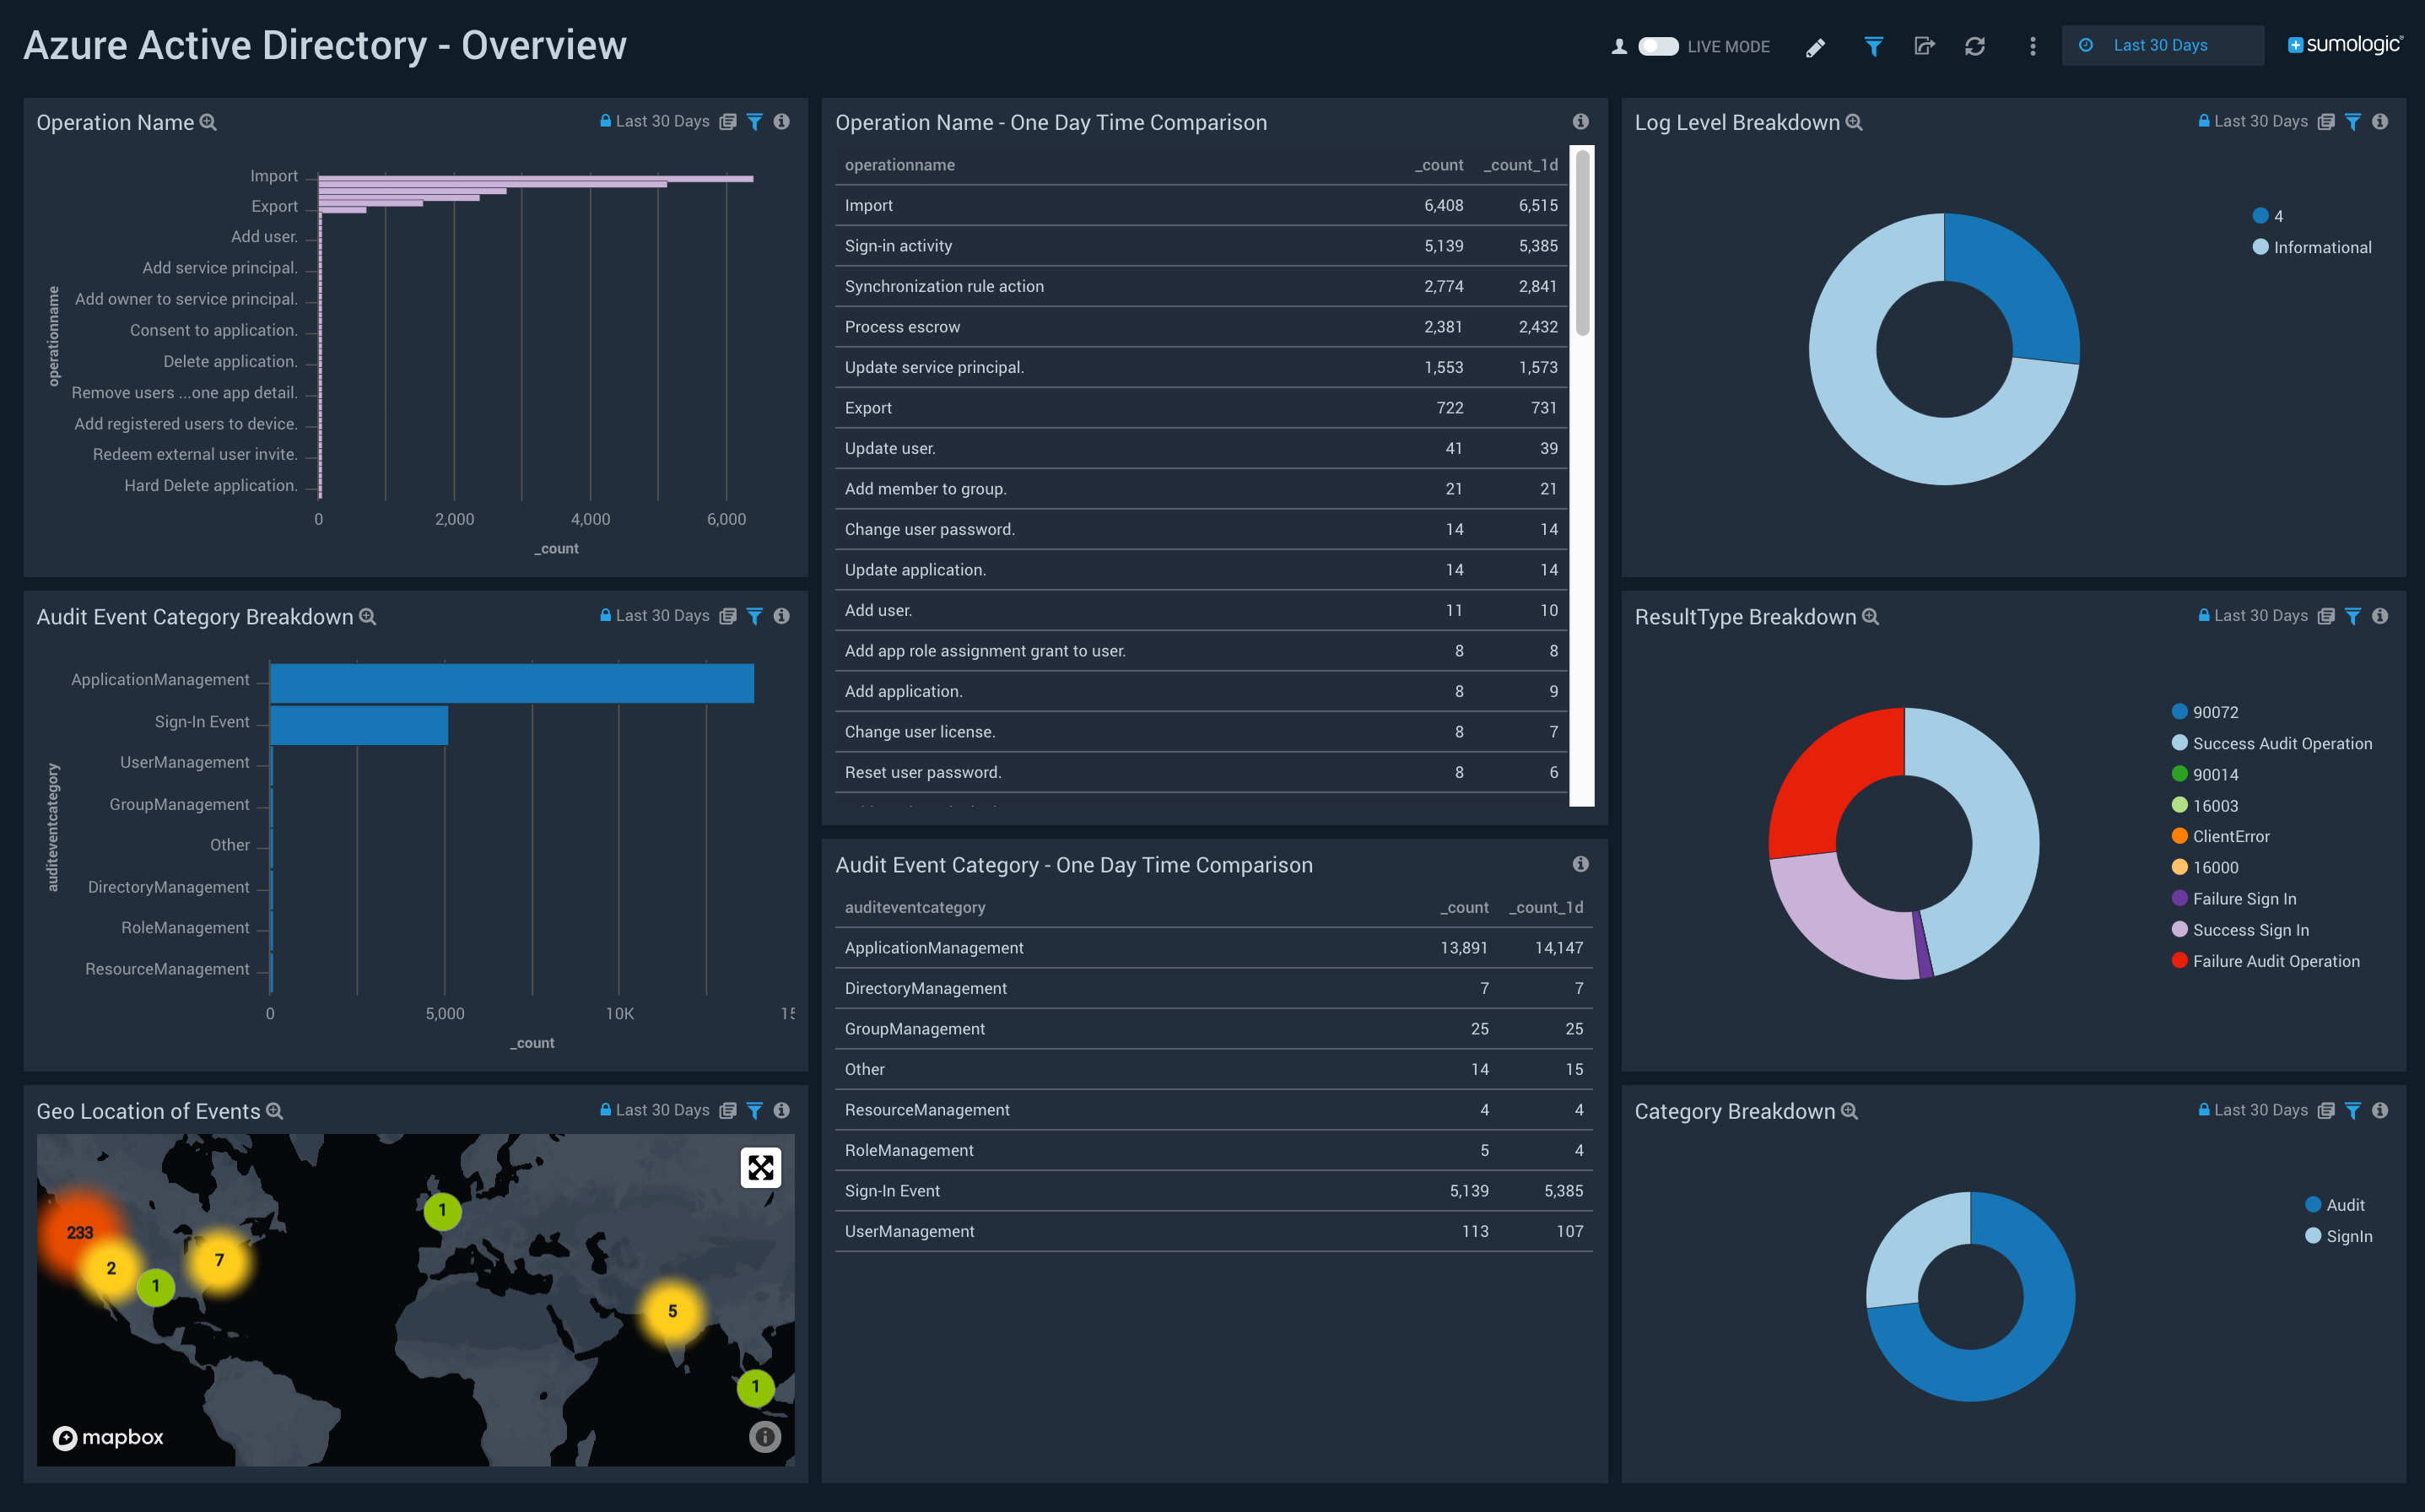
Operation Name. Shows the name of operations, and a count of how many times they happened on a bar chart, for the last 24 hours.
Operation Name - One Day Time Comparison. Shows an aggregation table with the names of operations that have happened in the last 24 hours along with a count, and compares it to the count of operations from one day before.
Log Level Breakdown. Shows a breakdown of the level of logs on a pie chart for the last 24 hours.
Audit Event Category Breakdown. Shows a breakdown of the category of audit events along with a count on a bar chart for the last 24 hours.
Audit Event Category - One Day Time Comparison. Shows an aggregation table with the categories of audit events in the last 24 hours along with a count, and compares it to the count of categories from one day before.
ResultType Breakdown. Shows a breakdown of the types of results (success or failure) on a pie chart, for the last 24 hours.
Geo Location of Events. Performs a geo lookup query and displays the location and number of events on a map of the world for the last 24 hours.
Category Breakdown. Shows a breakdown of the categories on a pie chart for the last 24 hours.
Role Management
See information about role management in Azure Activity Directory, including role updates, successful events, and users added or removed from roles.
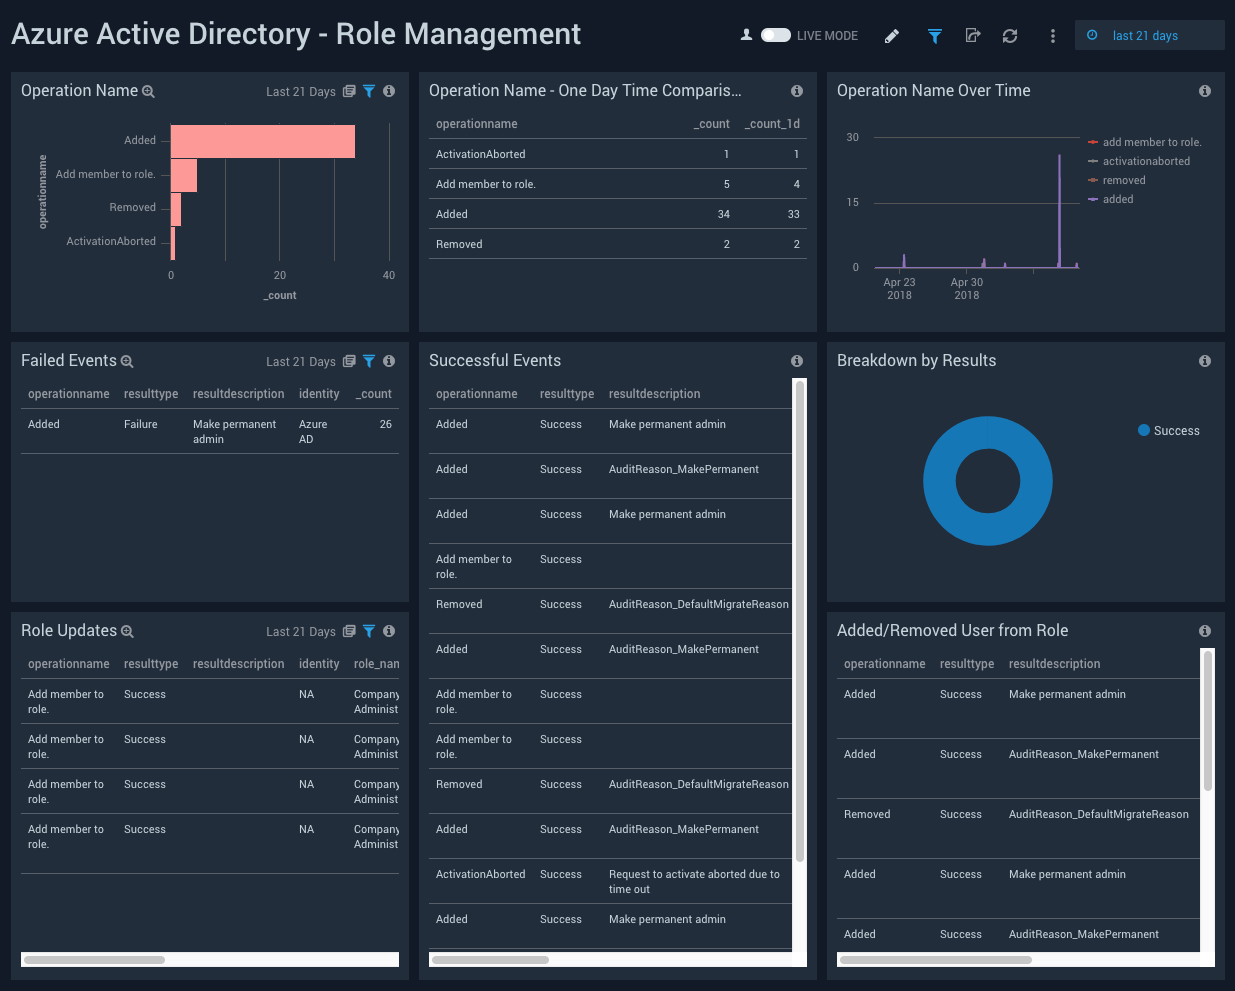
Operation Name. Shows the name of role management operations, and a count of how many times they happened on a bar chart, for the last 24 hours.
Operation Name - One Day Time Comparison. Shows an aggregation table with the names of role management operations that have happened in the last 24 hours along with a count, and compares it to the count of operations from one day before.
Operation Name Over Time. Shows a count of role management operations along with the name on a line chart for the last 24 hours.
Failed Events. Shows an aggregation table of failed events with columns for the operation names, result types, result description identity, and count for the last 24 hours.
Successful Events. Shows an aggregation table of successful events with columns for the operation names, result types, result description identity, target name, and target source name for the last 24 hours.
Breakdown by Results. Shows a breakdown of the types of results (success or failure) on a pie chart, for the last 24 hours.
Role Updates. Shows an aggregation table of role updates with columns for the operation names, result types, result description identity, role name, target source name, and count for the last 24 hours.
Added/Removed User from Role. Shows an aggregation table of users added or removed from a role with columns for the operation names, result types, result description identity, user name, and target source name for the last 24 hours.
User Management
See information about user management in Azure Activity Directory, including external user invites, updated and deleted users, users added and outliers in user management events.
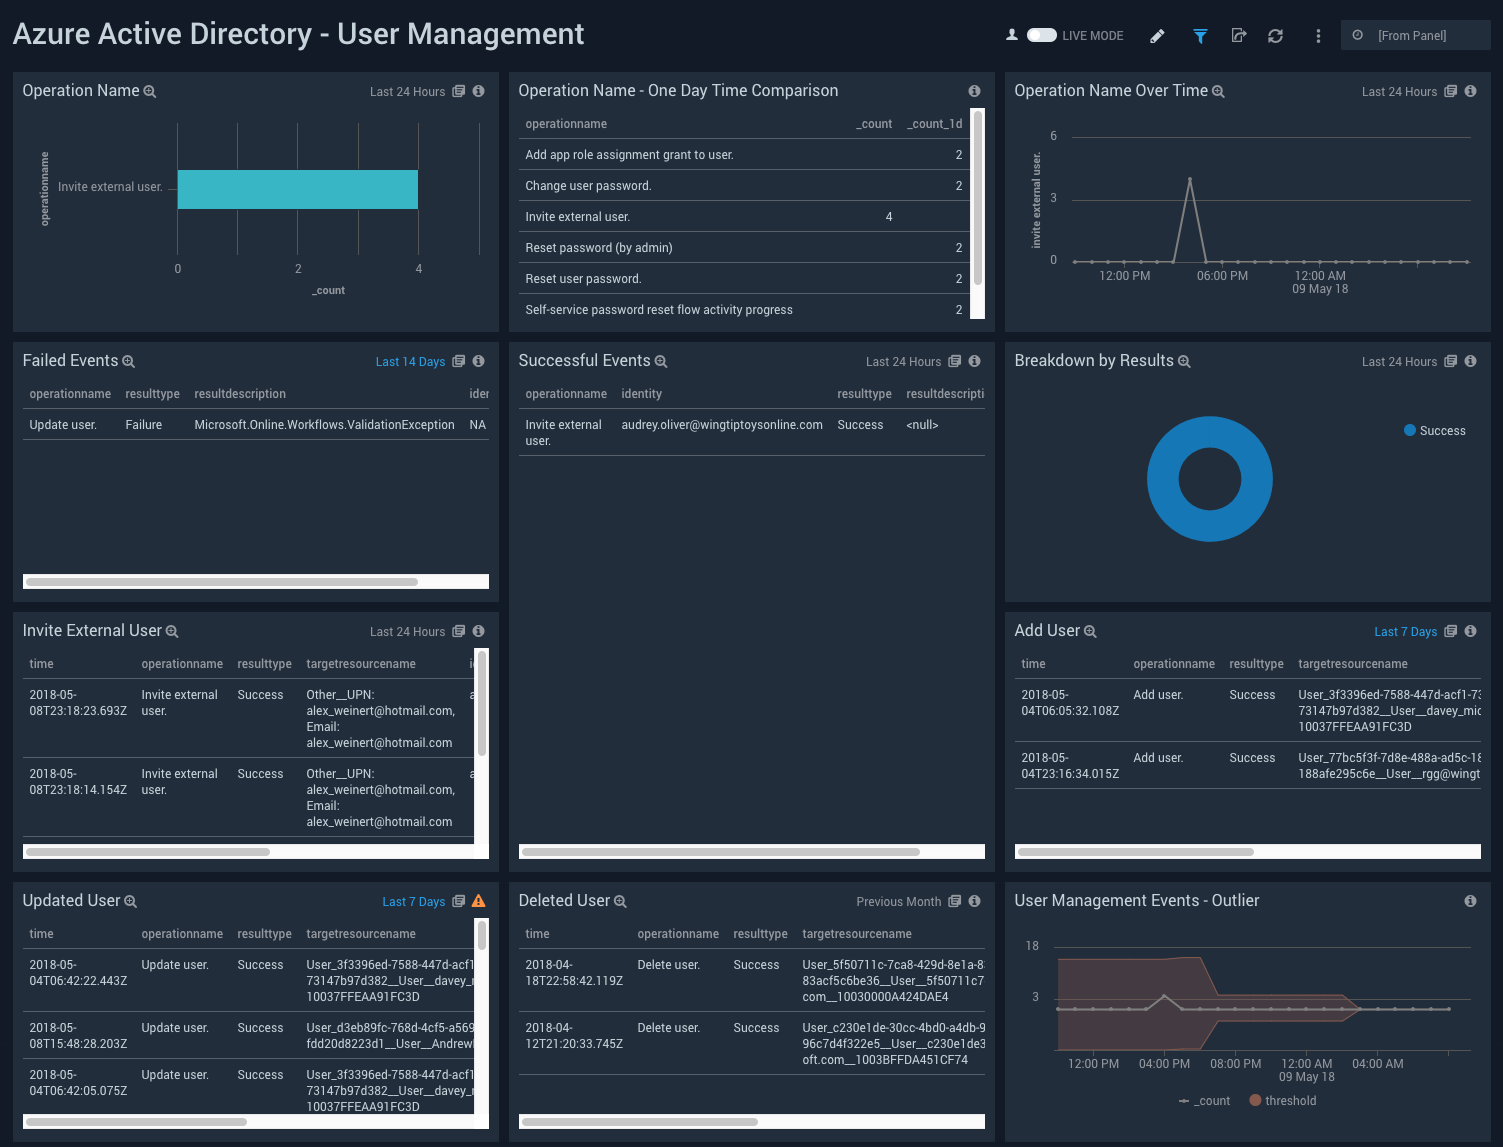
Operation Name. Shows the name of user management operations, and a count of how many times they happened on a bar chart, for the last 24 hours.
Operation Name - One Day Time Comparison. Shows an aggregation table with the names of user management operations that have happened in the last 24 hours along with a count, and compares it to the count of operations from one day before.
Operation Name Over Time. Shows a count of user management operations along with the name on a line chart for the last 24 hours.
Failed Events. Shows an aggregation table of failed events with columns for the operation names, result types, result descriptions, identity, and count for the last 24 hours.
Successful Events. Shows an aggregation table of successful events with columns for the operation names, identity, result types, and count for the last 24 hours.
Breakdown by Results. Shows a breakdown of the types of results (success or failure) on a pie chart, for the last 24 hours.
Invite External User. Shows an aggregation table of successful events with columns for the time, operation names, result types, target source name, identity, result description, and count for the last 24 hours.
Add User. Shows an aggregation table of added users with columns for the time, operation names, result types, target source name, identity, and count for the last 24 hours.
Updated User. Shows an aggregation table of updated users with columns for the time, operation names, result types, target source name, identity, and count for the last 24 hours.
Deleted User. Shows an aggregation table of deleted users with columns for the time, operation names, result types, target source name, identity, and count for the last 24 hours.
User Management Events - Outlier. Shows outliers in user management events with count and thresholds on a line chart, for the last 24 hours.
Application Management
See information about application management in Azure Activity Directory, including application consent, deleted applications, applications added or updated, and service principal updates.
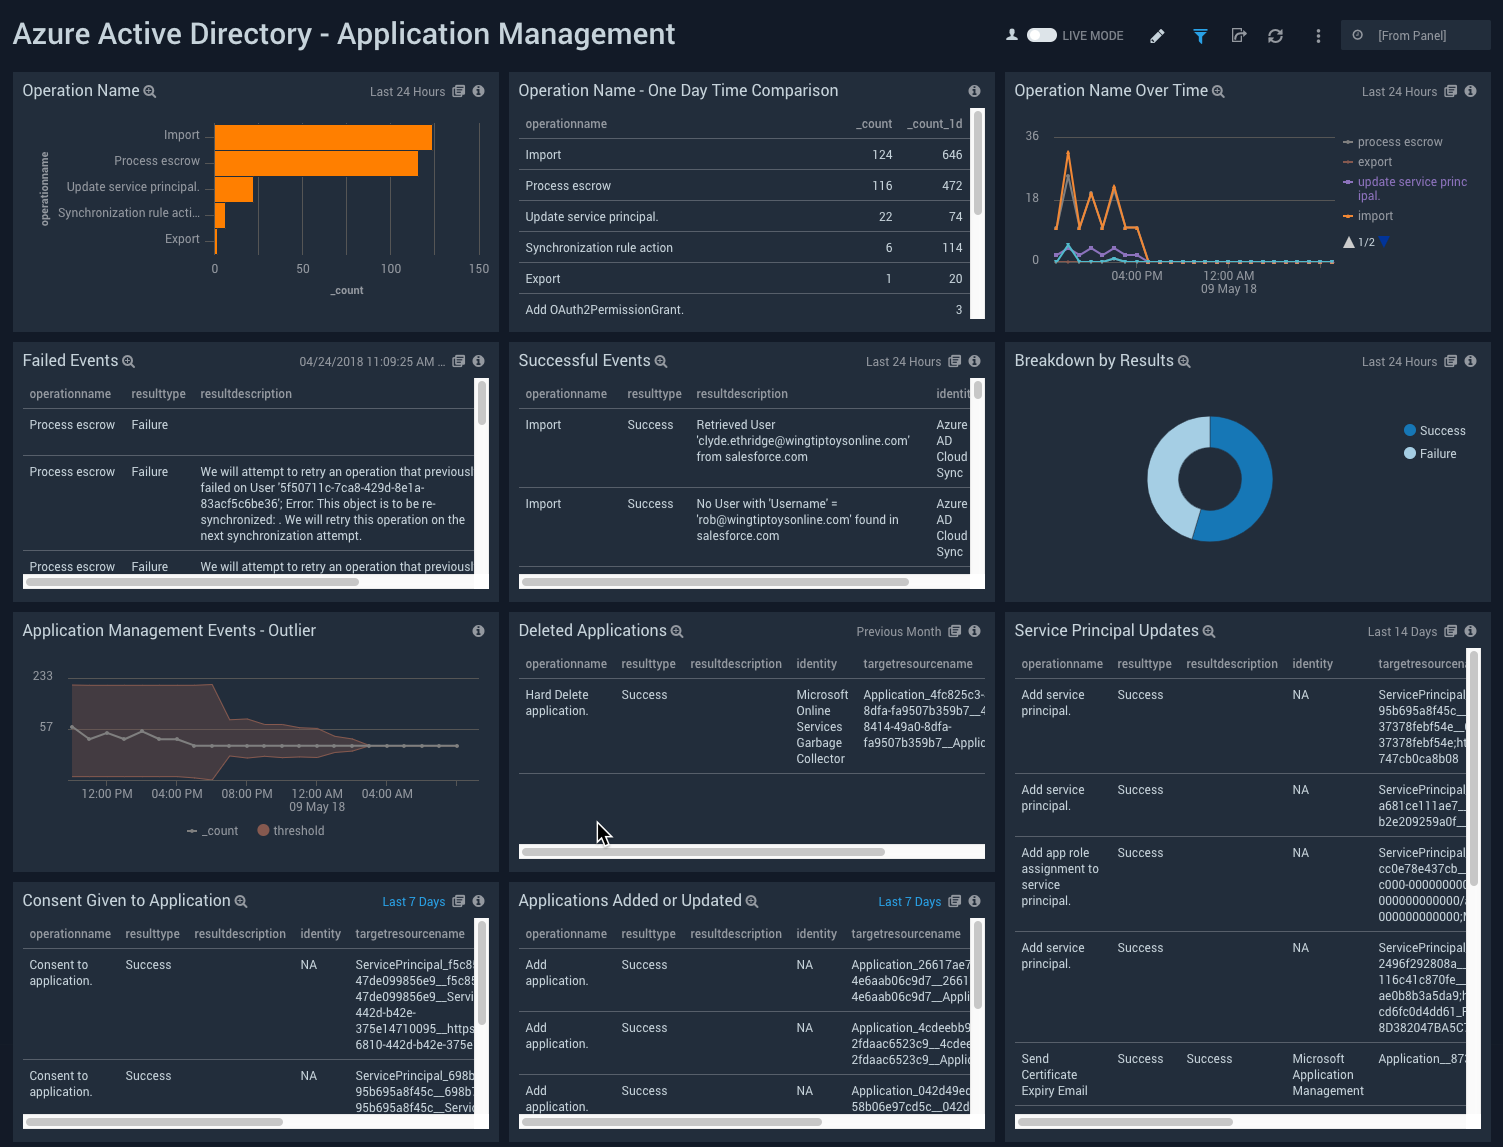
Operation Name. Shows the name of application management operations, and a count of how many times they happened on a bar chart, for the last 24 hours.
Operation Name - One Day Time Comparison. Shows an aggregation table with the names of application management operations that have happened in the last 24 hours along with a count, and compares it to the count of operations from one day before.
Operation Name Over Time. Shows a count of application management operations along with the name on a line chart for the last 24 hours.
Failed Events. Shows an aggregation table of failed events with columns for the operation names, result types, result descriptions, identity, and count for the last 24 hours.
Successful Events. Shows an aggregation table of successful events with columns for the operation names, result types, result descriptions, identity, and count for the last 24 hours.
Breakdown by Results. Shows a breakdown of the types of results (success or failure) on a pie chart, for the last 24 hours.
Application Management Events - Outlier. Shows outliers in application management events with count and thresholds on a line chart, for the last 24 hours.
Deleted Applications. Shows an aggregation table of deleted applications with columns for the operation names, result types, result descriptions, identity, target source name, and count for the last 24 hours.
Service Principal Updates. Shows an aggregation table of service principal updates with columns for the operation names, result types, result descriptions, identity, target source name, and count for the last 24 hours.
Consent Given to Application. Shows an aggregation table of consent given to applications with columns for the operation names,result types, result descriptions, identity, target source name, and count for the last 24 hours.
Applications Added or Updated. Shows an aggregation table of applications added or updated with columns for the operation names, result types, result descriptions, identity, target source name, and count for the last 24 hours.
Directory Management
See information about directory management in Azure Activity Directory, including failed events, successful events, and disables desktop SSOs.
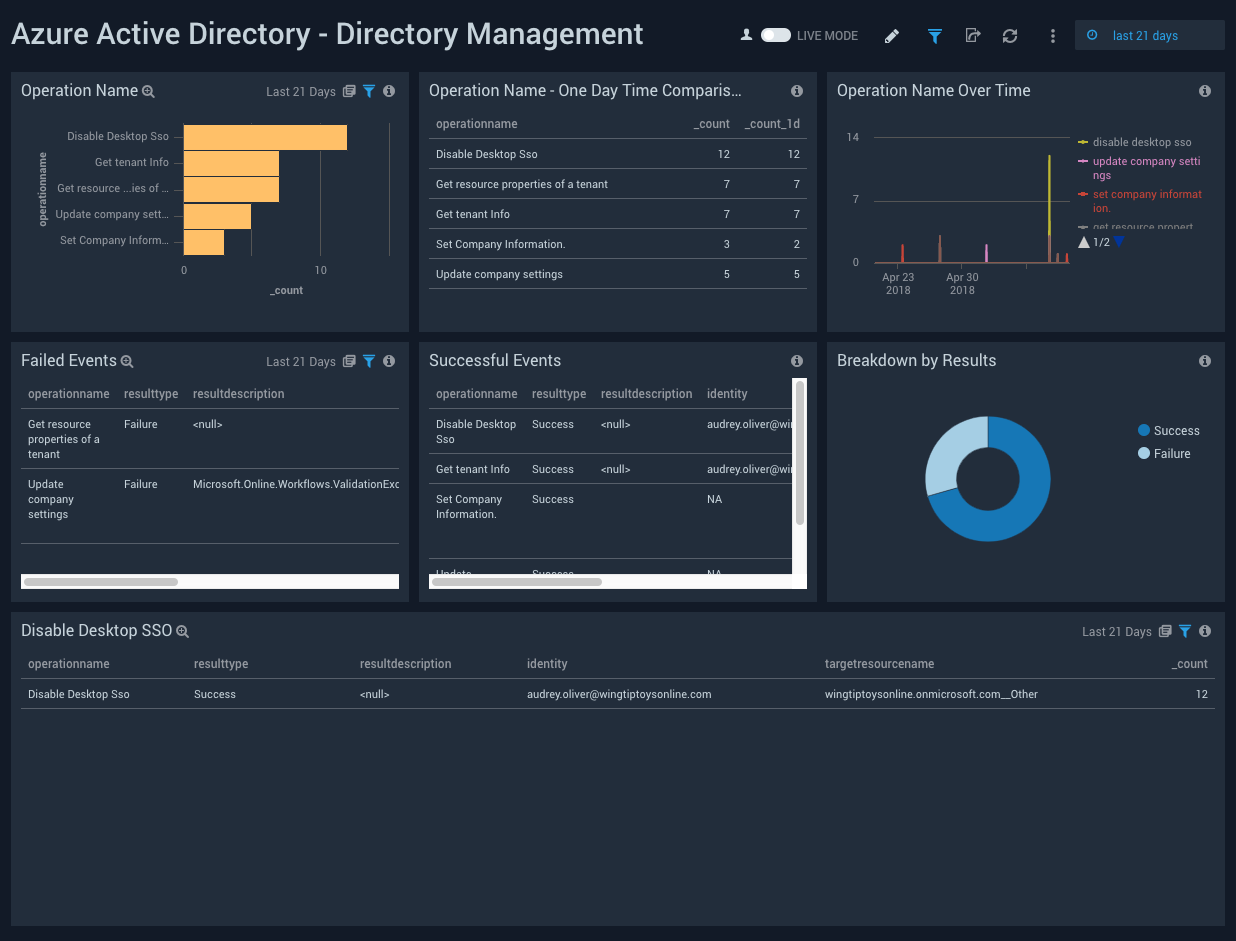
Operation Name. Shows the name of directory management operations, and a count of how many times they happened on a bar chart, for the last 24 hours.
Operation Name - One Day Time Comparison. Shows an aggregation table with the names of directory management operations that have happened in the last 24 hours along with a count, and compares it to the count of operations from one day before.
Operation Name Over Time. Shows a count of directory management operations along with the name on a line chart for the last 24 hours.
Failed Events. Shows an aggregation table of failed events with columns for the operation names, result types, result descriptions, identity, and count for the last 24 hours.
Successful Events. Shows an aggregation table of successful events with columns for the operation names, result types, result descriptions, identity, and count for the last 24 hours.
Breakdown by Results. Shows a breakdown of the types of results (success or failure) on a pie chart, for the last 24 hours.
Disable Desktop SSO. Shows an aggregation table of disabled desktop SSOs with columns for the operation names, result types, result descriptions, identity, target source name, and count for the last 24 hours.
Group Management
See information about group management in Azure Activity Directory, including groups added, and a list of members added or removed from groups.
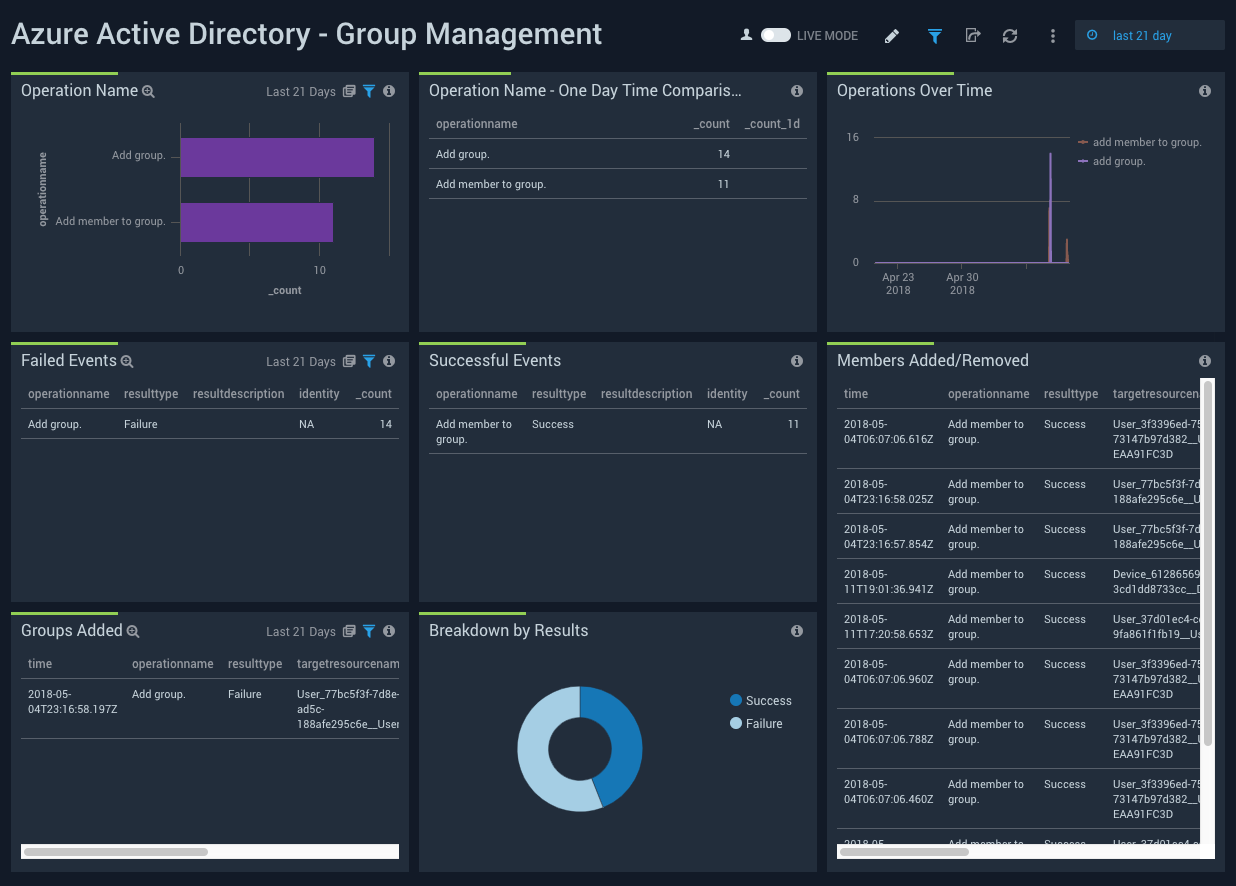
Operation Name. Shows the name of group management operations, and a count of how many times they happened on a bar chart, for the last 24 hours.
Operation Name - One Day Time Comparison. Shows an aggregation table with the names of group management operations that have happened in the last 24 hours along with a count, and compares it to the count of operations from one day before.
Operations Over Time. Shows a count of group management operations along with the name on a line chart for the last 24 hours.
Failed Events. Shows an aggregation table of failed events with columns for the operation names, result types, result descriptions, identity, and count for the last 24 hours.
Successful Events. Shows an aggregation table of successful events with columns for the operation names, result types, result descriptions, identity, and count for the last 24 hours.
Members Added/Removed. Shows an aggregation table of successful events with columns for the time, operation names, result types, target source name, identity, display name, and count for the last 24 hours.
Groups Added. Shows an aggregation table of groups added with columns for the time, operation names, result types, target source name, identity, and count for the last 24 hours.
Breakdown by Results. Shows a breakdown of the types of results (success or failure) on a pie chart, for the last 24 hours.
Authorization/Authentication/Other
See information about Authorization in Azure Active Directory including the name of authorization operations done, successful and failed authorization events, and breakdown of results.
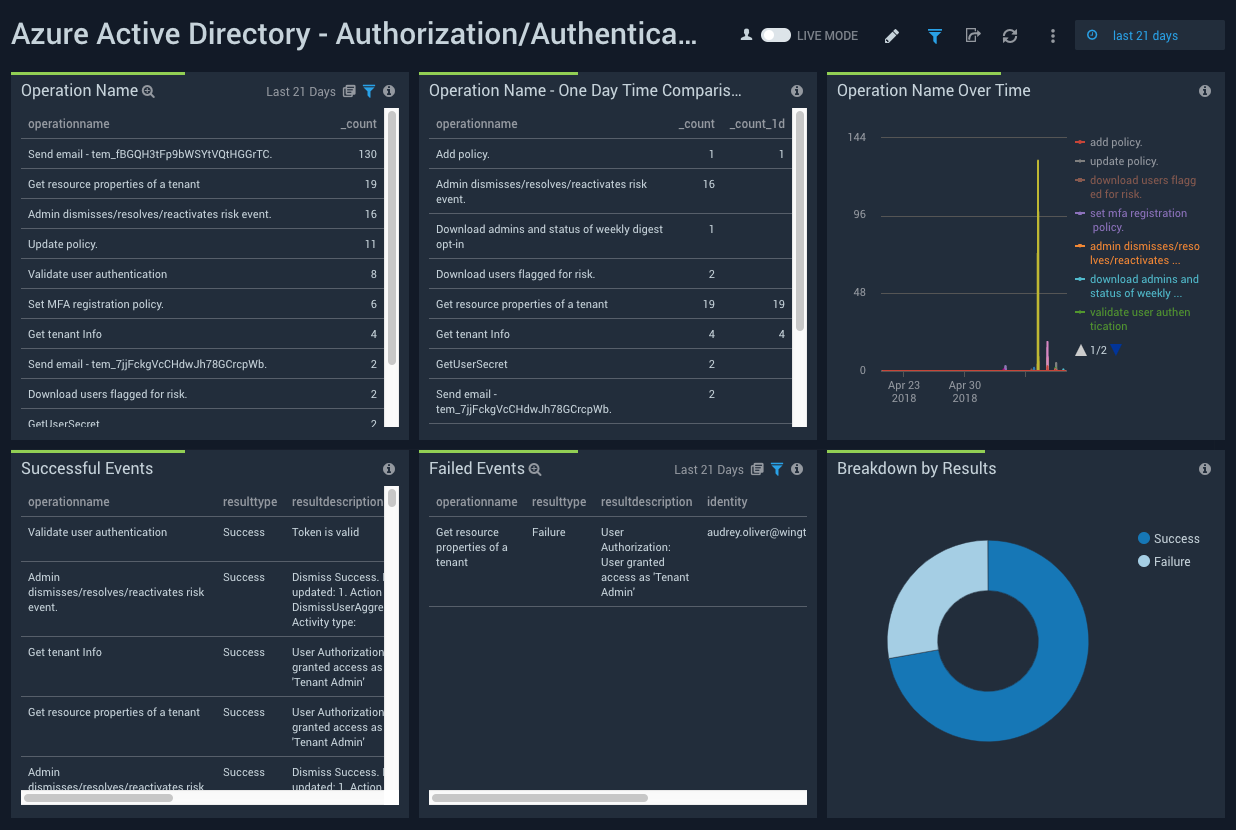
Operation Name. Shows the name of authorizations or authentication, and a count of how many times they happened on a bar chart, for the last 24 hours.
Operation Name - One Day Time Comparison. Shows an aggregation table with the names of authorizations or authentication that have happened in the last 24 hours along with a count, and compares it to the count of operations from one day before.
Operations Over Time. Shows a count of authorizations or authentication along with the name on a line chart for the last 24 hours.
Successful Events. Shows an aggregation table of successful events with columns for the operation names, result types, result descriptions, target source name, identity, and count for the last 24 hours.
Failed Events. Shows an aggregation table of failed events with columns for the operation names, result types, result descriptions, identity, target source name, and count for the last 24 hours.
Breakdown by Results. Shows a breakdown of the types of results (success or failure) on a pie chart, for the last 24 hours.
Successful Sign-In Events
See information about successful sign-in events in your Azure AD, including the geo-location of sign-in activity, risky sign-ins, breakdown by browser & application, and any anomalies in the login count.
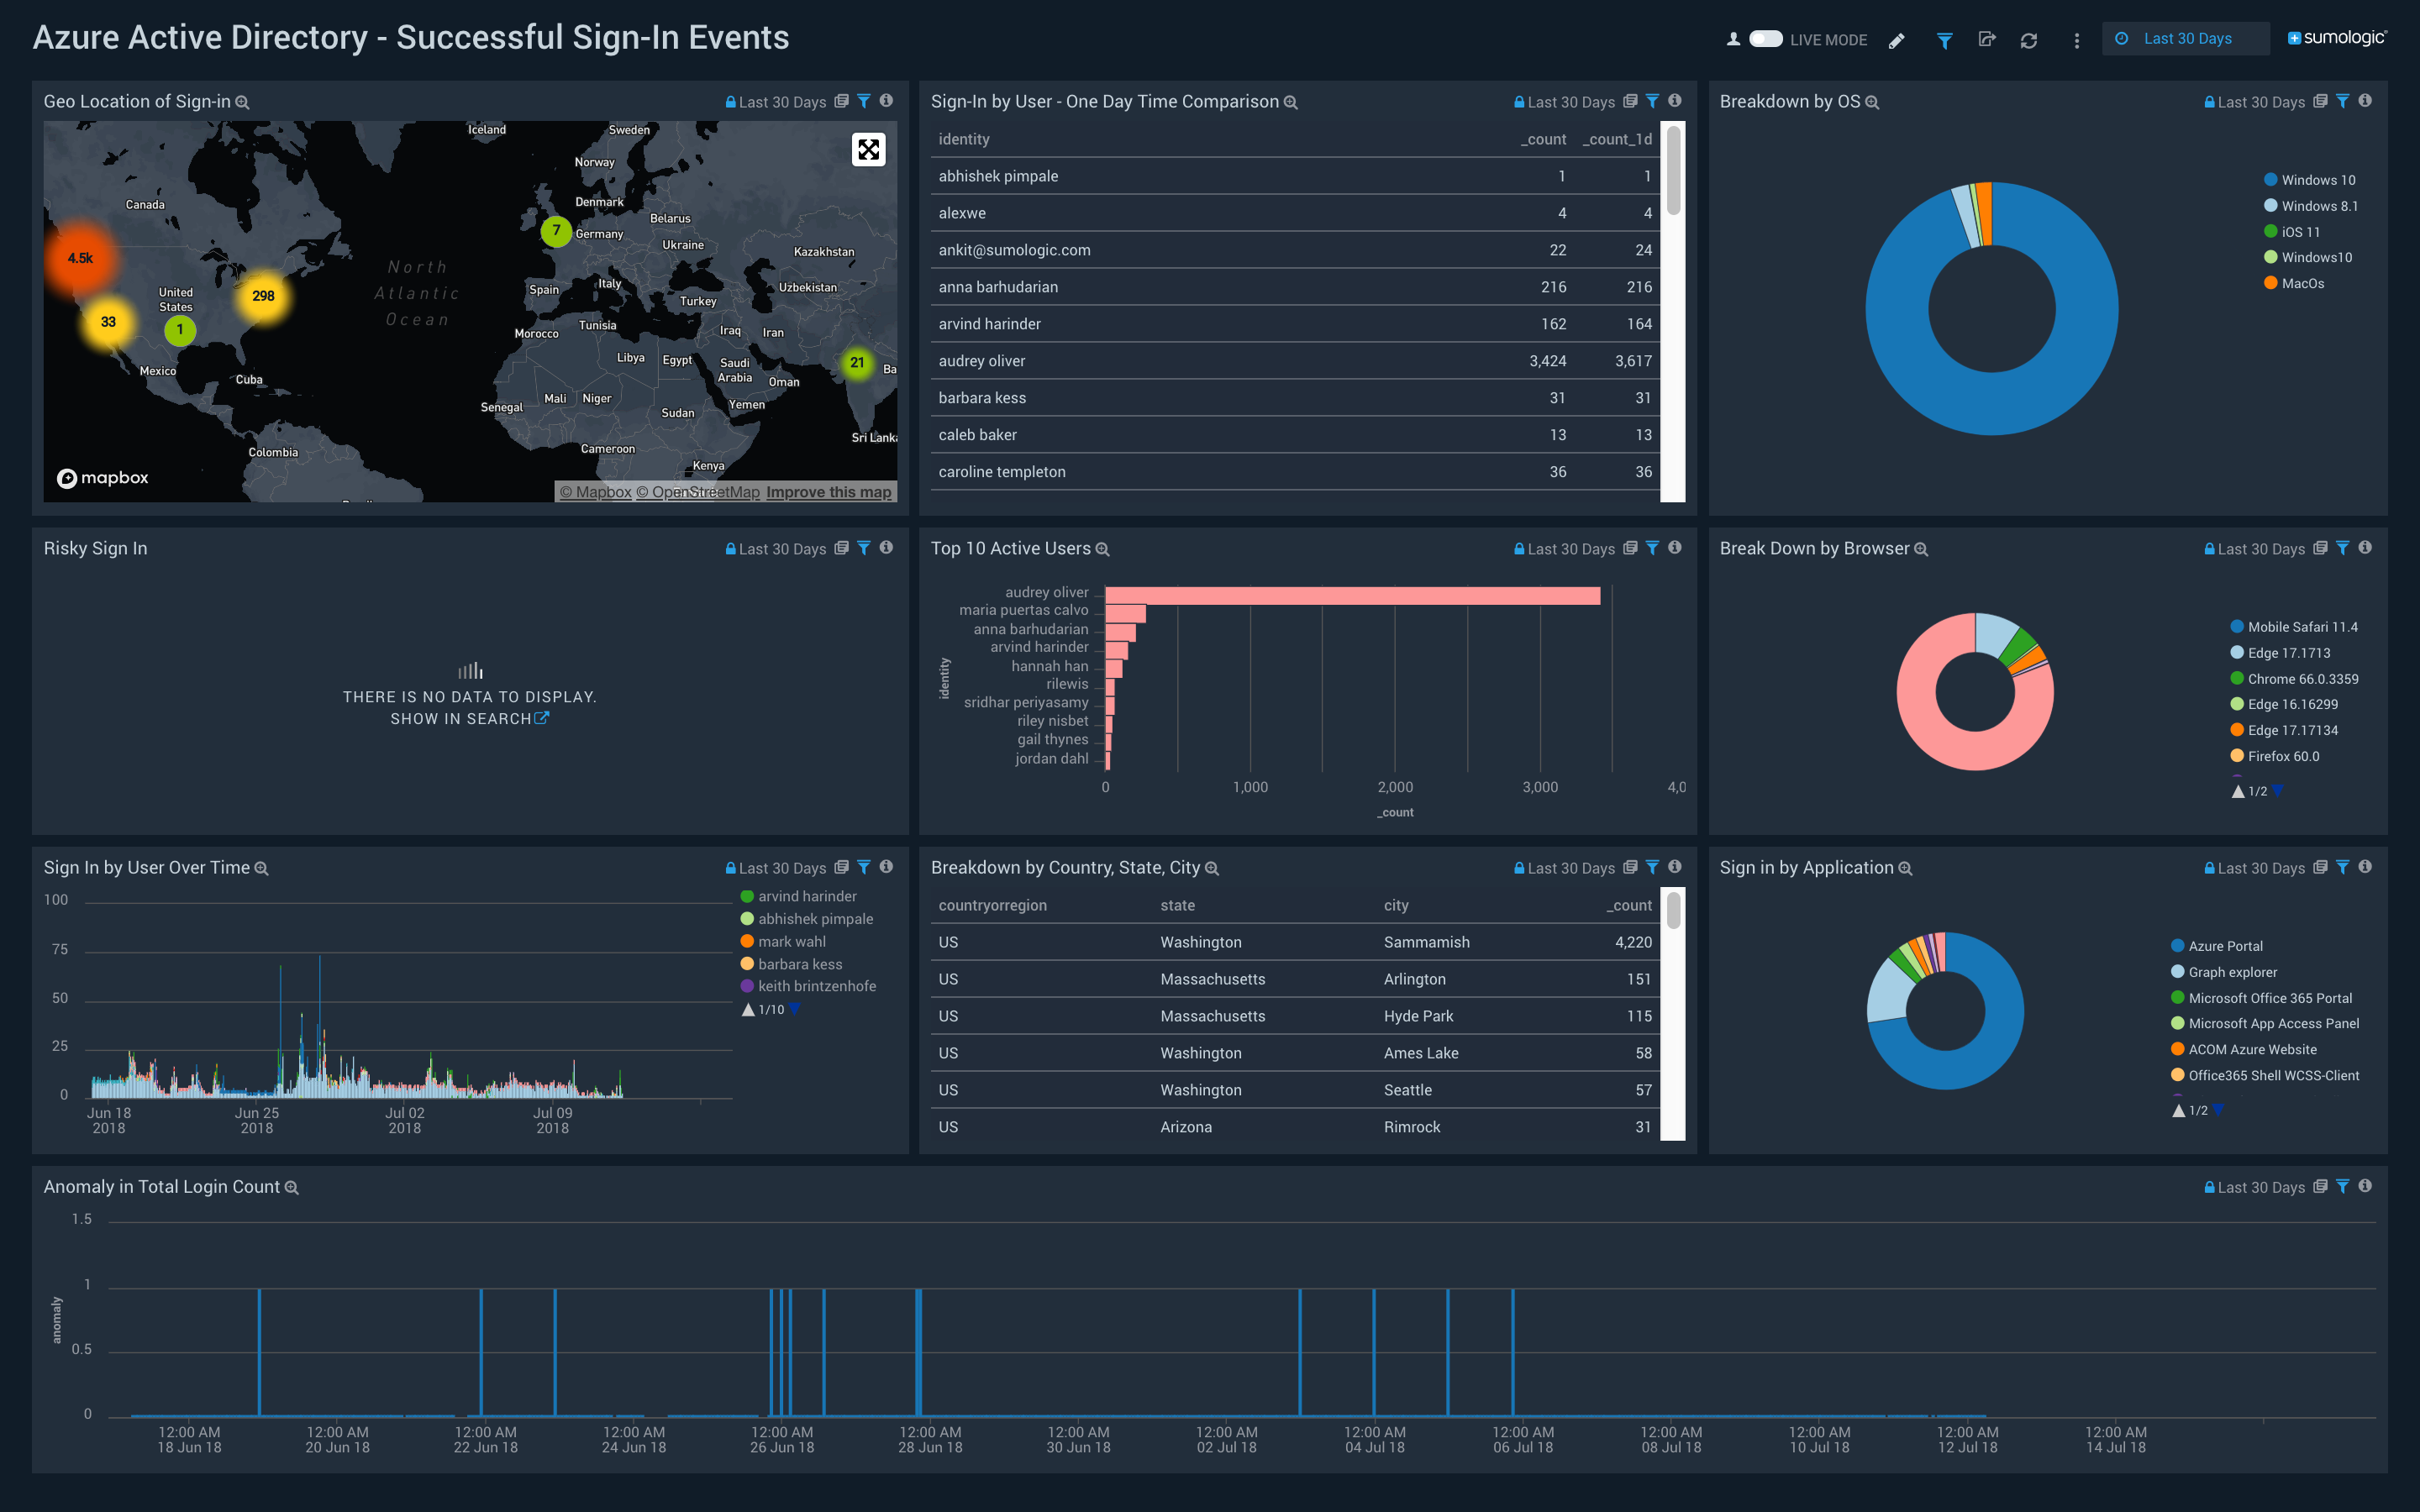
Geo Location of Sign-in. Performs a geo lookup query and displays the location and number of successful sign-in events on a map of the world for the last 24 hours.
Sign-In by User - One Day Time Comparison. Shows an aggregation table with the names of users with successful sign-in events in the last 24 hours along with a count, and compares it to the count of operations from one day before.
Breakdown by OS. Shows breakdown of the operating system that is the source of sign-in events.
Risky Sign In. Shows risky successful sign-in events.
Top 10 Active Users. Shows top 10 active users with successful sign-ins.
Break Down by Browser. Shows breakdown of the browser that is the source of sign-in events.
Sign In by User Over Time. Shows trend of successful sign-in events over time.
Breakdown by Country, State, City. Shows breakdown by country, state, and city.
Sign in by Application. Shows successful sign-in events by Application.
Anomaly in Total Login Count. Shows any Anomaly in the total successful login count over 7 days.
Failure Sign-in Events
See information about failure sign-in events in your Azure AD, including the geo-location of sign-in activity, risky sign-ins, breakdown by browser & application, and any anomalies in the login count.
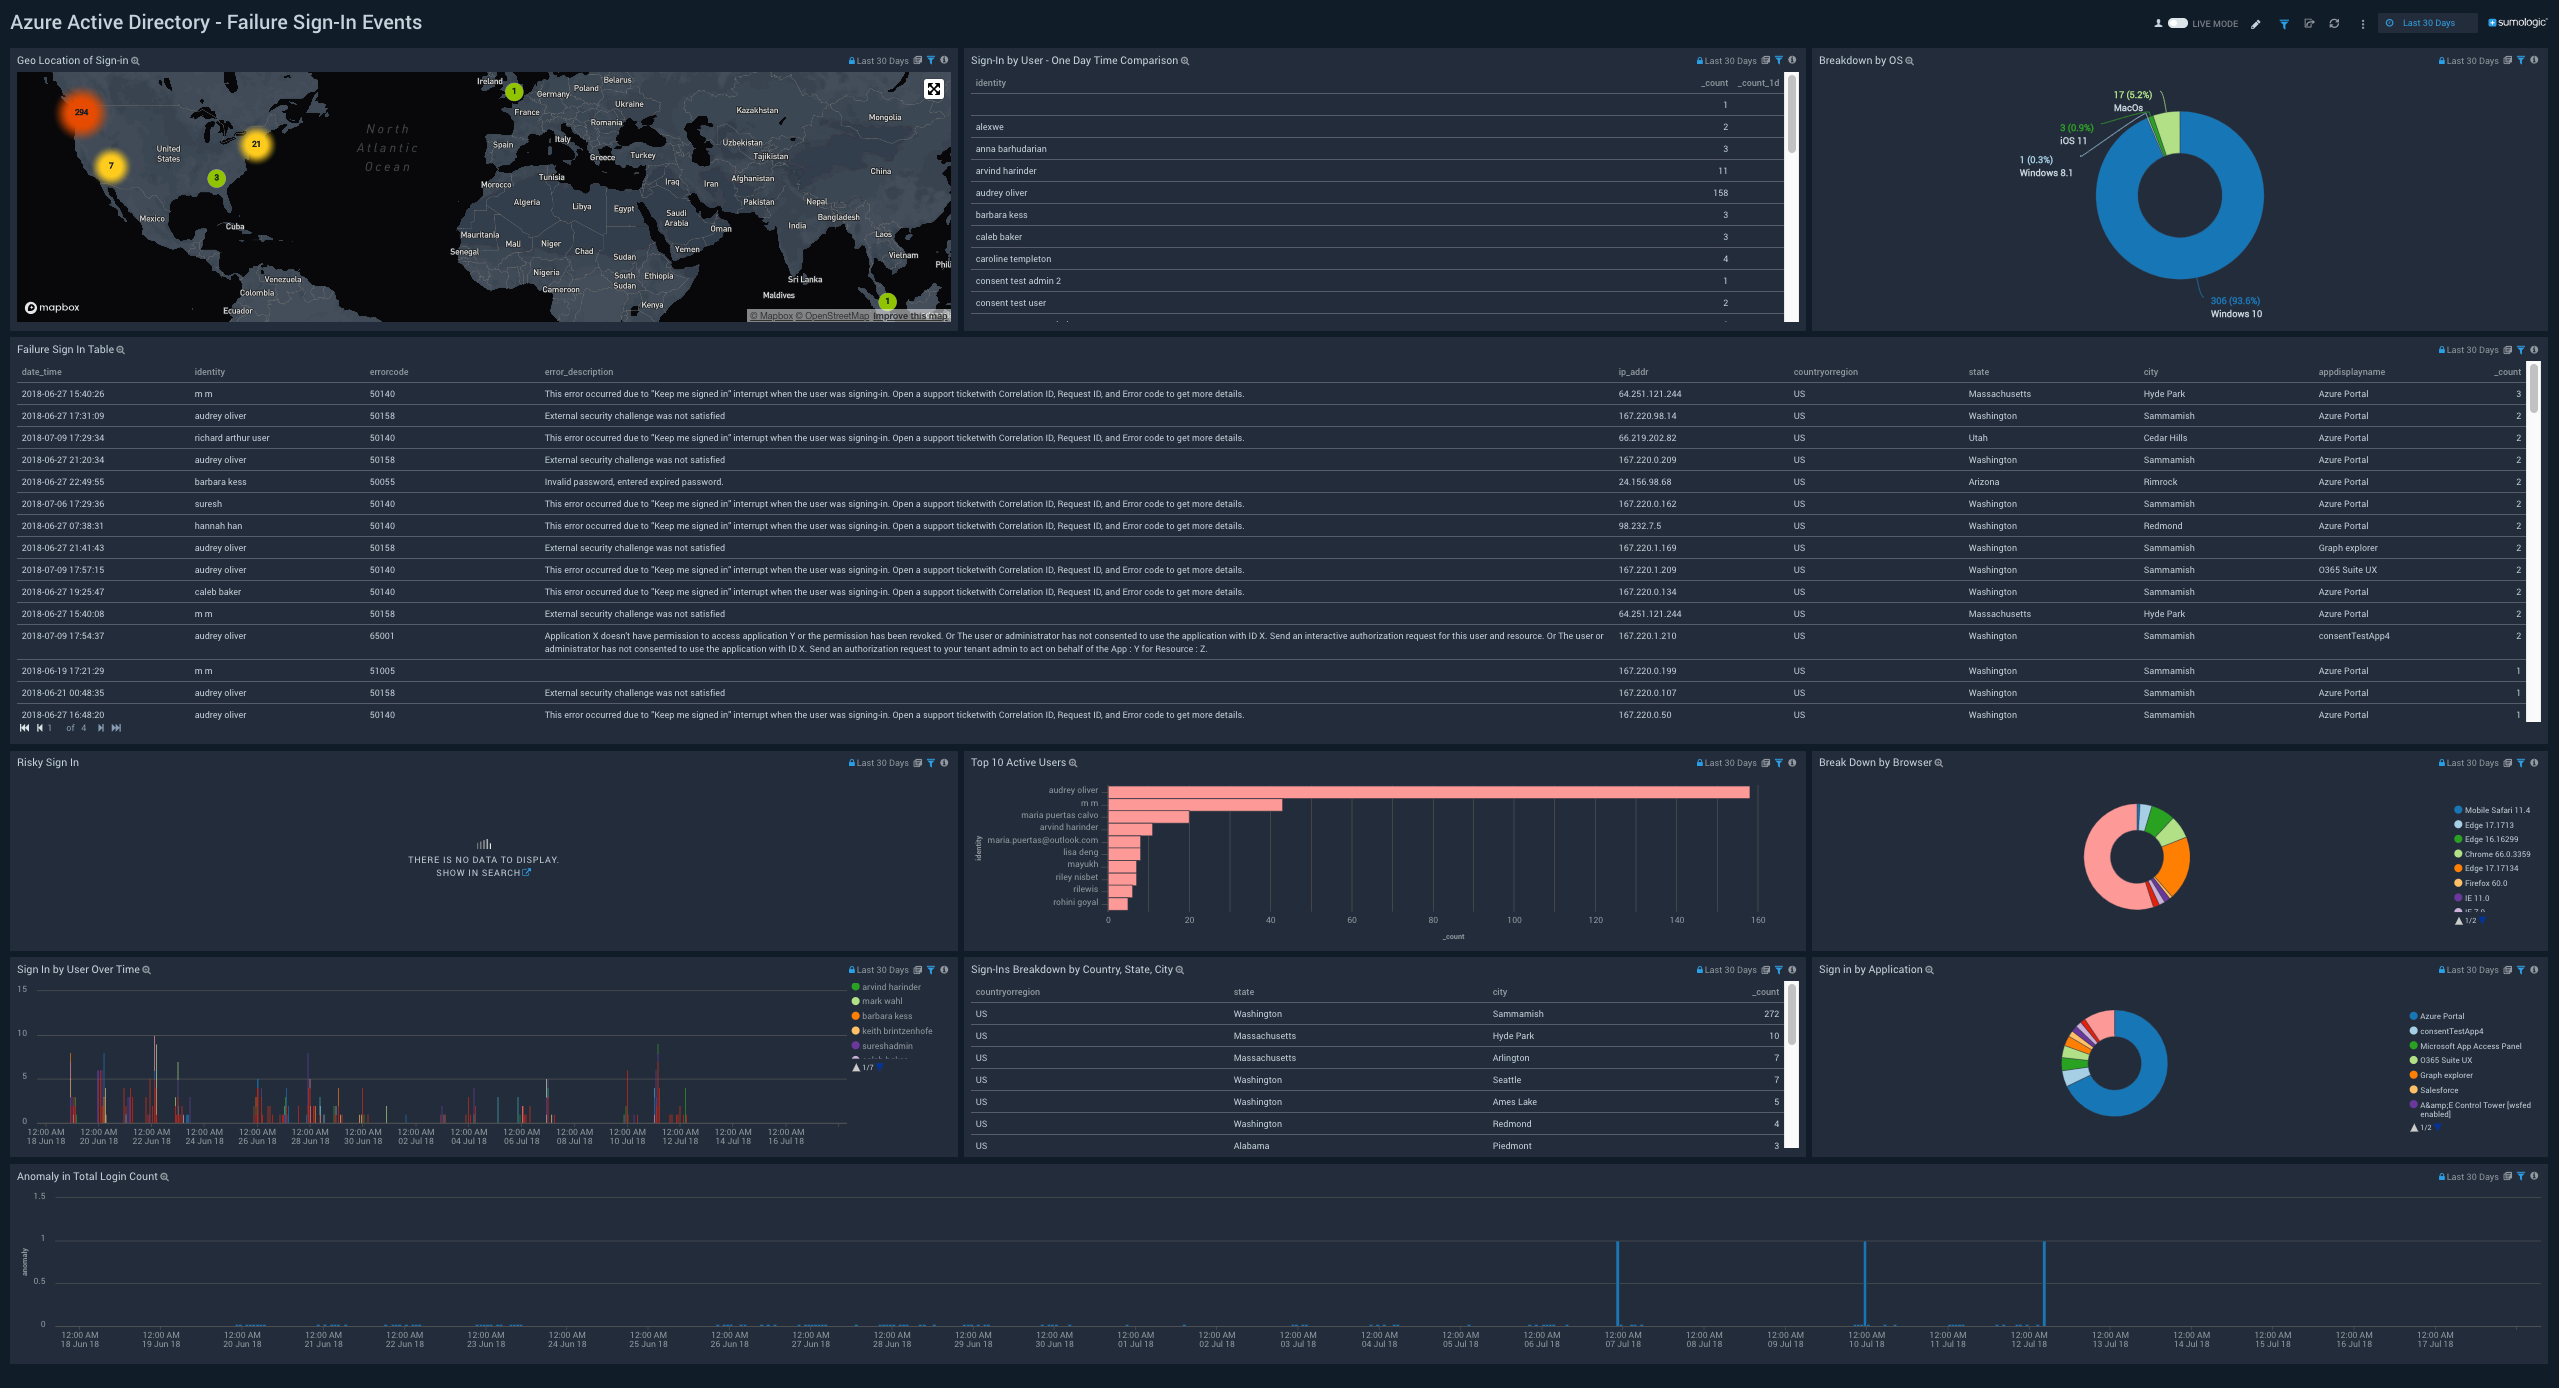
Geo Location of Sign-in. Performs a geo lookup query and displays the location and number of failure sign-in events on a map of the world for the last 24 hours.
Sign-In by User - One Day Time Comparison. Shows an aggregation table with the names of users with failed sign-in events in the last 24 hours along with a count, and compares it to the count of operations from one day before.
Breakdown by OS. Shows breakdown of the operating system that is the source of sign-in events.
Failure Sign In Table. Shows an aggregation table of failure sign-in events with columns for the date time, identity, error code, description, IP address, state, city, country, and source application name with the count for the last 24 hours.
Risky Sign In. Shows risky failure sign-in events.
Top 10 Active Users. Shows top 10 active users with failure sign-in events.
Break Down by Browser. Shows breakdown of the browser that is the source of sign-in events.
Sign In by User Over Time. Shows trend of failure sign-in events over time.
Breakdown by Country, State, City. Shows breakdown by country, state, and city.
Sign in by Application. Shows failure sign-in events by Application.
Anomaly in Total Login Count. Shows any Anomaly in the total failure login count over 7 days.