Azure Network Watcher

The Sumo Logic App for Azure Network Watcher leverages Network Security Group (NSG) flow logs to provide real-time visibility and analysis of your Azure Network. This App provides preconfigured Dashboards that allow you to monitor inbound traffic, outliers in traffic flow, and denied traffic flows.
Log Types
The Sumo Logic App for Azure Network Watcher uses Network Security Group (NSG) flow logs. NSG flow logs provide ingress and egress IP traffic flow with the following information:
- Inbound and Outbound flows per Rule
- NIC and traffic flow
- 5-tuple information with respect to flow (Source/Destination IP and Port, Protocol)
- Allowed/Denied traffic flow.
Sample Log Message
    {
      "time":"2017-09-27 21:22:33.443+0000",
      "sys_id":"4181995a-801f-4075-a56c-30b3671148bf",
      "category":"NetworkSecurityGroupFlowEvent",
      "resource_id":"/SUBSCRIPTIONS/C088DC46-D692-42AD-A4B6-9A542D28AD2A/RESOURCEGROUPS/AZURELABS/PROVIDERS/MICROSOFT.NETWORK/NETWORKSECURITYGROUPS/NSG-AZURELABS-03",
      "event_name":"NetworkSecurityGroupFlowEvents",
      "rule_name":"All_prod_tcp",
      "mac":"000D3AF86058",
      "src_ip":"51.148.136.204",
      "dest_IP":"107.198.121.243",
      "src_port":"47676",
      "dest_port":"4367",
      "protocol":"T",
      "traffic_destination":"I",
      "traffic_a/d":"D"
    }
Sample Query
_sourceCategory="security/flowlogs"
| json field=_raw "rule_name"
| json field=_raw "resource_id"
| json field=_raw "event_name"
| json field=_raw "mac"
| json field=_raw "src_ip"
| json field=_raw "dest_IP"
| json field=_raw "dest_port"
| json field=_raw "protocol"
| json field=_raw "traffic_destination"
| json field=_raw "traffic_a/d" as traffic_a_d
| parse regex field=resource_id"(?<NSG>[\w-_.]+)$"
| json field=_raw "src_port"
| where traffic_a_d = "D"
| lookup latitude, longitude, country_code, country_name, region, city, postal_code, area_code, metro_code from geo://default on ip = src_ip
| count by latitude, longitude, country_code, country_name, region, city, postal_code, area_code, metro_code
| sort _count
Collecting Logs for the Azure Network Watcher App
This document provides instructions for configuring the collection of NSG Flow Logs for the Azure Network Watcher App.
Configuration requirements
Before you begin configuring NSG Flow Log collection, make sure the following environment prerequisites are met:
- Your Storage Account must be of type General-purpose v2 or Blob storage.
- Your Network Security Group and Storage Account should be in same resource location.
- You also need to have Microsoft Authorization/role Assignments/write permissions, so they should be a "User Access Administrator" or "Owner".
Resource group names should not contains underscores (_).
Step 1: Configure Azure Storage Account
In this step you configure a storage account to which you will export monitoring data for your Azure service.
The storage account must be a General-purpose v2 (GPv2) storage account
If you have a storage account with a container that you want to use for this purpose, make a note of its resource group, storage account name and container name and proceed to step 2.
To configure an Azure storage account, do the following:
- Create a new storage account General-purpose v2 (GPv2) storage account. For instructions, see Create a storage account in Azure help.
- Create a container(Optional) all services in azure create containers automatically. This step is needed only when you are exporting custom logs in some container.
- In the Azure portal, navigate to the storage account you just created (in the previous step).
- Select Blobs under Blob Service.
- Select + Container,
- Enter the Name
- Select Private for the Public Access Level.
- Click OK.
Make a note of the container name. You will need to supply it later.
And now proceed to step 2. By default, the flow logs are in insights-logs-networksecuritygroupflowevent container.
If you have a storage account that you want to use for this purpose, make a note of its resource group, storage account name, then proceed to step 2. If you want to collect only flow logs from the storage account then you can add the filter /blobServices/default/containers/insights-logs-networksecuritygroupflowevent/.
Step 2: Configure an HTTP Source
This section demonstrates how to configure an HTTP source to receive logs from the Azure function.
To configure an HTTP source for Azure, do the following:
- Select a hosted collector where you want to configure the HTTP source. If desired, create a new hosted collector, as described on Configure a Hosted Collector.
- Configure an HTTP source, as described on HTTP Logs and Metrics Source. Make a note of the URL for the source, you will need it in the next step. I
- In Advanced Options for Logs, under Timestamp Format, click Specify a format and enter the following:
- Specify Format as epoch
- Specify Timestamp locator as
\"time\": (.*),
Step 3: Configure Azure Resources using ARM template
In this step, you use a Sumo-provided Azure Resource Manager (ARM) template to create an Event Hub, three Azure functions, Service Bus Queue, and a Storage Account.
- Download the blobreaderdeploy.json ARM template. The above template uses Consumption Plan which does not support VNet integration, you can use blobreaderdeploywithPremiumPlan.json which uses Elastic Premium plan.
- Click Create a Resource, search for Template deployment in the Azure Portal, and then click Create.
- On the Custom deployment blade, click Build your own template in the editor.
- Copy the contents of the template and paste it into the editor window.
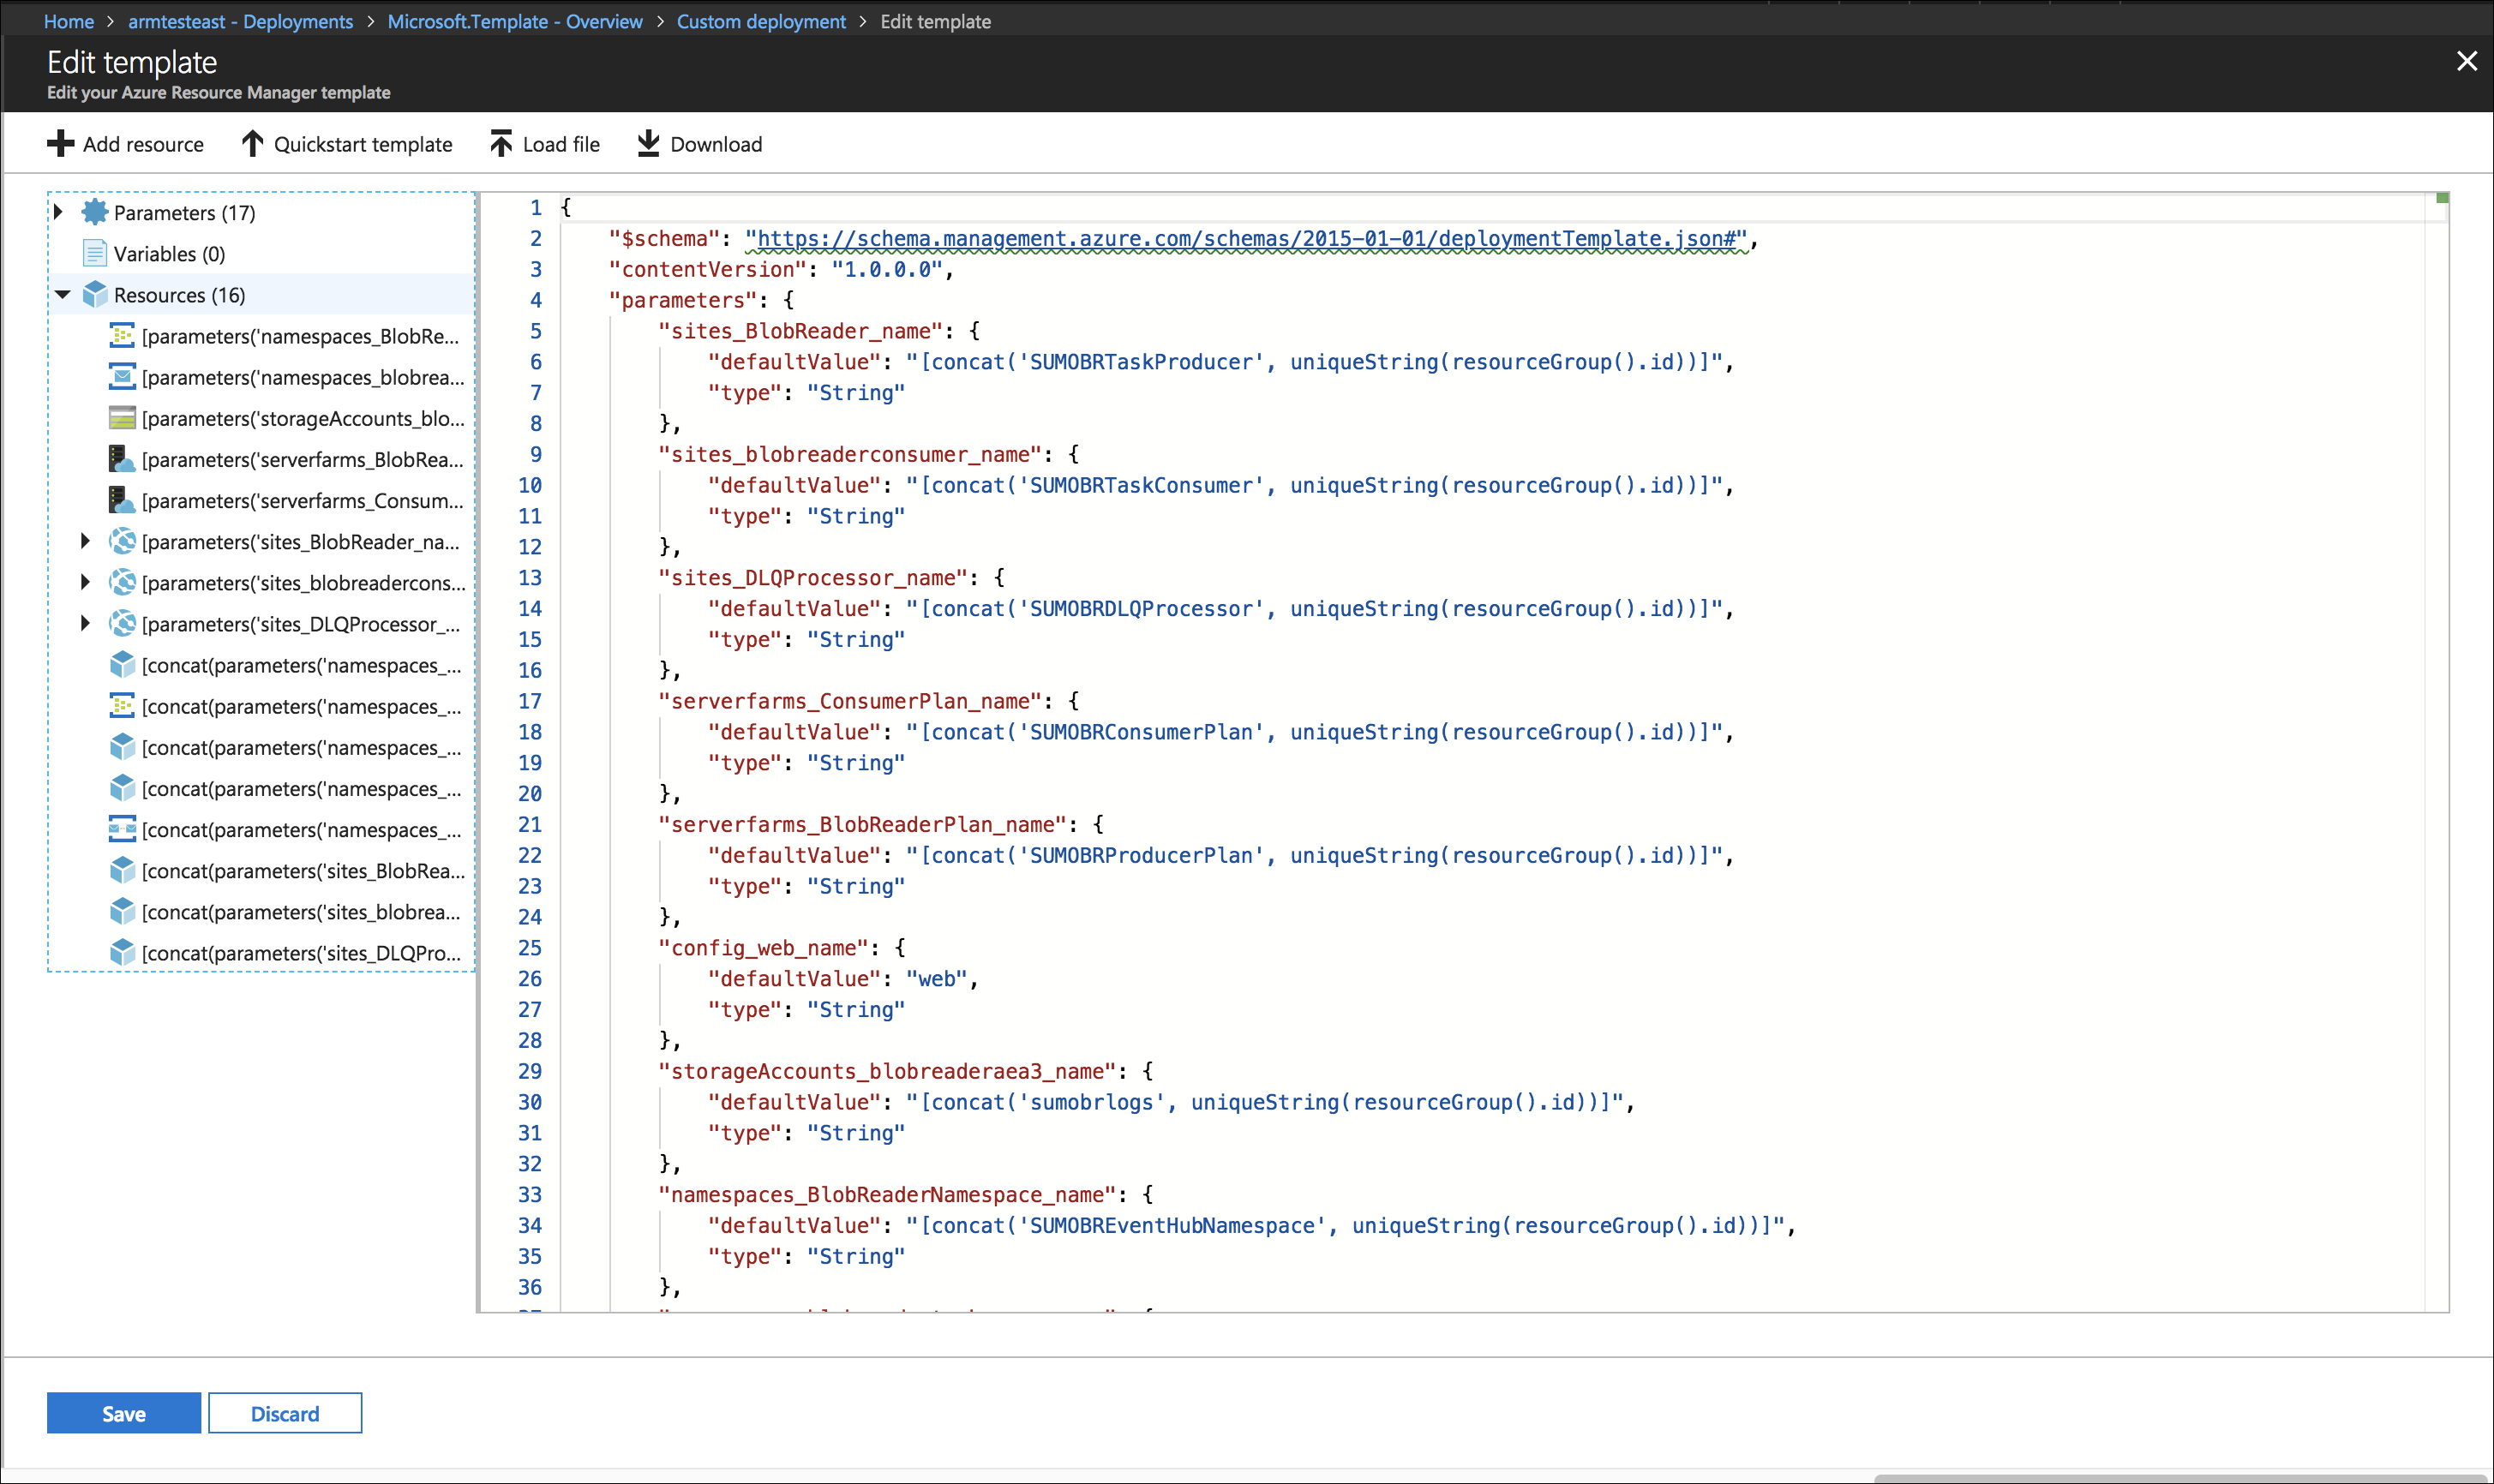
- Click Save.
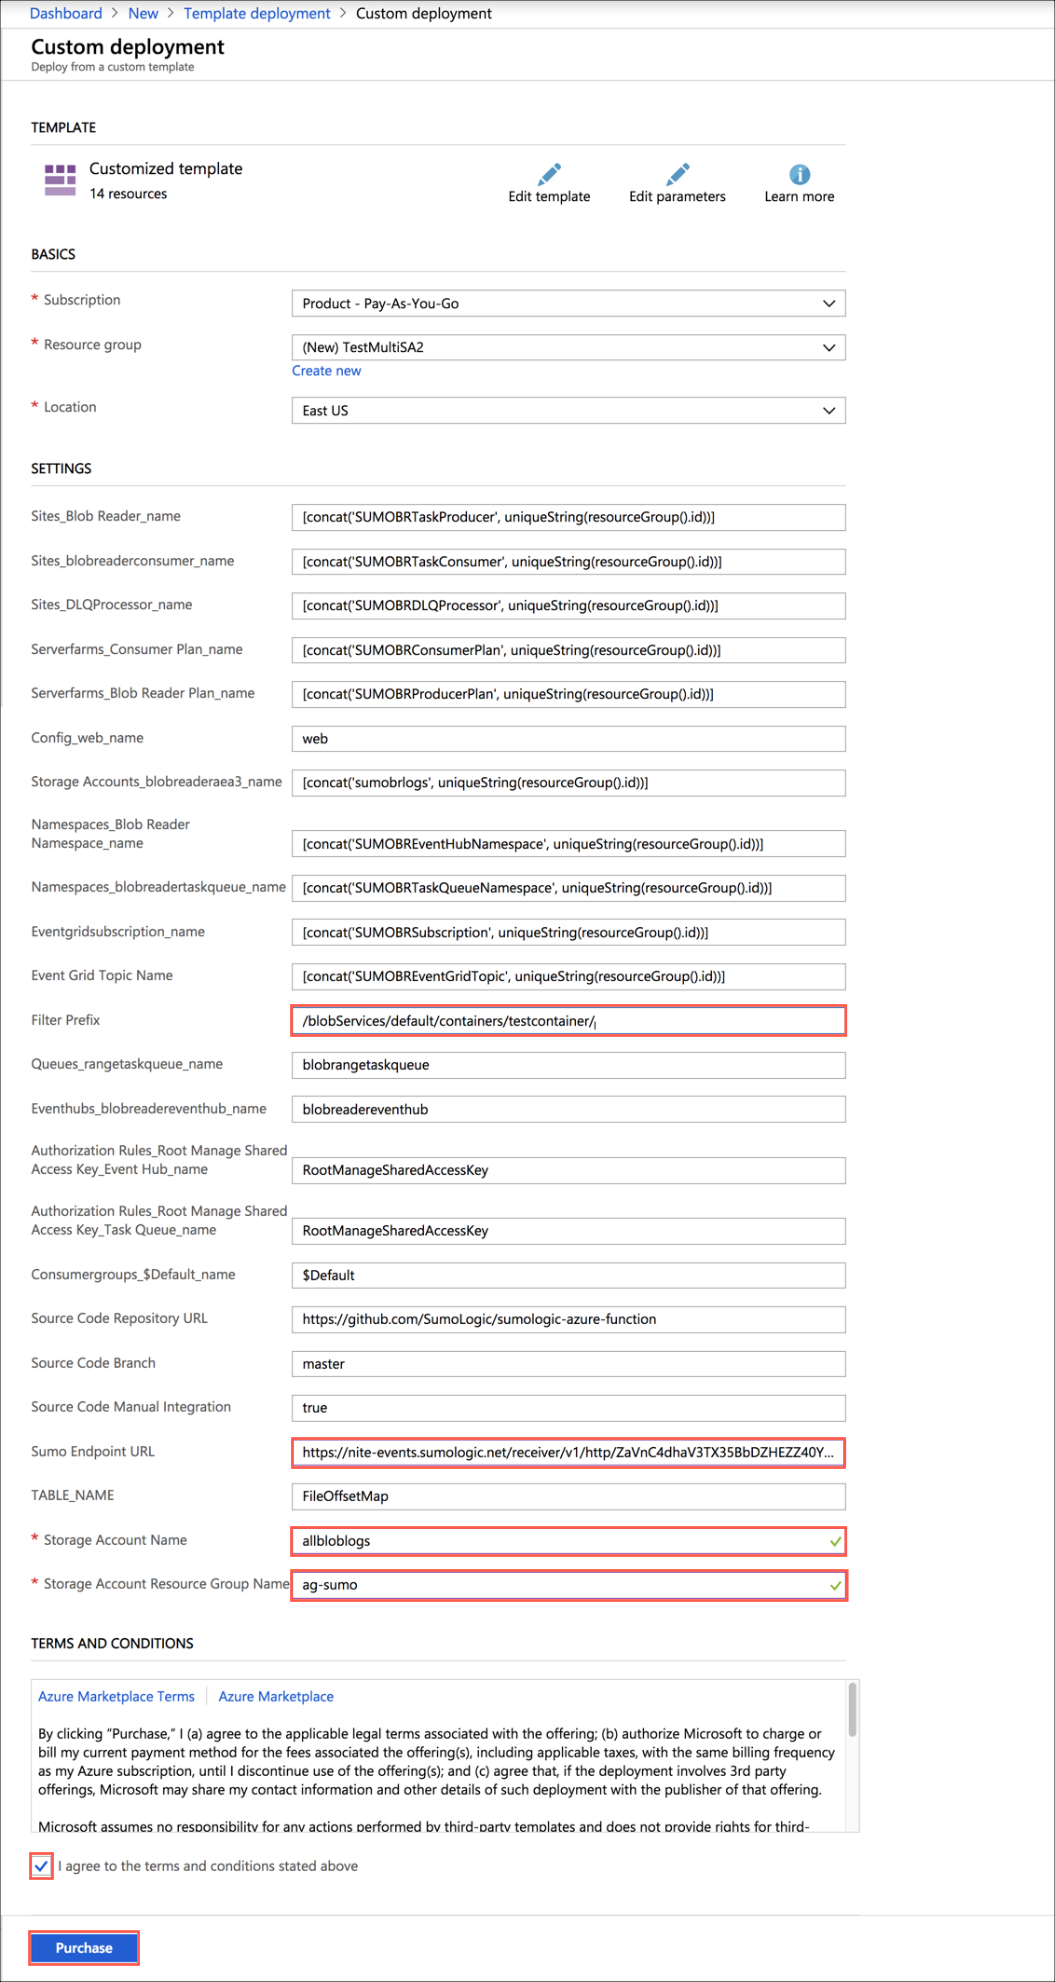
- On the Custom deployment blade, do the following:
- Create a new Resource Group (recommended) or select an existing one.
- Choose Location.
- Set the values of the following parameters:
- SumoEndpointURL: URL for the HTTP source you configured in Step 2 above.
- StorageAccountName: Name of the storage account where you are storing logs from Azure Service, that you configured in Step 1 above.
- StorageAccountResourceGroupName: Name of the resource group of the storage account you configured in Step 1 above.
- Filter Prefix (Optional): If you want to filter logs from a specific container, enter the following, replacing the variable with your container name:
/blobServices/default/containers/<container_name>/
Resource group names should not consist of an underscore.
- Select the check box to agree to the terms and conditions, and then click Purchase.
- Verify the deployment was successful by looking at Notifications at top right corner of Azure Portal.
- (Optional) In the same window, click Go to resource group to verify the all resources were successfully created, such as shown in the following example:
- Go to Storage accounts and search for sumobrlogs, then select
sumobrlogs<random-string>. - Under Table Service do the following:
- Click Tables.
- Click + Table.
- For Name, enter FileOffsetMap.
- Click OK.
Step 4: Enable NSG flow logs via the Azure Portal
In this step, you enable NSG flow logs with the Azure portal.
- Follow the steps detailed in the Microsoft Azure Network Watcher documentation to enable the flow logs to point to the storage account you configured in Configure Azure Storage Account section.
Troubleshooting
If logs don't start flowing into Sumo Logic after you perform the configuration above, see Troubleshoot Azure Blob Storage Log Collection.
Installing the Azure Network Watcher App
Now that you have configured Azure Network Watcher, install the Sumo Logic App for Azure Network Watcher to take advantage of the preconfigured searches and dashboards to analyze your data.
To install the app:
Locate and install the app you need from the App Catalog. If you want to see a preview of the dashboards included with the app before installing, click Preview Dashboards.
- From the App Catalog, search for and select the app.
- Select the version of the service you're using and click Add to Library. Version selection is applicable only to a few apps currently. For more information, see Installing the Apps from the Library.
- To install the app, complete the following fields.
- App Name. You can retain the existing name, or enter a name of your choice for the app.
- Data Source. Select either of these options for the data source.
- Choose Source Category, and select a source category from the list.
- Choose Enter a Custom Data Filter, and enter a custom source category beginning with an underscore. Example: (
_sourceCategory=MyCategory).
- Advanced. Select the Location in Library (the default is the Personal folder in the library), or click New Folder to add a new folder.
- Click Add to Library.
Once an app is installed, it will appear in your Personal folder, or other folder that you specified. From here, you can share it with your organization.
Panels will start to fill automatically. It's important to note that each panel slowly fills with data matching the time range query and received since the panel was created. Results won't immediately be available, but with a bit of time, you'll see full graphs and maps.
Viewing Azure Network Watcher Dashboards
All Dashboards include filters that you can use in Interactive Mode for further analysis of your data.
Overview
This Dashboard provides general information of the NSG flow logs, including Panels that drill-down into queries with NIC, tuple and traffic flow information. The Overview Dashboard gives a good starting point for detecting outlier in denied traffic and geographic hotspots for inbound traffic. In addition, this Dashboard allows users to filter data by rule name, source/destination IP and port, and other metadata fields.
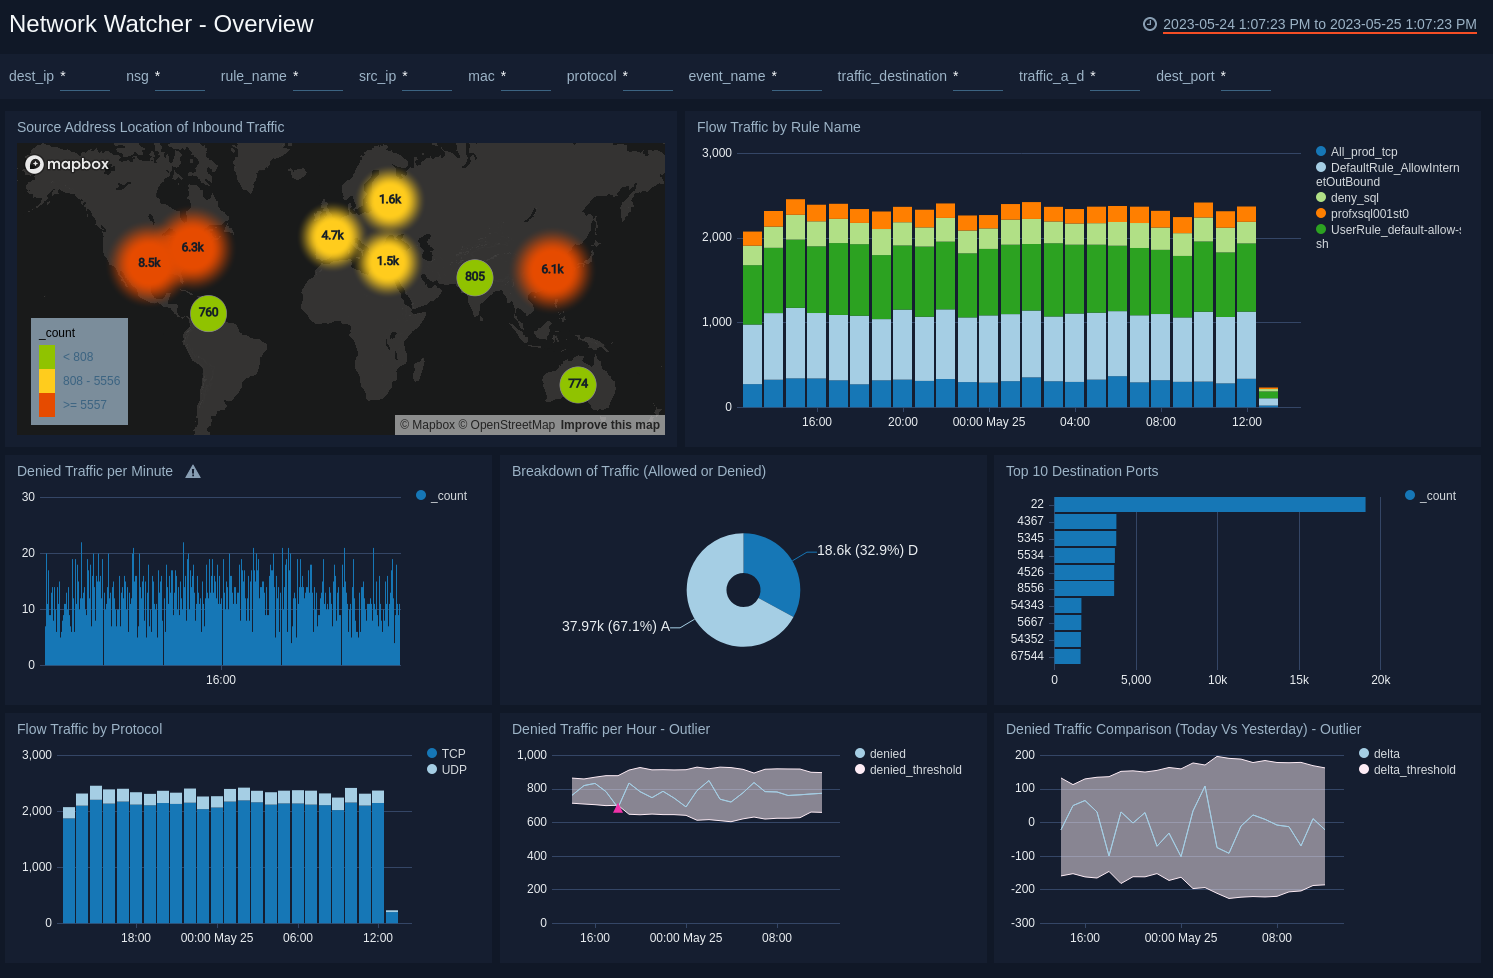
Source Address Location of Inbound Traffic. Displays geo-location of Inbound Traffic.
Flow Traffic by Rule Name. Shows breakdown of all traffic, by Security Rule name, set up at NSG level.
Denied Traffic per Minute. Shows trend in Denied Inbound traffic flow per minute.
Breakdown of Traffic (Allowed or Denied). Displays traffic breakdown by Allowed or Denied flow.
Top 10 Destination Ports. Shows top 10 destination ports in last 24 hours.
Flow Traffic by Protocol. Displays trend of traffic by protocol (TCP/UDP).
Denied Traffic per Hour - Outlier. Using Sumo Logic machine learning Outlier operator, shows any unexpected sequence in denied traffic.
Denied Traffic Comparison (Today Vs Yesterday) - Outlier. Compares denied traffic of last 24 hours with previous 24 hours and shows any unexpected difference between two time periods.
Denied Traffic Flow
This Dashboard drills down on denied traffic flow logs, shows geographic hotspots of denied traffic, top denied IPs and ports, and denied traffic trends by rule name.
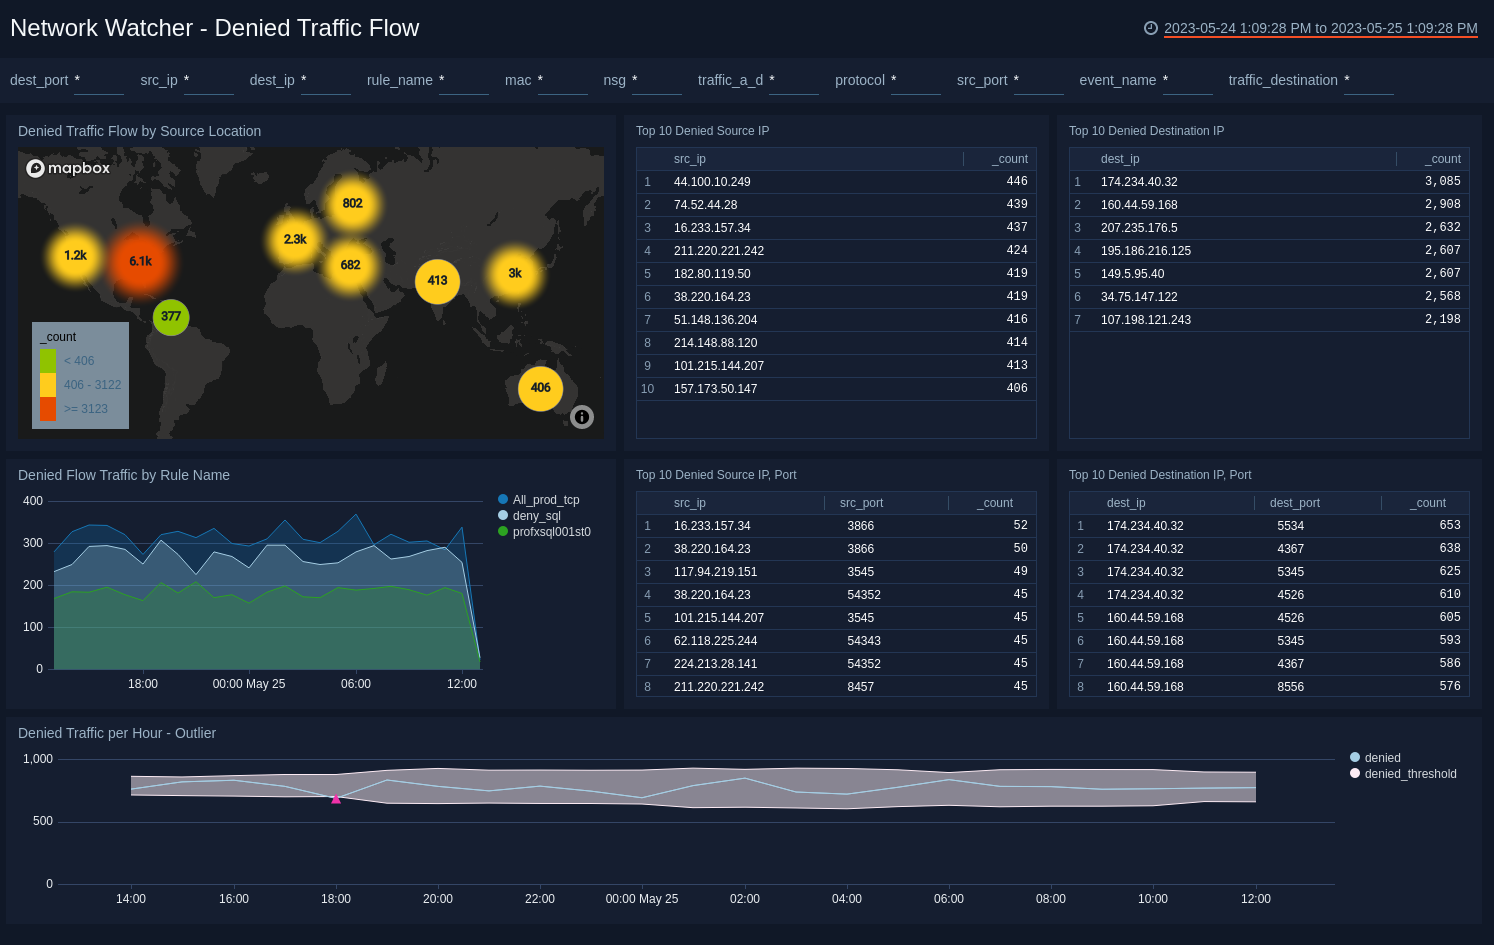
Denied Traffic Flow by Source Location. Shows geographic hotspots of denied traffic flow.
Top 10 Denied Source IP. Displays a table of source IP addresses with denied traffic flow.
Top 10 Denied Destination IP. Displays a table of destination IP addresses with denied traffic flow.
Denied Flow Traffic by Rule Name. Shows trends in denied traffic flow with rule name over last 24 hours.
Top 10 Denied Source IP, Port. Displays a table of source IP addresses and ports with denied traffic flow.
Top 10 Denied Destination IP, Port. Displays a table of destination IP addresses and ports with denied traffic flow.
Denied Traffic per Hour - Outlier. Using Sumo Logic machine learning Outlier operator, shows any unexpected sequence in denied traffic.