Active Directory JSON - Classic Collector
The Active Directory JSON App helps you monitor your Windows Active Directory deployment by analyzing Active Directory logs in the JSON based event log format. The app includes predefined searches and dashboards that provide user activity into your environment for real-time analysis of overall usage.
We recommend using the Active Directory JSON App in combination with the Windows JSON App.
Log Types
Standard Windows event channels include:
- Security
- System
- Application
Custom event channels, such as PowerShell or Internet Explorer are also supported.
Sample Log Messages
{
    "TimeCreated":"2020-10-12T08:00:02+000001500Z",
    "EventID":"5137",
    "Task":14081,
    "Correlation":"",
    "Keywords":"Audit Success",
    "Channel":"Security",
    "Opcode":"Info",
    "Security":"",
    "Provider":{
        "Guid":"{54849625-5478-4994-a5ba-3e3b0328c30d}",
        "Name":"Microsoft-Windows-Security-Auditing"
    },
    "EventRecordID":5383143,
    "Execution":{
        "ThreadID":880,
        "ProcessID":776
    },
    "Version":0,
    "Computer":"EC2AMAZ-6D5CO5AB123.test.format",
    "Level":"Information",
    "EventData":{
        "DSType":"%%14676",
        "SubjectUserSid":"S-1-5-21-916893464-2020-10-12T08:00:02-2020-10-12T08:00:02-500",
        "OpCorrelationID":"{cdb02928-b7a6-4373-9b12-4e371f30c30d}",
        "SubjectUserName":"Administrator",
        "DSName":"test.format",
        "AppCorrelationID":"-",
        "ObjectGUID":"{56bf5011-b09d-43f5-bcd2-06a1d917c402}",
        "ObjectDN":"CN=TomJerry,OU=Domain Controllers,DC=test,DC=format",
        "SubjectLogonId":"0x73199",
        "ObjectClass":"computer",
        "SubjectDomainName":"TEST"
    },
    "Message":"A directory service object was created.\r\n\t\r\nSubject:\r\n\tSecurity ID:\t\tTEST\\Administrator\r\n\tAccount Name:\t\tAdministrator\r\n\tAccount Domain:\t\tTEST\r\n\tLogon ID:\t\t0x73199\r\n\t\r\nDirectory Service:\r\n\tName:\ttest.format\r\n\tType:\tActive Directory Domain Services\r\n\t\r\nObject:\r\n\tDN:\tCN=TomJerry,OU=Domain Controllers,DC=test,DC=format\r\n\tGUID:\t{56bf5011-b09d-43f5-bcd2-06a1d917c402}\r\n\tClass:\tcomputer\r\n\t\r\nOperation:\r\n\tCorrelation ID:\t{cdb02928-b7a6-4373-9b12-4e371f30c30d}\r\n\tApplication Correlation ID:\t-"
}
Sample Query
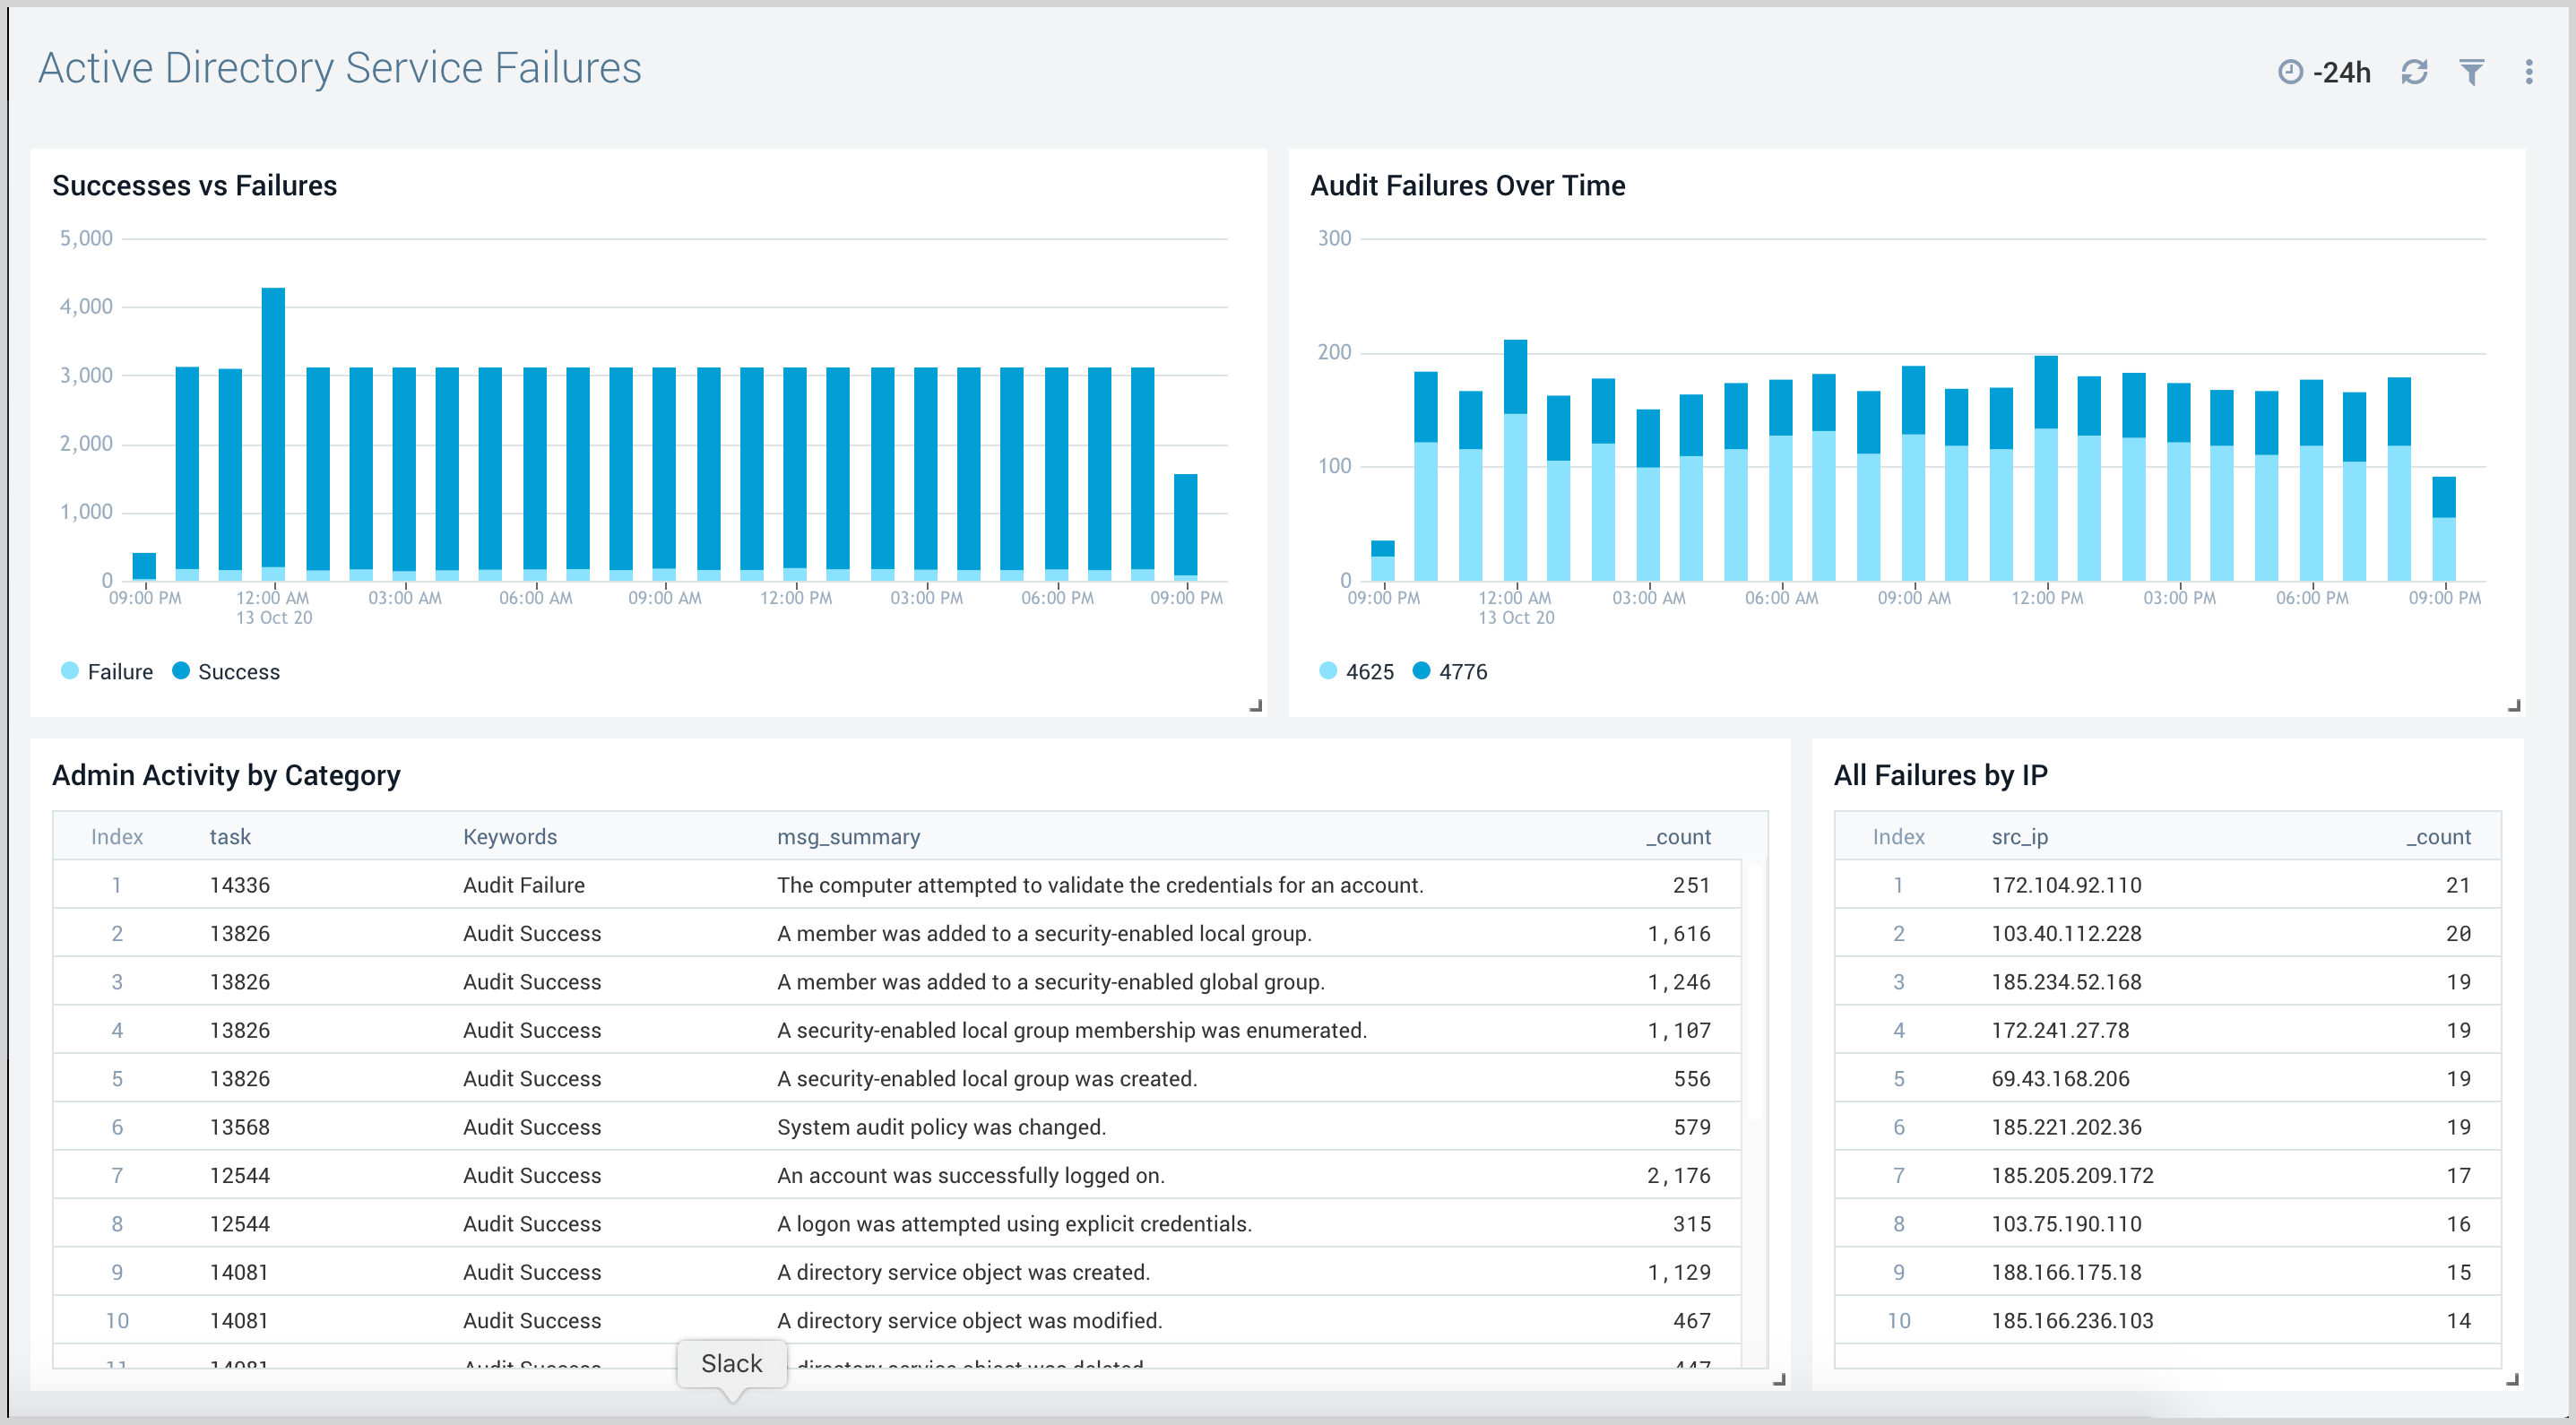
The sample query is from Successes Vs Failures panel from Active Directory Service Failures dashboard.
_sourceCategory=Labs/windows-jsonformat
| json "EventID", "Computer", "Keywords" as event_id, host, keywords nodrop
| if (keywords = "Audit Failure", "Failure", "Success") as status
| where host matches "*"
| timeslice 1h
| count as EventCount by  status, _timeslice
| transpose row _timeslice column status
Collecting Logs
This section provides instructions on configuring log collection for the Active Directory JSON App so that logs are collected from the Microsoft Windows Event Log and ingested into Sumo Logic.
Configure a Collector and a Source
To configure a collector and source, do the following:
- Configure an Installed Windows collector through the user interface or from the command line.
- Configure either a local or remote Windows Event Log source. To configure a Windows Event Log source set the following:
- Event Format. Select Collect using JSON format.
Collect using JSON format.** Events are formatted into JSON that is designed to work with Sumo Logic features, making it easier for you to reference your data.
- Event Collection Level. When JSON format is selected you have to select Complete Message from the dropdown. Complete Message will ingest the entire event content along with metadata.
For more information on local or remote Windows Event Log Source configuration, refer to Local Windows Event Log Source and Remote Windows Event Log Source.
Installing the Active Directory JSON App
To install the app:
Locate and install the app you need from the App Catalog. If you want to see a preview of the dashboards included with the app before installing, click Preview Dashboards.
- From the App Catalog, search for and select the app.
- Select the version of the service you're using and click Add to Library.
Version selection is applicable only to a few apps currently. For more information, see Installing the Apps from the Library.
- To install the app, complete the following fields.
- App Name. You can retain the existing name, or enter a name of your choice for the app.
- Data Source. Select either of these options for the data source.
- Choose Source Category, and select a source category from the list.
- Choose Enter a Custom Data Filter, and enter a custom source category beginning with an underscore. Example: (
_sourceCategory=MyCategory).
- Advanced. Select the Location in Library (the default is the Personal folder in the library), or click New Folder to add a new folder.
- Click Add to Library.
Once an app is installed, it will appear in your Personal folder, or other folder that you specified. From here, you can share it with your organization.
Panels will start to fill automatically. It's important to note that each panel slowly fills with data matching the time range query and received since the panel was created. Results won't immediately be available, but with a bit of time, you'll see full graphs and maps.
Viewing Active Directory JSON Dashboards
Template variables provide dynamic dashboards that can rescope data on the fly. As you apply variables to troubleshoot through your dashboard, you view dynamic changes to the data for a quicker resolution to the root cause. You can use template variables to drill down and examine the data on a granular level. For more information, see Filter with template variables.
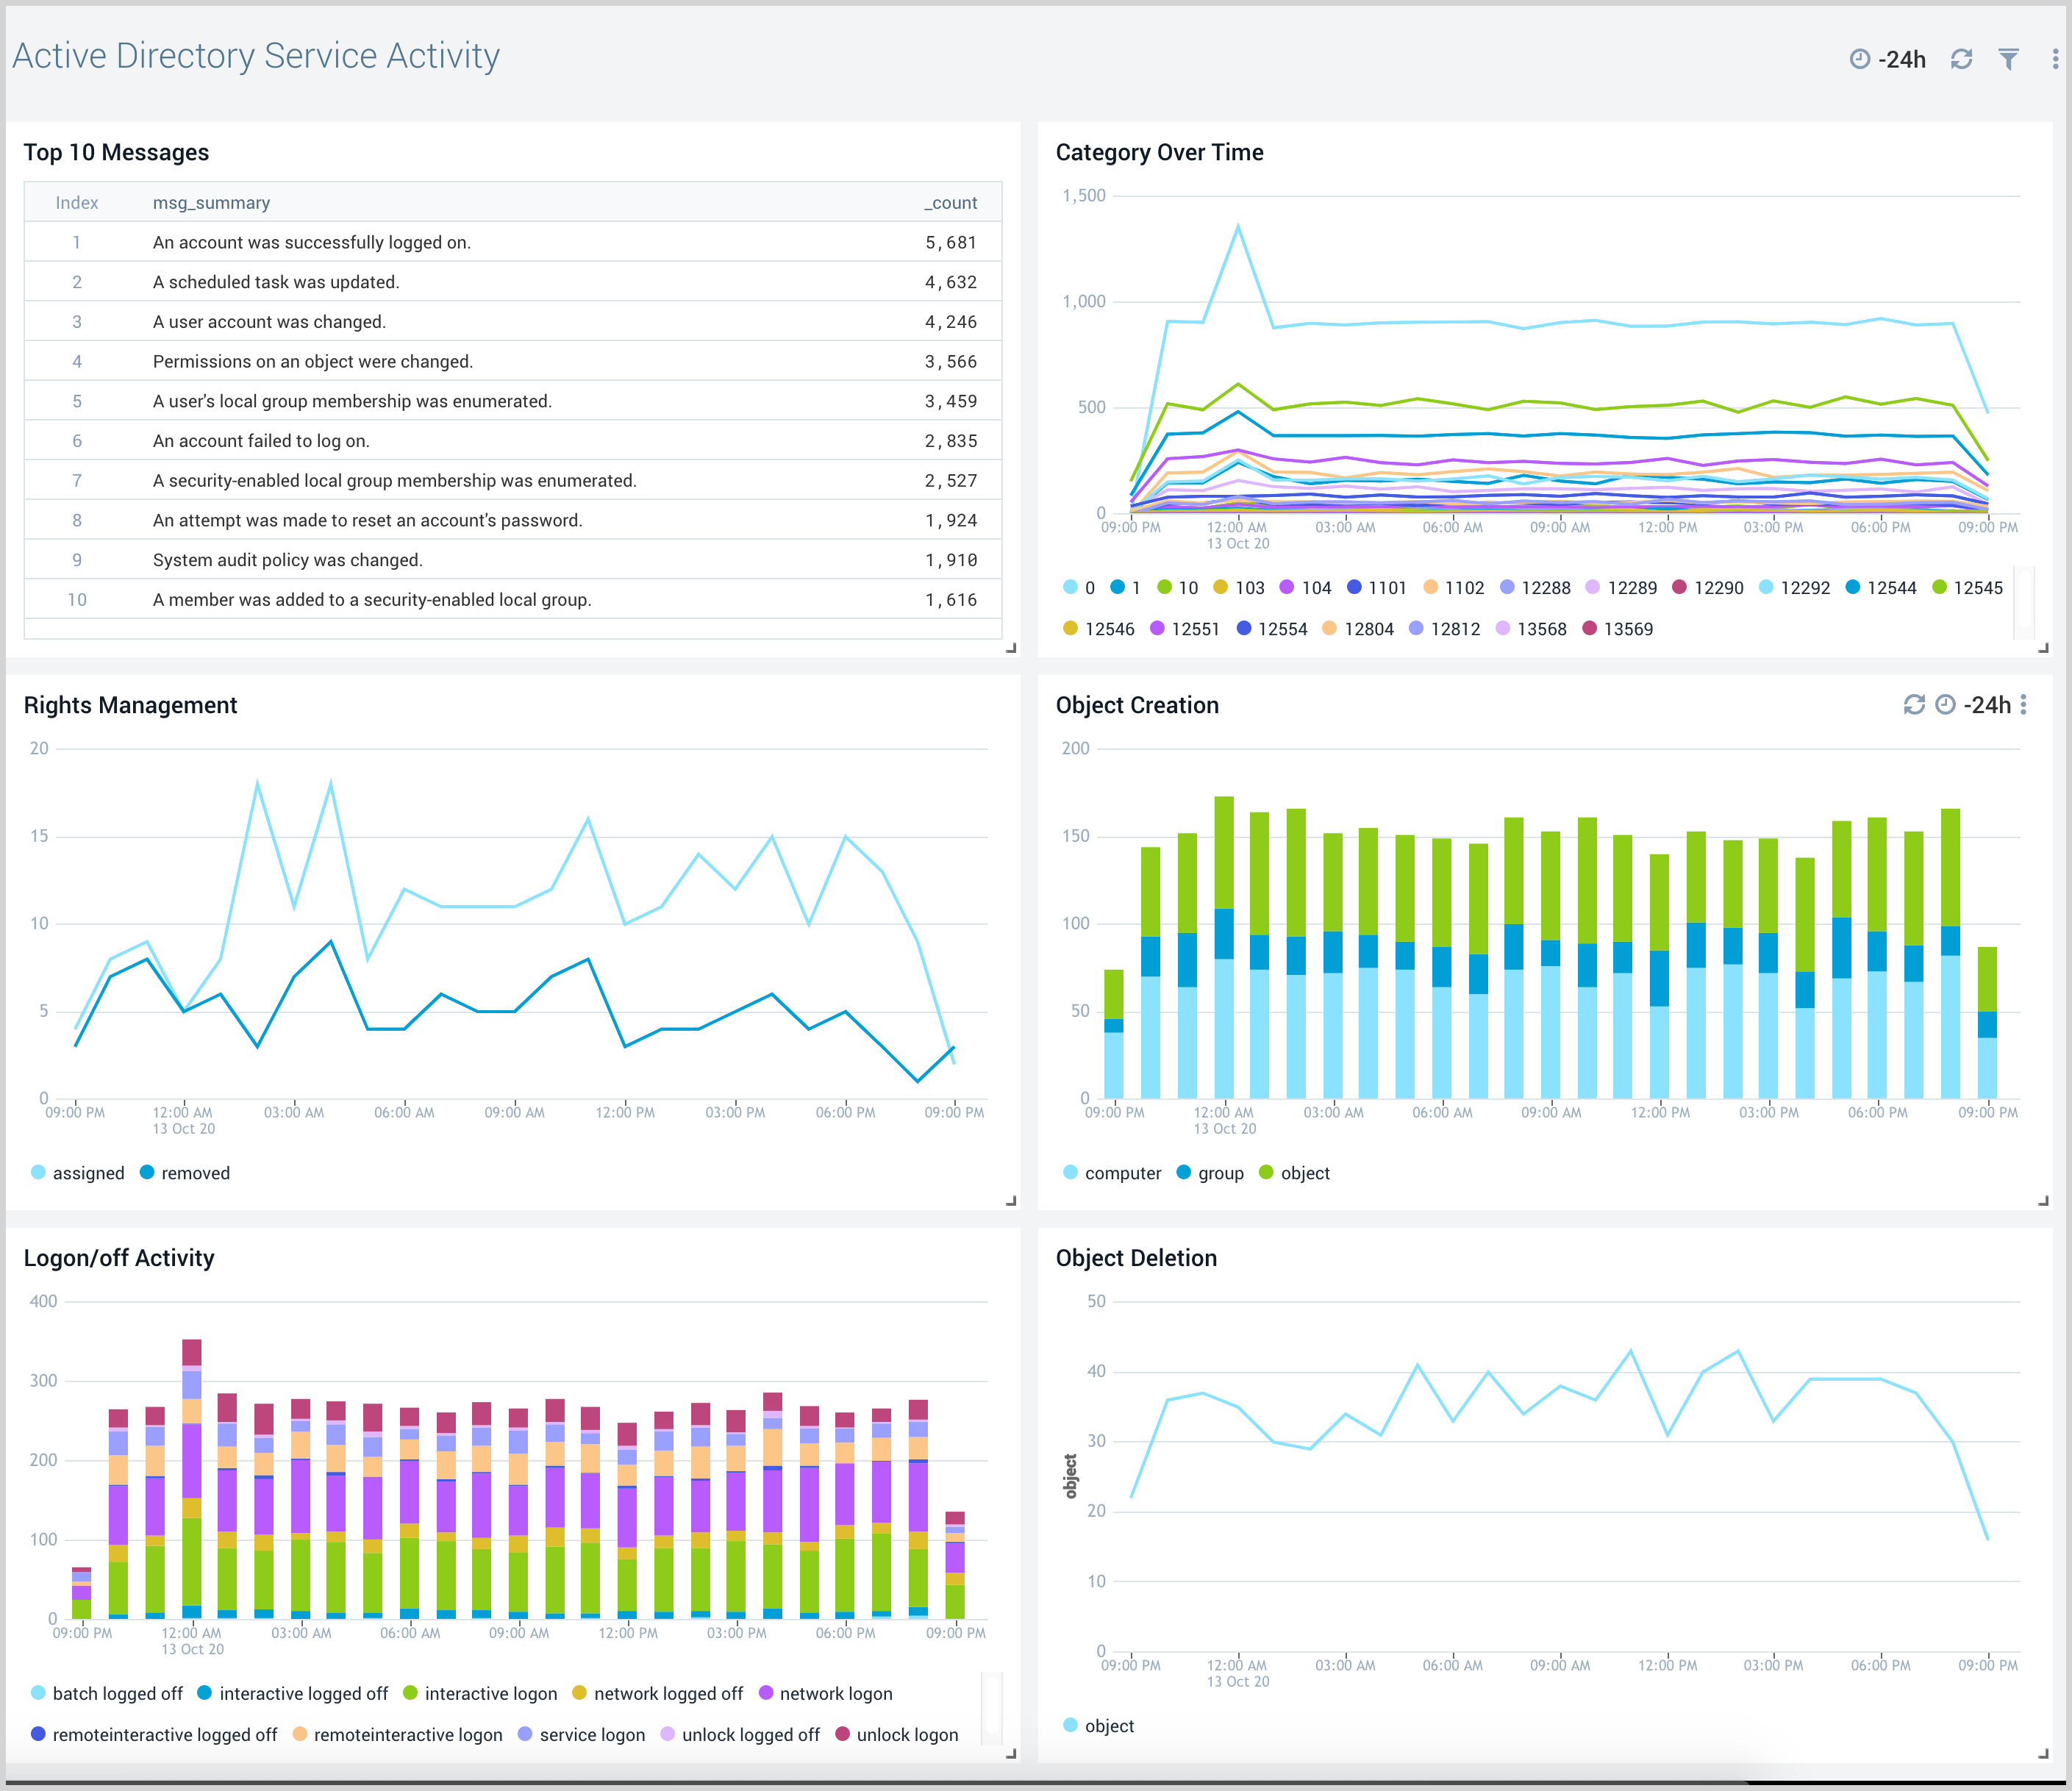
Service Activity
The Active Directory Service Activity dashboard provides insights into overall active directory services like messages overtime, logon/off activity, object creation, and deletion.
Use this dashboard to:
- Monitor object creation and deletion activities.
- Monitor rights assigned to a user or rights removed from a user.
- Monitor logon/logoff activity by various logon types.
- Monitor top 10 activities with concise message.
Service Failures
The Active Directory Service Failures dashboard provides an at-a-glance view of success, failures, and audit failures overtime.
Use this dashboard to:
- Monitor success and failure trends to check for any deviation from normal.
- Monitor all failed audit events along with administrative activities by event categories.
- Track IP addresses associated with failed activities.