AWS Cost Explorer
AWS Cost Explorer provides you with a set of default reports that you can use as the starting place for your analysis. From there, use the filtering and grouping capabilities to dive deeper into your cost and usage data and generate custom insights.
The Sumo Logic App for AWS Cost Explorer lets you visualize, understand, and manage your AWS costs and usage over time.
Log Types
The AWS Cost Explorer App uses the JSON formatted logs collected using AWS Cost Explorer source.
Sample Log
{
   "Timestamp":1647129599999,
   "Estimated":true,
   "Service":"AmazonCloudWatch",
   "Operation":"PutLogEvents",
   "region":"us-east-1",
   "StartDate":"2022-03-12",
   "EndDate":"2022-03-13",
   "CostUsd":0.1326919963,
   "MetricType":"UnblendedCost",
   "Granularity":"Monthly",
   "CostType":"cost_service_operation_region_UnblendedCost_Monthly"
}
Sample Query
The following query sample was taken from the Cost by Region panel on the AWS Cost Explorer - Account dashboard.
account={{account}} region CostUsd CostType StartDate EndDate MetricType Granularity Daily
| json "region", "CostUsd", "CostType", "StartDate", "EndDate", "MetricType", "Granularity", "Estimated"
| where MetricType matches "{{MetricType}}" and estimated matches "{{estimated}}"
| where Granularity = "Daily" and CostType = "cost_region_{{MetricType}}_Daily"
| last(CostUsd) as CostUsd by StartDate, EndDate, account, region, CostType, MetricType, Granularity, Estimated
| sum(CostUsd) as total_cost by region
| sort by total_cost, region
| limit 10
Create a AWS Cost Explorer Collector Source
When you create an AWS Cost Explorer collector Source, you add it to an existing Sumo Logic hosted collector. Before creating the Source, you'll need to add a Field-in-Field Schema, Field Extraction Rules, and identify or create the hosted collector you want to use.
Field-in-Field Schema
Log in to Sumo Logic, go to Manage Data > Logs > Fields. Search for the account and linkedaccount field. If not present, create it. Learn how to create and manage fields here.
Field Extraction Rules
Create a Field Extraction Rule (FER) for AWS Cost Explorer Logs. Learn how to create a Field Extraction Rule here.
- Rule Name: AWSCostExplorerFER
- Applied at: Ingest Time
- Scope (Specific Data):
account = * region CostUsd CostType StartDate EndDate MetricType Granularity Service LinkedAccount - Parse Expression: Enter a parse expression to create an “account” field that maps to the alias you set for each sub account. For example, if you used the “securityprod” alias for an AWS account with ID "123456789" and the “infraprod” alias for an AWS account with ID "987654321", your parse expression would look like:
json "LinkedAccount"
| if (LinkedAccount = "123456789",  "securityprod", LinkedAccount ) as LinkedAccount
| if (LinkedAccount = "987654321",  "infraprod", LinkedAccount ) as LinkedAccount
Configure an AWS Cost Explorer Source
To configure an AWS Cost Explorer Source:
- On the Manage Data > Collection > Collection page, click Add Source next to a Hosted Collector.
- Select AWS Cost Explorer.
- Enter a Name for the Source in the Sumo Logic console. The Description is optional.
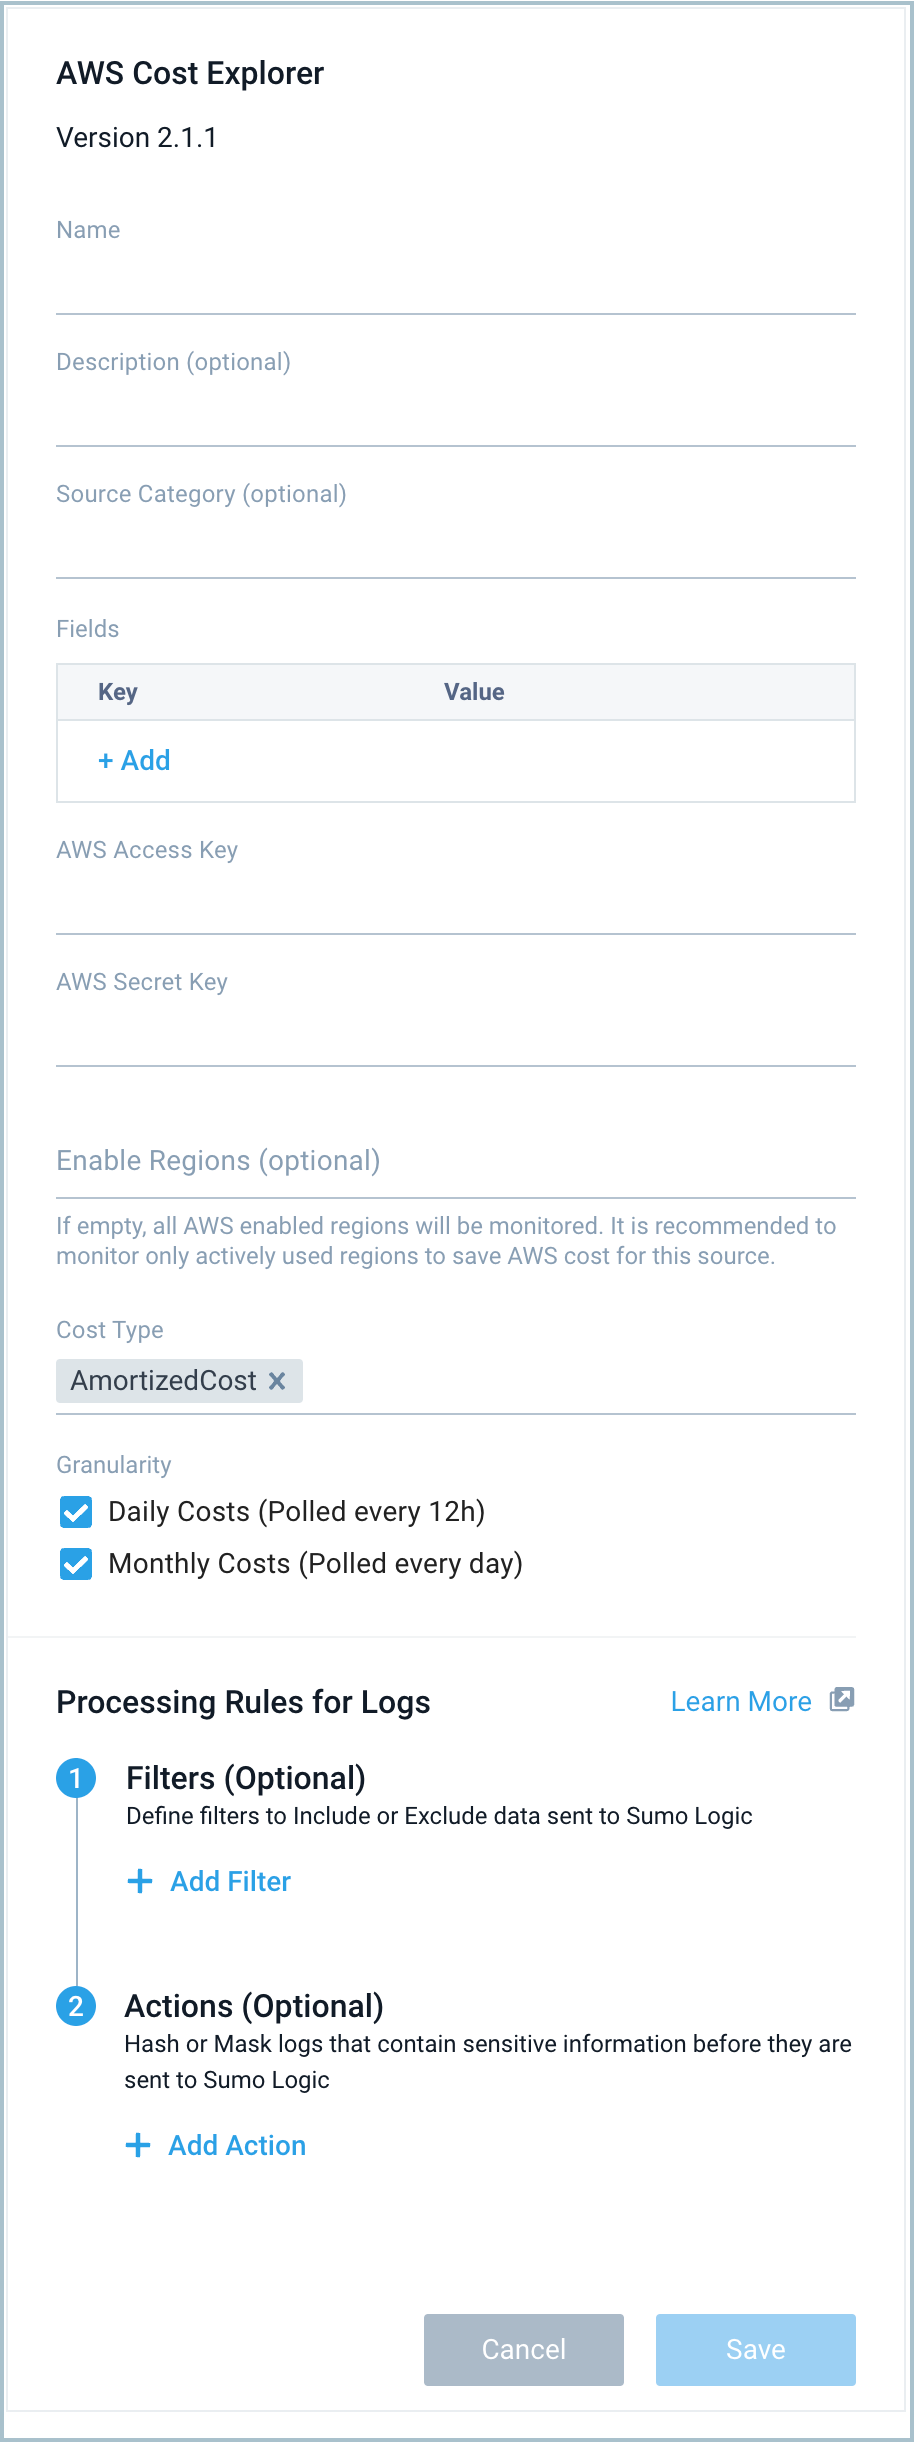
- For Source Category (Optional), enter any string to tag the output collected from the Source. Category metadata is stored in a searchable field called
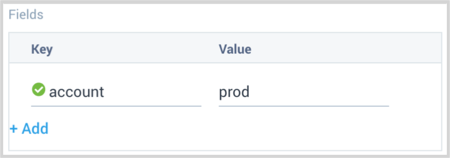
_sourceCategory. - For Fields, click the +Add link to add custom log metadata. Define the fields you want to associate, each field needs a name (key) and value.
 A green circle with a check mark is shown when the field exists and is enabled in the Fields table schema.
 An orange triangle with an exclamation point is shown when the field doesn't exist, or is disabled, in the Fields table schema. In this case, an option to automatically add or enable the nonexistent fields to the Fields table schema is provided. If a field is sent to Sumo Logic that does not exist in the Fields schema or is disabled it is ignored, known as dropped.
It is preferable to add an account field (for the dashboards) and assign it a friendly name to identify the corresponding AWS account.
- For the AWS Access Key and AWS Secret Key, provide the IAM User access key and secret key you want to use to authenticate collection requests. Make sure your IAM user has the following IAM policy attached with it.
{
    "Version": "2012-10-17",
    "Statement": [
        {
            "Sid": "VisualEditor0",
            "Effect": "Allow",
            "Action": [
                "ce:Describe*",
                "ce:Get*",
                "ce:List*",
                "ec2:DescribeRegions"
            ],
            "Resource": "*"
        }
    ]
}
- For the Enable Regions field, provide the regions which need to be monitored for cost. The cost incurred across these regions will be fetched separately. The region list here includes all the standard AWS regions along with “global”. “Global” region includes services like Amazon CloudFront, Amazon Route 53, and Amazon IAM. If the field is left empty (default behavior), then data will be fetched from all the enabled regions of the respective AWS account. It is recommended to provide only the regions which are actively used and need to be monitored for cost. This will save the AWS cost for running this source on unused regions.
- For the Cost Type, provide supported cost types / MetricTypes. For details on the CostType, see Amazon's Understanding your AWS Cost Datasets: A Cheat Sheet.
- AmortizedCost
- BlendedCost
- NetAmortizedCost
- NetUnblendedCost
- UnblendedCost
- For Granularity, provide 2 supported granularities for each of the MetricTypes (or cost types):
- Daily Costs (Polled every 12h)
- Monthly Costs (Polled every day)
- Add Processing Rules.
- Click Submit when complete.
Installing the AWS Cost Explorer App
Now that you have set up a collection for AWS Cost Explorer, install the Sumo Logic App to use the pre-configured dashboards that provide visibility into your environment for real-time analysis of overall usage.
- Locate and install the app you need from the App Catalog. If you want to see a preview of the dashboards included with the app before installing, click Preview Dashboards.
- From the App Catalog, search for AWS Cost Explorer and select the app.
- To install the app, click Add to Library and complete the following fields.
- App Name. You can retain the existing name, or enter a name of your choice for the app.
- Advanced. Select the Location in the Library (the default is the Personal folder in the library), or click New Folder to add a new folder.
- Click Add to Library.
Once an app is installed, it will appear in your Personal folder, or another folder that you've specified. From here, you can share it with your organization.
Panels will start to fill automatically. It's important to note that each panel slowly fills with data matching the time range query and received since the panel was created. Results won't immediately be available, but with a bit of time, you'll see full graphs and maps.
Viewing AWS Cost Explorer Dashboards
This section provides examples and descriptions for each of the AWS Cost Explorer pre-configured dashboards.
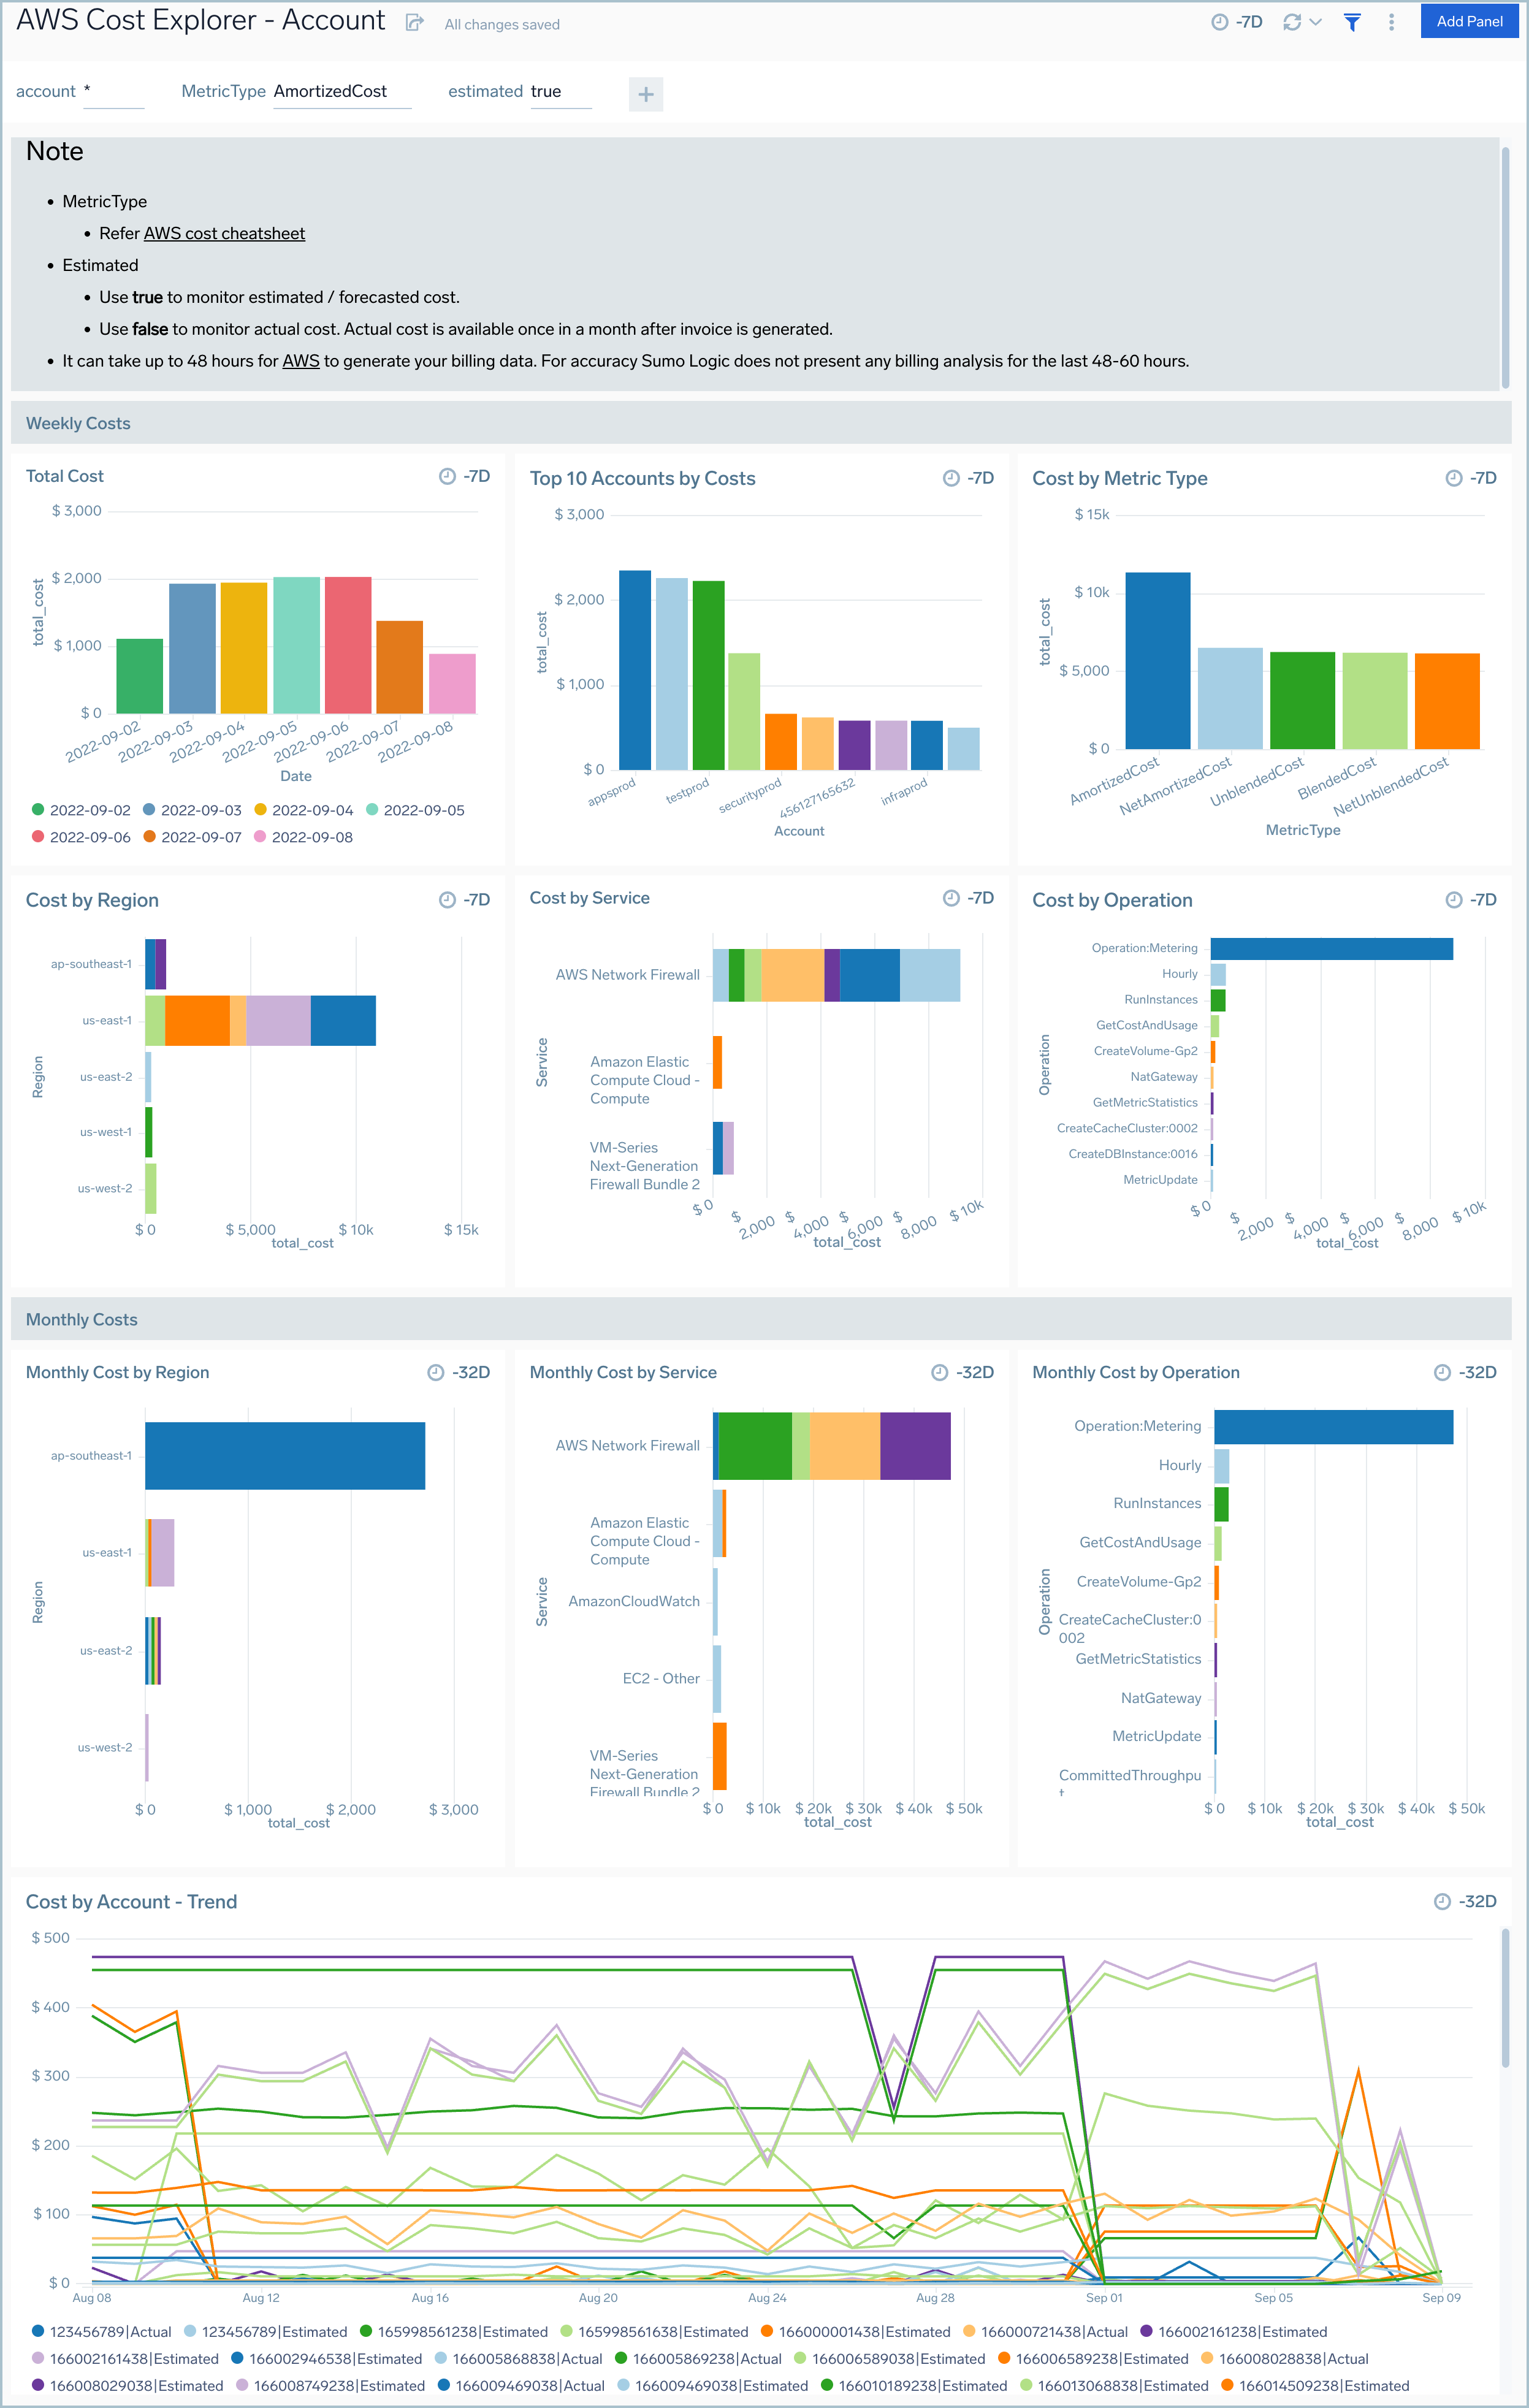
Account
AWS Cost Explorer - Account dashboard provides detailed information about cost and usage by different AWS accounts.
Use this dashboard to:
- Monitor and visualize the costs and usage associated with your top cost-accruing AWS accounts detailed breakdown on all AWS accounts
- Gain a better understanding of your cost trends.
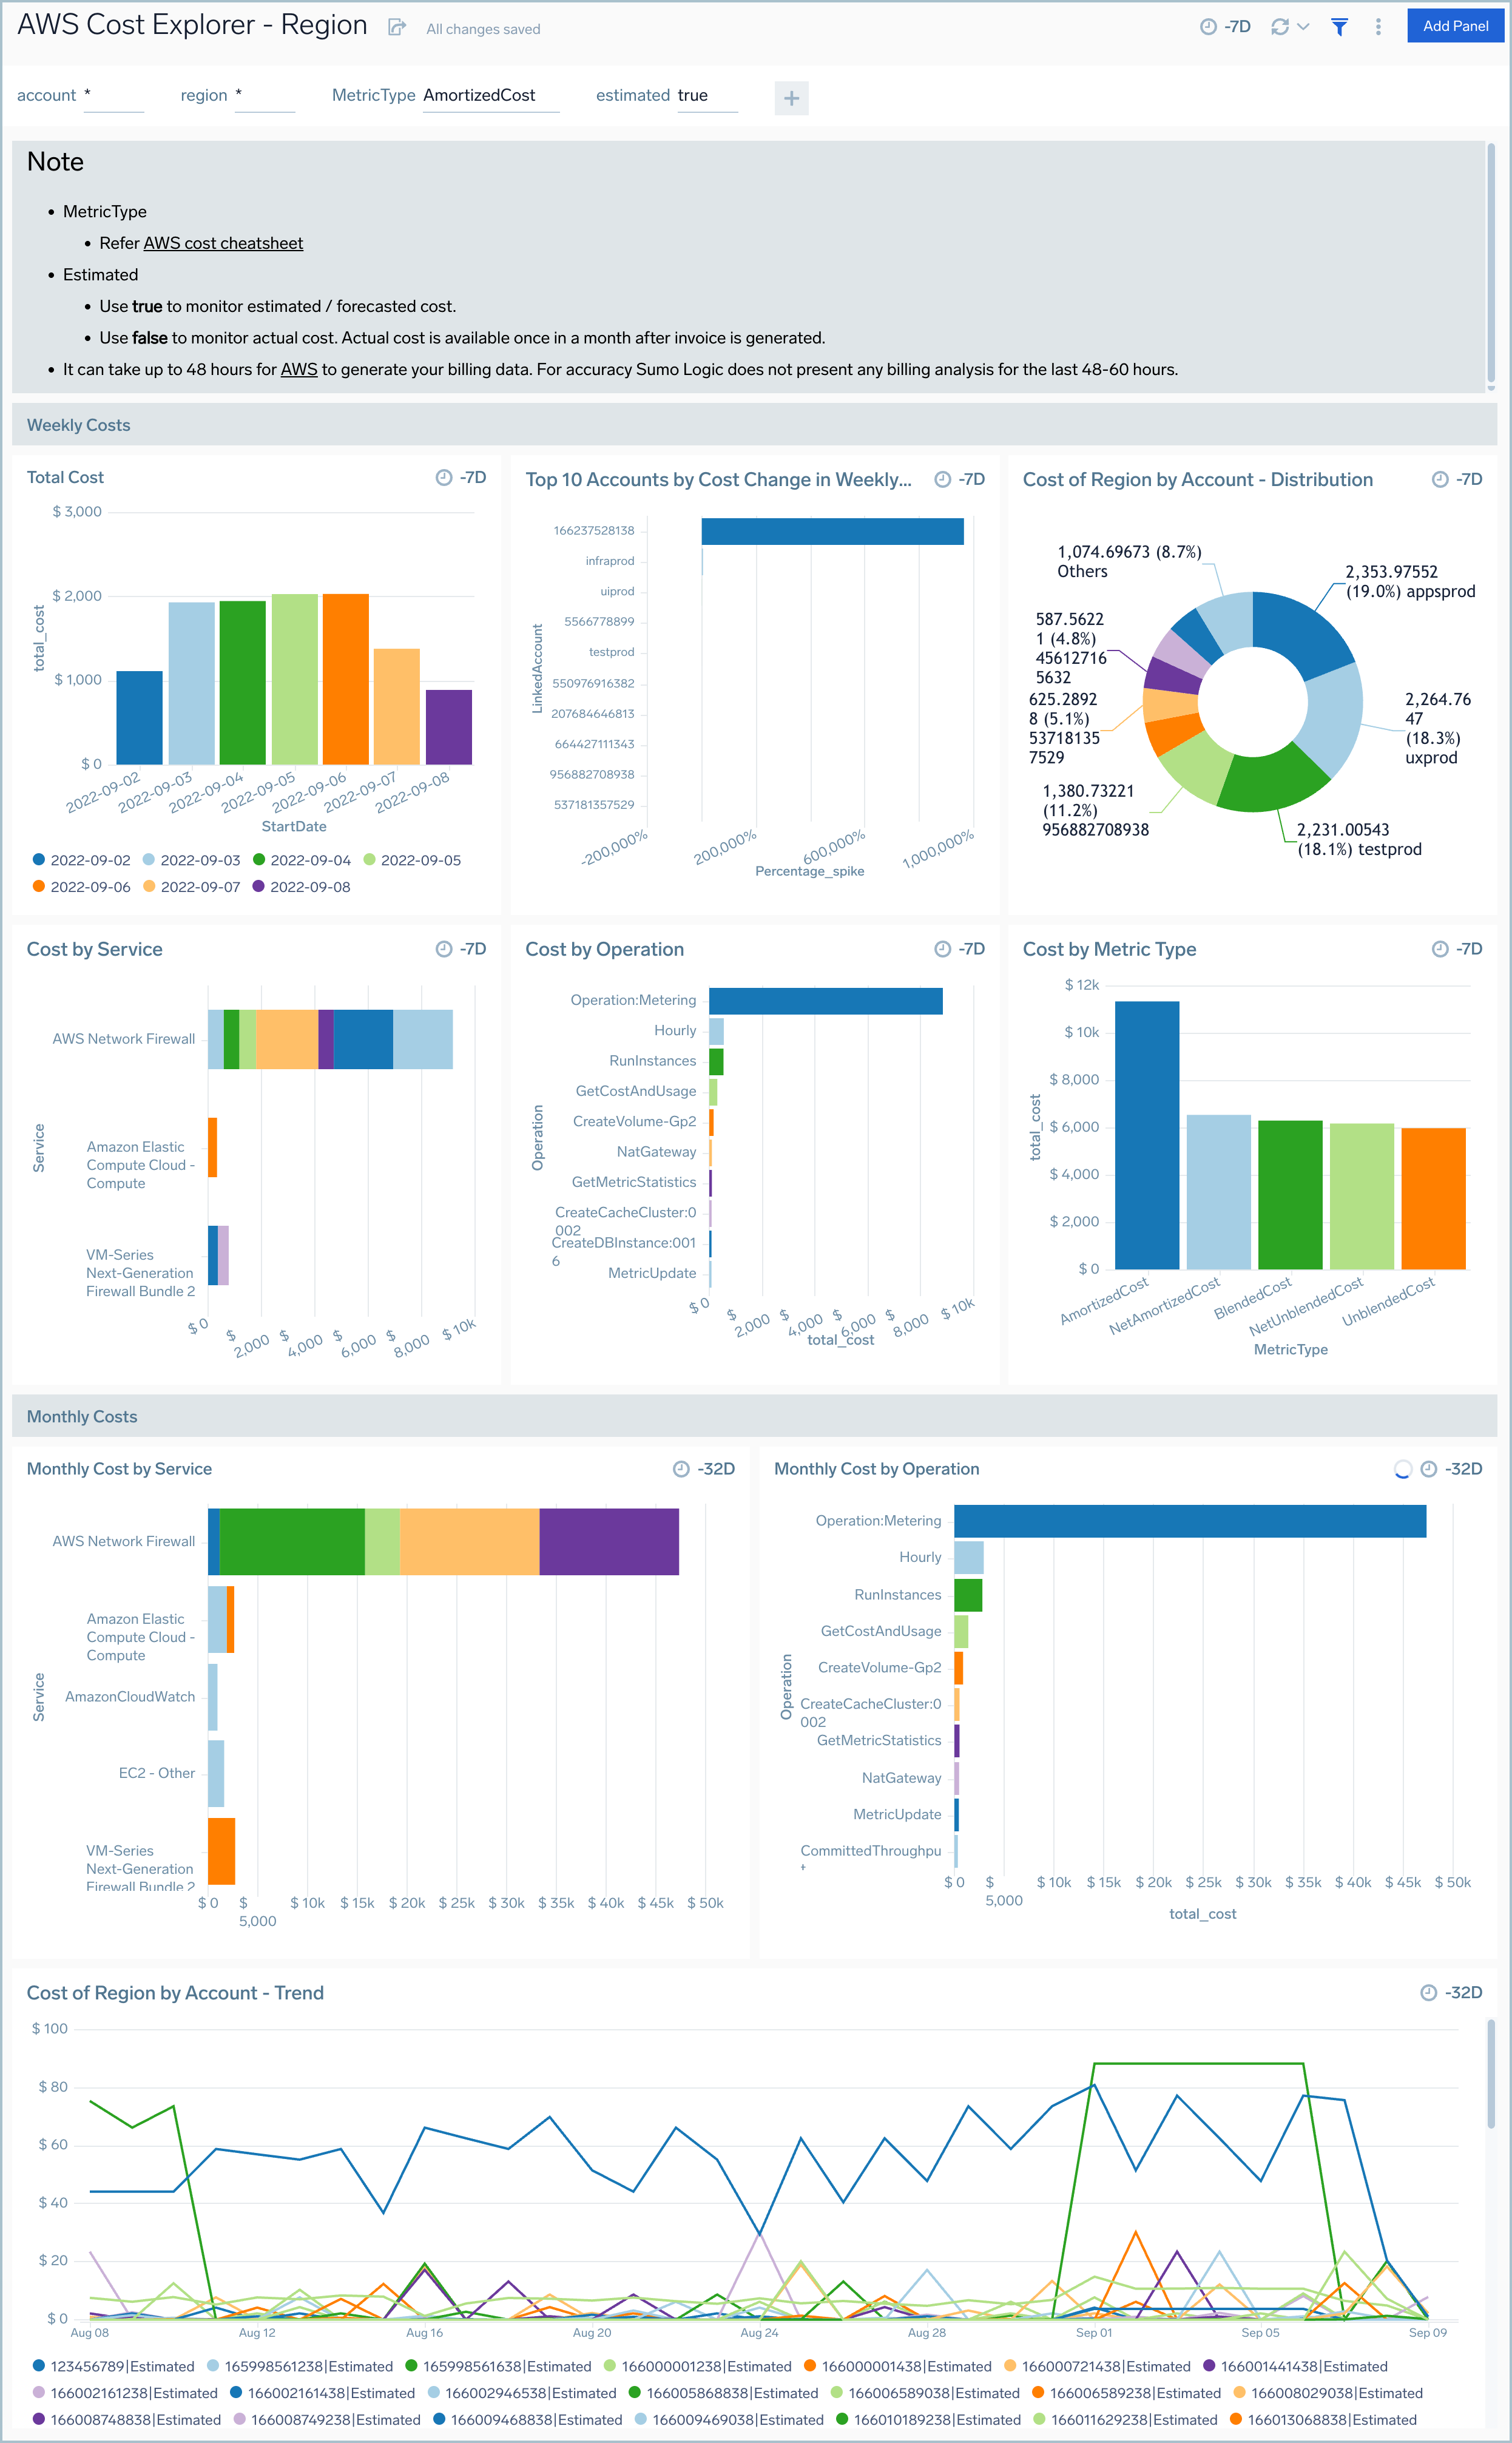
Region
AWS Cost Explorer - Region dashboard provides detailed information about cost and usage by different AWS Regions within AWS accounts.
Use this dashboard to:
- Monitor and visualize the costs and usage associated with your top cost-accruing AWS regions across different AWS accounts with detailed breakdown on all AWS accounts / regions
- Gain a better understanding of your cost trends.
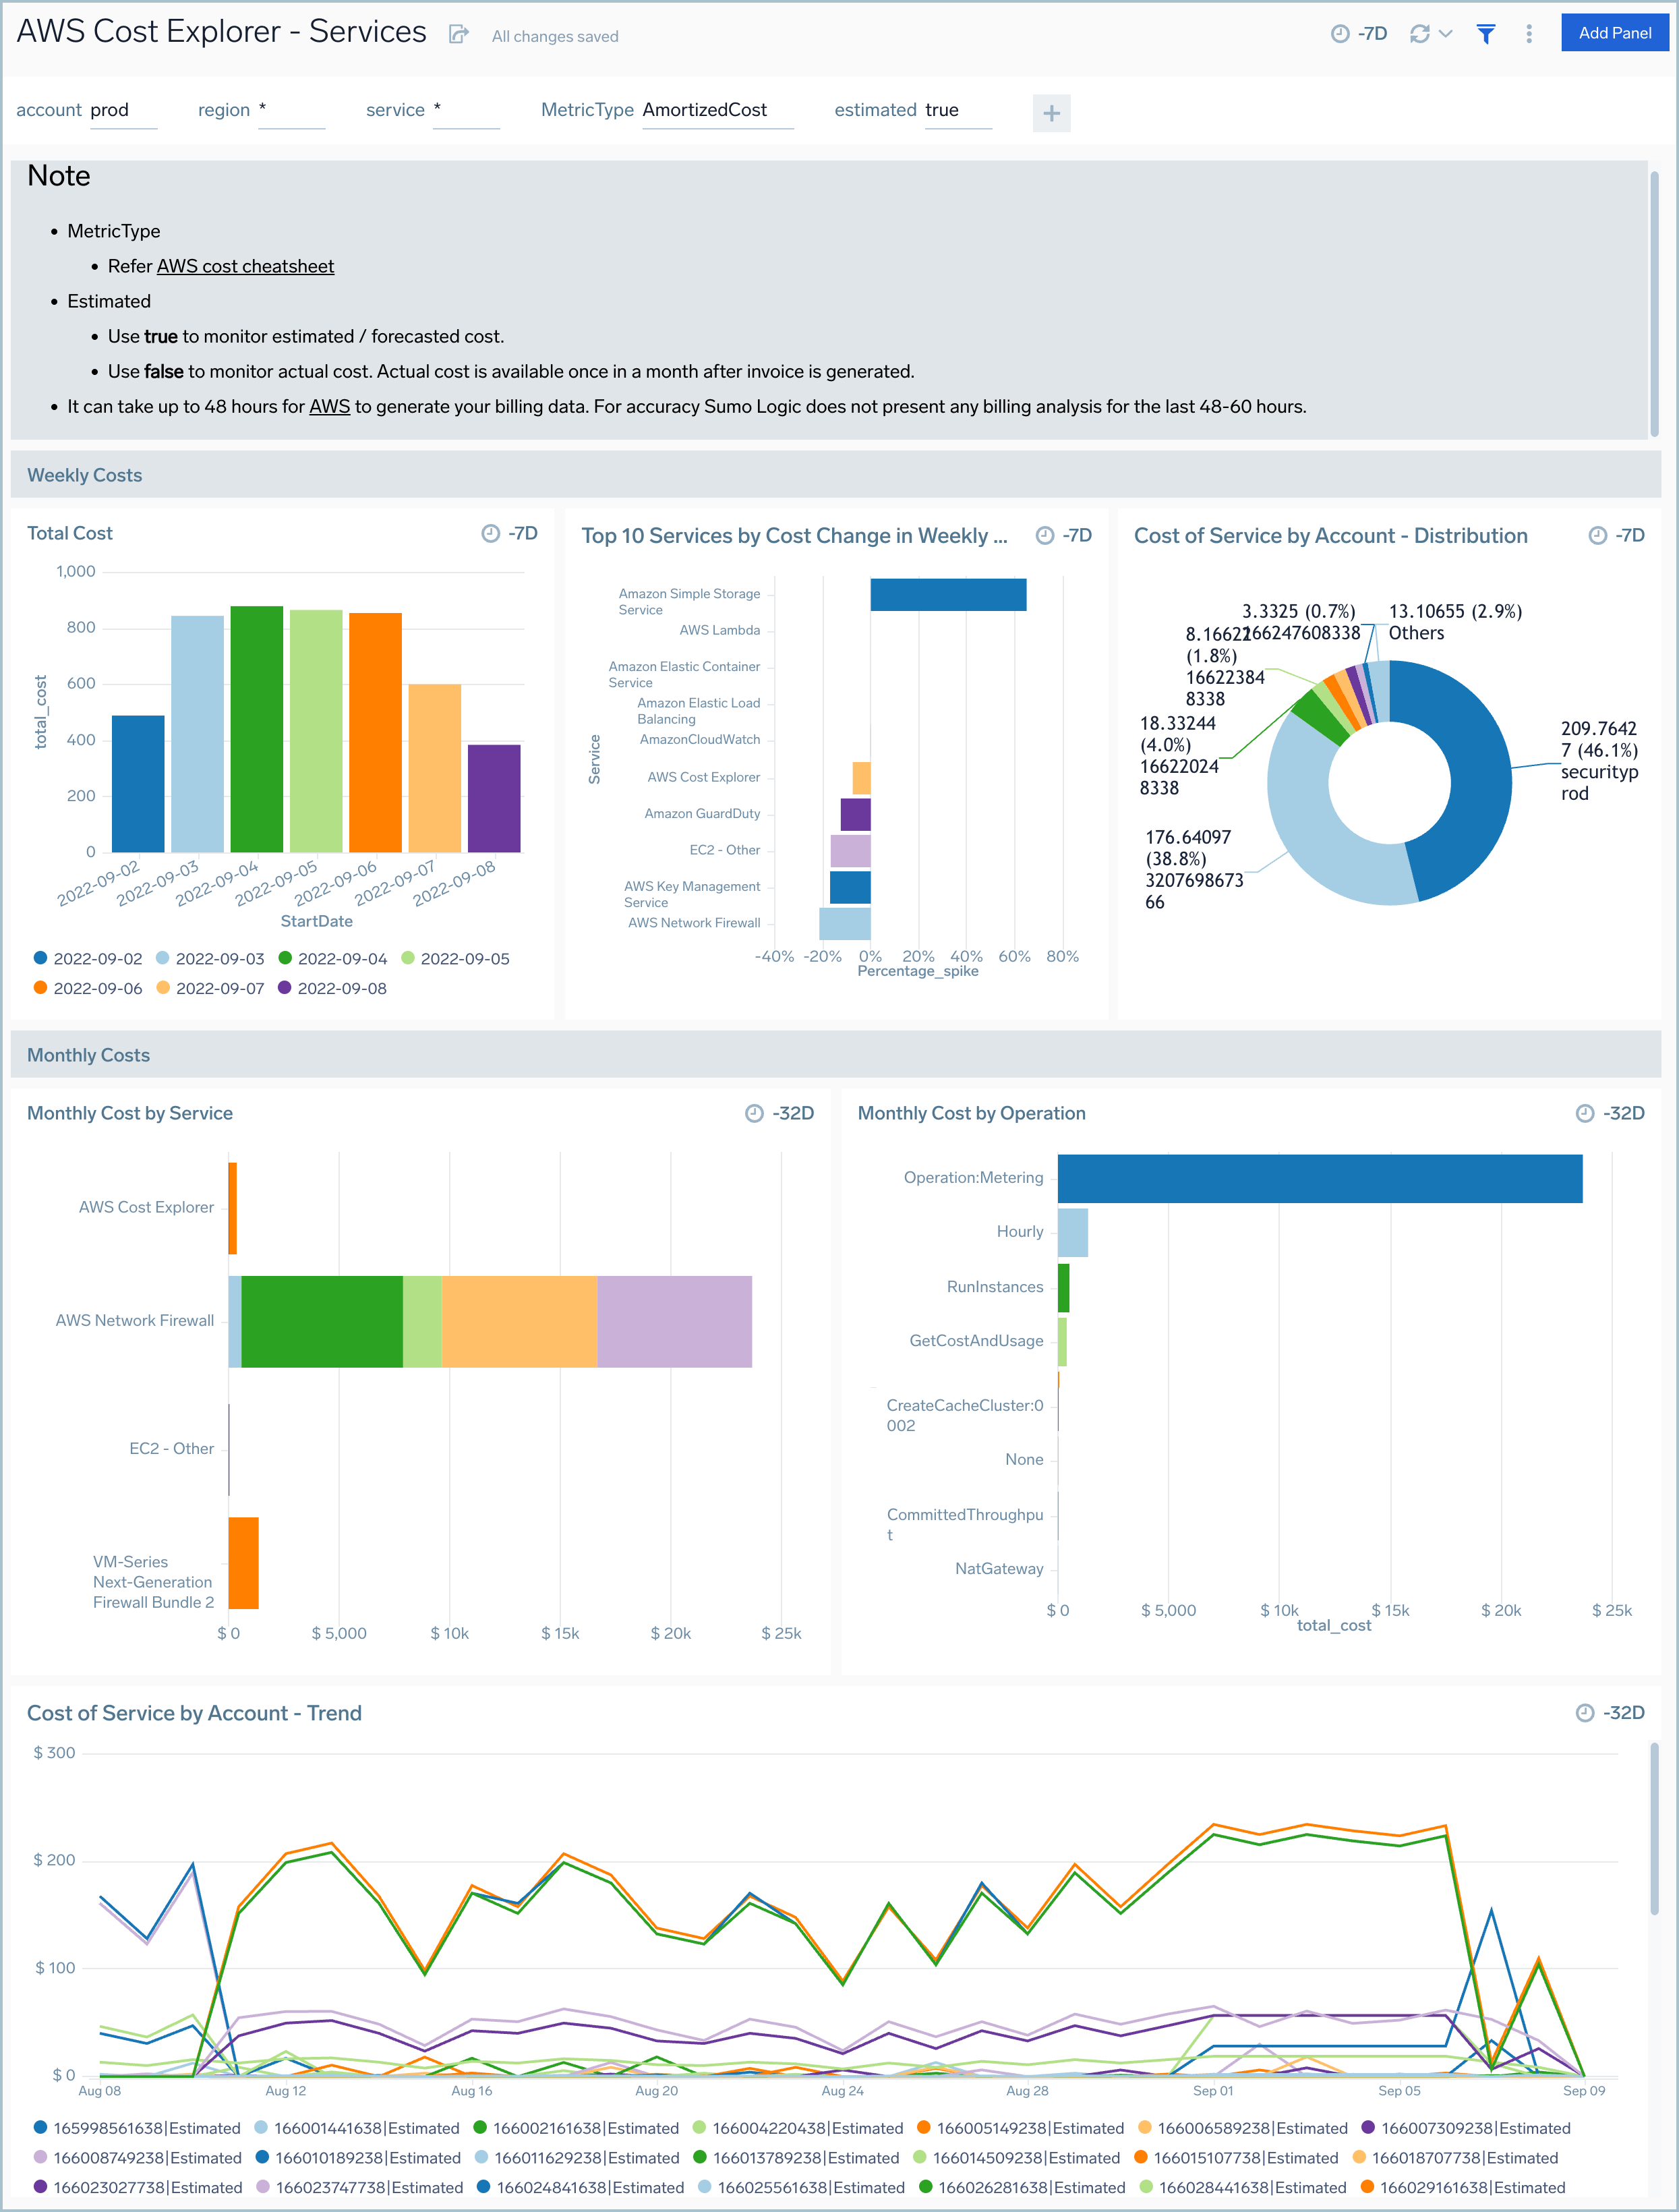
Services
AWS Cost Explorer - Services dashboard provides detailed information about cost and usage by operations performed by various Services in AWS accounts.
Use this dashboard to:
- Monitor and visualize the costs and usage associated with your top cost-accruing AWS services with detailed breakdown on all AWS services
- Gain a better understanding of your cost trends.
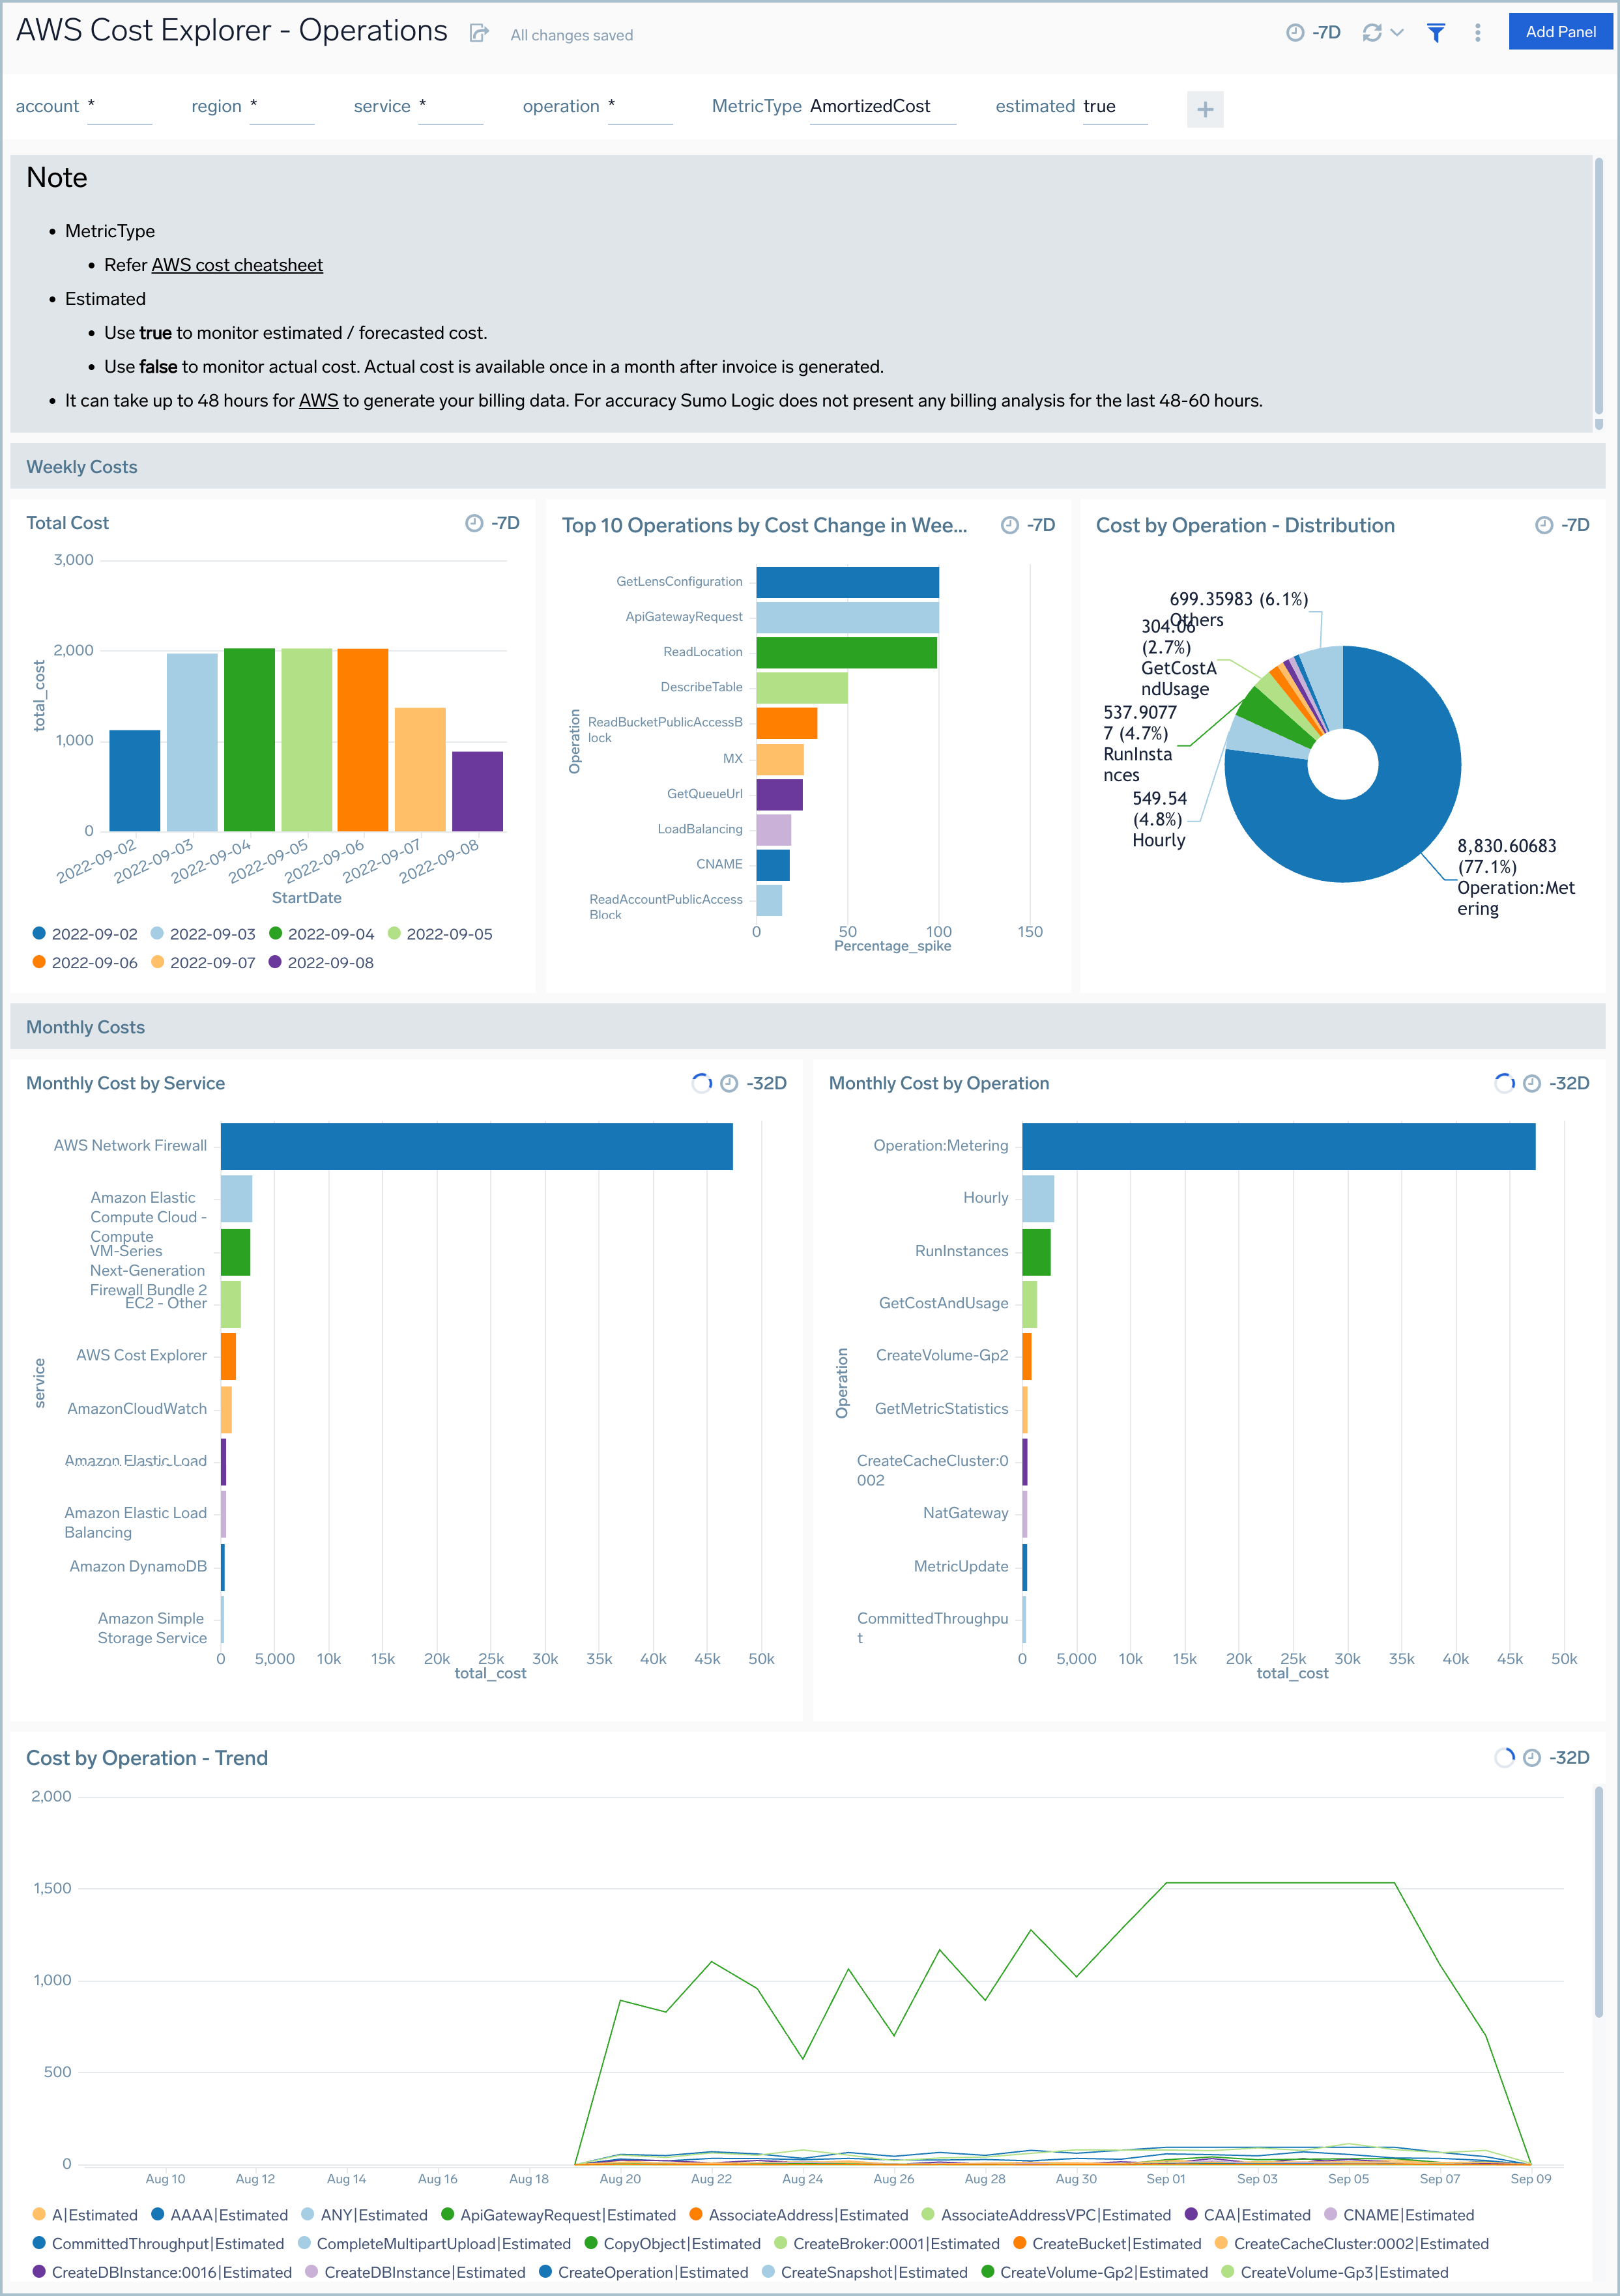
Operations
AWS Cost Explorer - Operations dashboard provides detailed information about cost and usage by operations performed by various Services in AWS accounts.
Use this dashboard to:
- Monitor and visualize the costs and usage associated with your top cost-accruing operations performed on various AWS services with detailed breakdown on all operations across various AWS services
- Gain a better understanding of your cost trends.