Amazon Inspector

Amazon Inspector is an automated vulnerability management service that continually scans Amazon EC2 and container images for software vulnerabilities and network exposures. The Sumo Logic Inspector App helps reveal trends and identify anomalies from these findings.
For information about integrating Amazon Inspector with Security Hub, see Integration with AWS Security Hub in Amazon help.
Collecting Findings for the Amazon Inspector App
Sumo Logic provides a serverless solution for creating a CloudWatch events rule and a Lambda function (SecurityHubCollector) to extract findings from AWS Security Hub.
Findings from AWS services (AWS Security Hub) are delivered to CloudWatch Events as events in near real time. The Lambda function parses those events and sends them to an S3 bucket. Sumo Logic then collects the findings data using an S3 bucket source on a Sumo Logic hosted collector. The Lambda function setup is defined using Serverless Application Model (SAM) specifications and is published in AWS Serverless Application Repository.
You don't have to manually create the AWS resources. Simply deploy the solution, as described in the Step 2: Deploy an AWS Security Hub App collector.
Step 1: Add a hosted collector and AWS S3 source
This section demonstrates how to add a hosted Sumo Logic collector and AWS source, to collect events for the AWS Security Hub App.
Prerequisites
An AWS Source must be associated with a Sumo Logic Hosted Collector. Before creating the S3 source, identify the Sumo Logic Hosted Collector you want to use, or create a new Hosted Collector as described in the following task.
To add a hosted collector and AWS S3 source:
- Grant Access to an AWS S3 Bucket.
- To create a new Sumo Logic Hosted Collector, perform the steps in Configure a Hosted Collector
- Add an AWS Source for the S3 Source to Sumo Logic, and in Advanced Options for Logs, under Timestamp Format, click Specify a format and enter the following:
- Specify Format as
yyyy-MM-dd'T'HH:mm:ss.SSS'Z' - Specify Timestamp locator as
.*"UpdatedAt":"(.*)".* - Click Add.
- Specify Format as
Step 2: Deploy an AWS Security Hub App collector
The AWS Security Hub App collector transforms the received events and sends them to Sumo Logic. The AWS Security Hub App displays the results in pre-defined visual dashboards for you to analyze.
To deploy an AWS Security Hub App collector:
- Open a browser window and enter the following URL: https://serverlessrepo.aws.amazon.com/applications
- In the Serverless Application Repository, search for sumologic.
- Select Show apps that create custom IAM roles or resource policies check box.
- Click the sumologic-securityhub-collector link, and then click Deploy.
- In the AWS Lambda > Functions > Application Settings panel, enter the name of the S3SourceBucketName for the bucket you configured (when you defined the S3 source).
- Scroll to the bottom of the window and click Deploy.
Sample Log Message
{
  "SchemaVersion": "2018-10-08",
  "ProductArn": "arn:aws:securityhub:us-west- 2:123456789012:provider:private/default",
  "AwsAccountId": "123456789012",
  "Id": "test_finding_123456",
  "GeneratorId": "TestDetector",
  "Types": [
    "Software and Configuration Checks/Vulnerabilities/CVE"
  ],
  "CreatedAt": "2018-11- 06T13:22:13.933Z",
  "UpdatedAt": "2018-11-07T14:22:13.933Z",
  "Severity": {
    "Product": 10,
    "Normalized": 30
  },
  "Title": "Unprotected port 22 found on instance i-01234567890abcefb",
  "Description": "Test finding was found on instance i- 01234567890afbcefa",
  "Resources": [
    {
      "Type": "AwsEc2::Instance",
      "Id": "arn:aws:ec2:us-west-2: 123456789012:instance:i- 01234567890abcefa"
    }
  ],
  "SourceUrl": "http://myfp.com/recommendations/dangerous_things_and_how_to_fix_them",
  "Process": {
    "Name": "My Process",
    "Path": "/Process/Path"
  },
  "RecordState": "ACTIVE",
  "Note": {
    "Text": "User1 will address this finding",
    "UpdatedBy": "User1",
    "UpdatedAt": "2018-11-03T13:22:13.933Z"
  }
}
Sample Query
(_sourceCategory="securityhub_findings" OR _sourceCategory="Labs/AWS/SecurityHub")
| json  "AwsAccountId", "Id", "GeneratorId", "ProductArn", "CreatedAt", "UpdatedAt", "Resources",
 "Severity.Normalized", "SourceUrl",
"Types", "Compliance.Status" as aws_account_id, finding_id, generator_id, product_arn, created_at,
 updated_at, resources, severity_normalized, sourceurl, finding_types, compliance_status nodrop
| parse regex field=finding_types "\"(?<finding_type>.*?)\"" multi
| parse regex field=resources "\"Type\":\"(?<resource_type>.*?)\"" multi
| parse regex field=resources "\"Id\":\"(?<resource_id>.*?)\"" multi
| parse regex field=product_arn "product/(?<finding_provider>.*?)$"
| min(severity_normalized), pct(severity_normalized,25), pct(severity_normalized,50), pct(severity_normalized,75),
  max(severity_normalized) by resource_type
Installing the Amazon Inspector App
Once you've set up ingestion of findings from AWS Security Hub, you can install the Sumo Logic app for Amazon Inspector and use the pre-configured searches and Dashboards.
To install the Sumo Logic App for Amazon Inspector:
- From the App Catalog, search for and select the app.
- You're prompt to select an application version. Select Amazon Inspector, and click Add to Library.
- To install the app, complete the following fields.
- App Name. You can retain the existing name, or enter a name of your choice for the app.
- Choose Source Category, and select a source category from the list.
- Choose Enter a Custom Data Filter, and enter a custom data filter.
- Advanced. Select the Location in Library (the default is the Personal folder in the library), or click New Folder to add a new folder.
- App Name. You can retain the existing name, or enter a name of your choice for the app.
- Click Add to Library.
Once an app is installed, it will appear in your Personal folder, or another folder that you specified. From here, you can share it with your organization.
Panels will start to fill automatically. It's important to note that each panel slowly fills with data matching the time range query and received since the panel was created. Results won't immediately be available, but with a bit of time, you'll see full graphs and maps.
Viewing the Amazon Inspector Overview Dashboard
The dashboard has a set of filters that you can apply to the entire dashboard. Click the funnel icon in the top dashboard menu bar to display a scrollable list of filters that narrow search results across the entire dashboard. You can filter by AWS account ID, finding ID, finding type, normalized severity, and title.
The dashboard provides an overview of Security Hub findings broken down by severity.
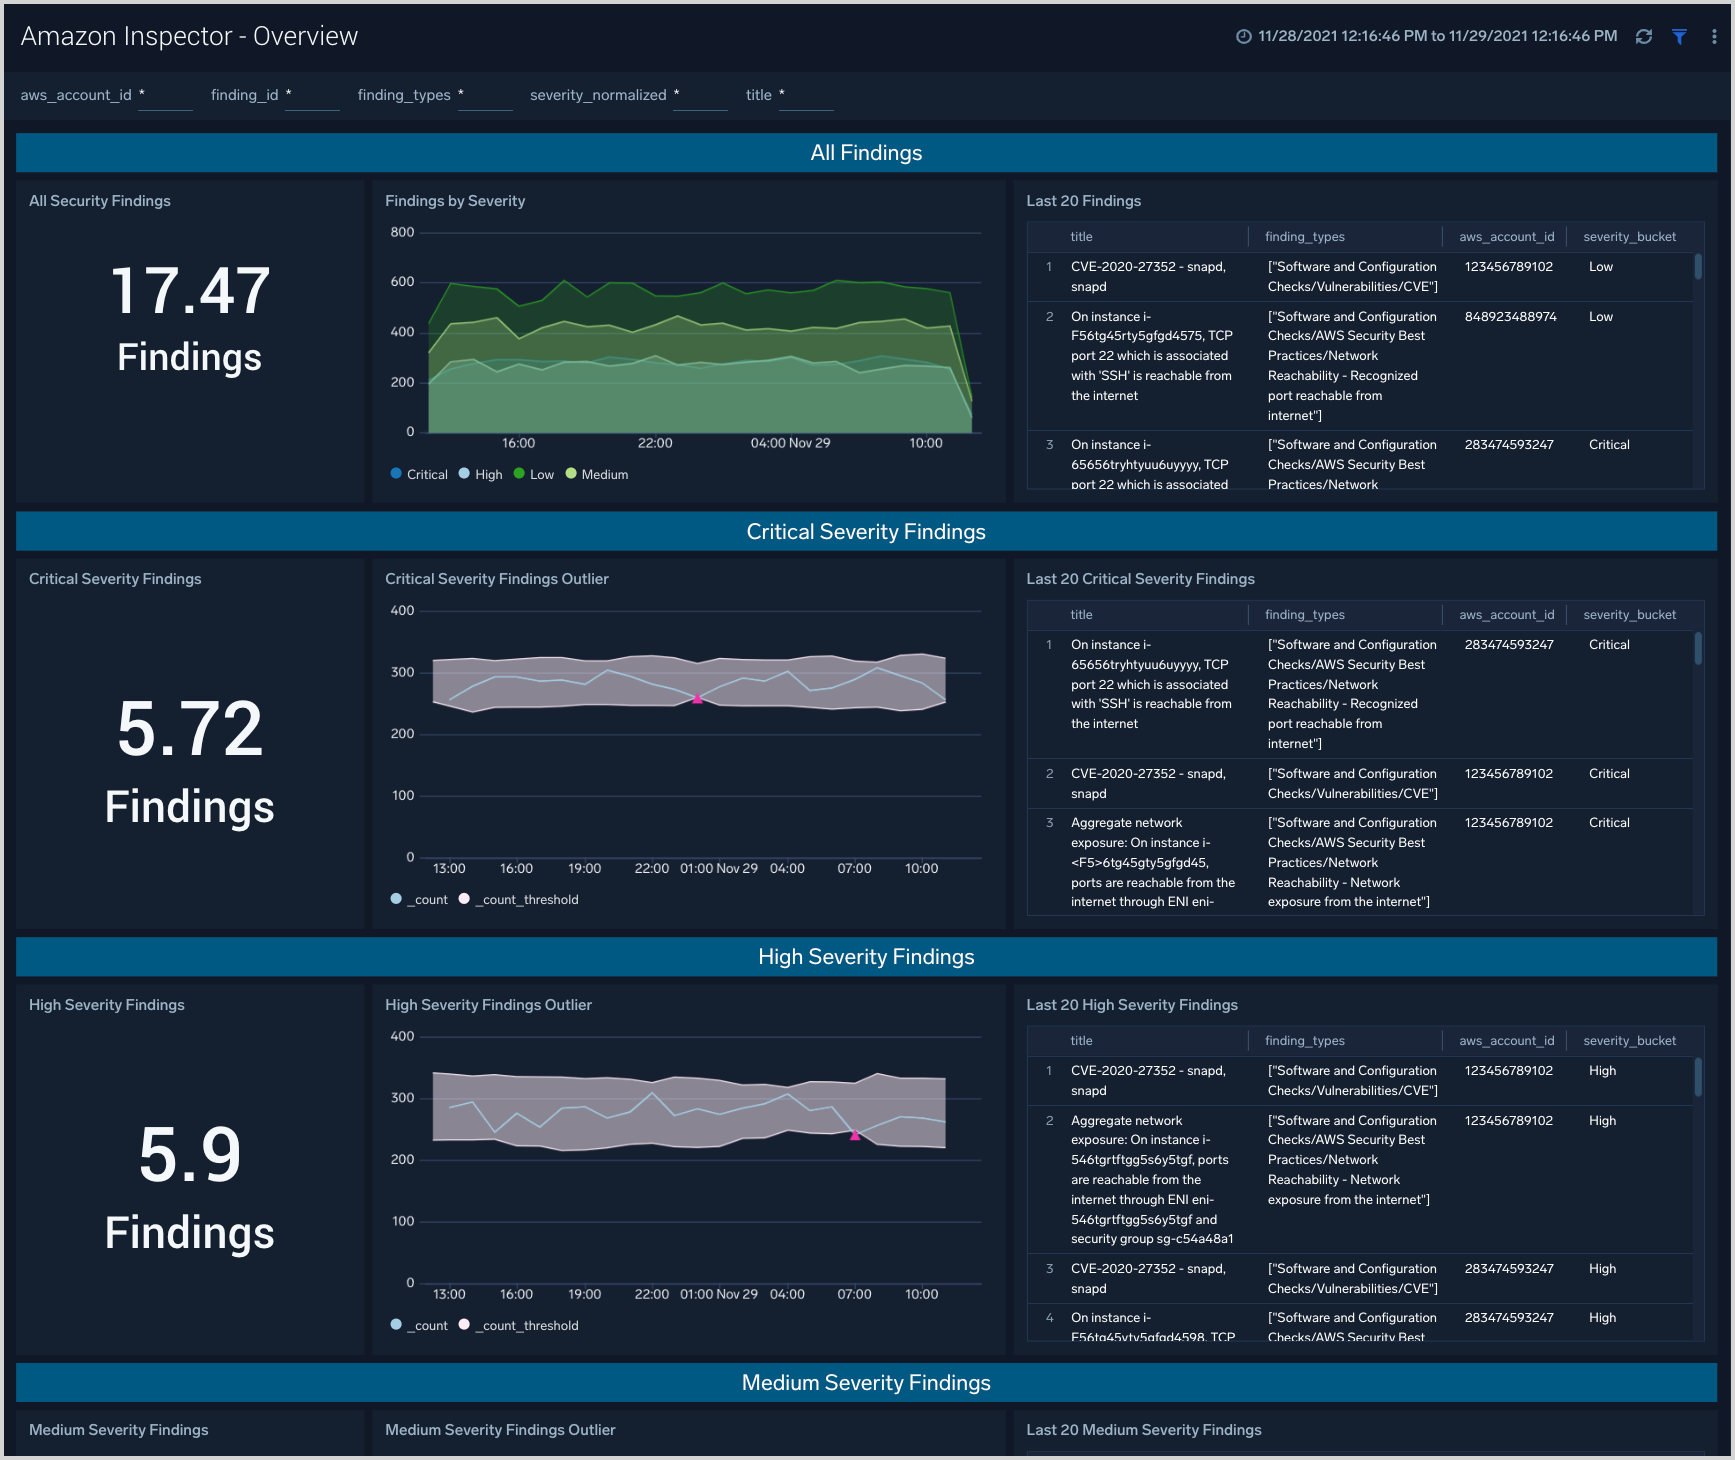
Findings Summary
The top panel of the dashboard presents:
- All Findings. The count of total security findings during the last 24 hours by default, or during the currently selected time range.
- Findings by Severity. A stacked line chart showing the count of findings by severity, during the last 24 hours by default, or during the currently selected time range.
- Last 20 Findings. A table detailing the 20 most recent findings.
Critical, high, medium, low severity findings
The other panels on the dashboard, for Critical, High, Medium, and Low Severity findings, have similar content. The only difference is they each are filtered by the listed severity level.
- Severity Findings. The count of findings at this severity during the last 24 hours by default, or during the currently selected time range.
- Severity Outliers. Shows the trending volume of findings at this severity level during the last 24 hours by default, or during the currently selected time range. The gray shaded area corresponds to 3 standard deviations of the past 10 mean values. Pink triangles show values that exceed that threshold and are likely points of investigation considering the large change in volume of findings.
- Last 20 Severity Findings. A table detailing the 20 most recent findings at this severity level.