AWS Network Load Balancer
AWS Network Load Balancer service is distributed in OSI Layer 4 (the network layer) traffic (TCP, UDP, TLS) and can handle over a million requests per second.
The Sumo Logic App for AWS Network Load Balancer is using metrics to provide insights to ensure that your network load-balancers are operating as expected, backend hosts are healthy, and to quickly identify errors.
Log and Metric Types
The AWS Network Load Balancer app uses AWS Network Load Balancer metrics.
Sample Query
account=* region=* LoadBalancer=* Namespace=aws/NetworkELB metric=ActiveFlowCount Statistic=Sum | sum by account, region, namespace, LoadBalancer
Collecting Metrics for AWS Network Load Balancer App
Sumo Logic supports collecting metrics using two source types:
- Configure an AWS Kinesis Firehose for Metrics Source (Recommended); or
- Configure an Amazon CloudWatch Source for Metrics
Namespace for Amazon Network Load Balancer Service is AWS/NetworkELB.
- Metadata: Add an account field to the source and assign it a value which is a friendly name / alias to your AWS account from which you are collecting metrics. This name will appear in the Sumo Logic Explorer View. Metrics can be queried via the “account field”.
Field in Field Schema
Login to Sumo Logic, go to Manage Data > Logs > Fields. Search for the “networkloadbalancer” field. If not present, create it. Learn how to create and manage fields here.
Metric Rules
Create the following Metric Rule for the AWS/NetworkELB namespace if not already created. Learn how to create a Metrics Rule here.
Rule name: AwsObservabilityNLBMetricsAddonEntityRule
Metric match expression: Namespace=AWS/NetworkELB LoadBalancer=*
Variable name: networkloadbalancer
Tag sequence: $LoadBalancer._1
Save it
Installing the AWS Network Load Balancer App
This section has instructions for installing the Sumo Logic App for AWS Network Load Balancer and descriptions of each of the app dashboards along with associated use cases.
Now that you have set up a collection for AWS Network Load Balancer, install the Sumo Logic App to use the pre-configured dashboards that provide visibility into your environment for real-time analysis of overall usage.
To install the app:
Locate and install the app you need from the App Catalog. If you want to see a preview of the dashboards included with the app before installing, click Preview Dashboards.
- From the App Catalog, search for “AWS Network Load Balancer” and select the app.
- To install the app, click Add to Library and complete the following fields.
- App Name. You can retain the existing name, or enter a name of your choice for the app.
- Advanced. Select the Location in Library (the default is the Personal folder in the library), or click New Folder to add a new folder.
- Click Add to Library.
Once an app is installed, it will appear in your Personal folder, or other folder that you specified. From here, you can share it with your organization.
Panels will start to fill automatically. It's important to note that each panel slowly fills with data matching the time range query and received since the panel was created. Results won't immediately be available, but with a bit of time, you'll see full graphs and maps.
Viewing AWS Network Load Balancer Dashboards
App description:
AWS Network Load Balancer service is distributed in OSI Layer 4 (i.e., network) traffic (e.g., TCP, UDP, TLS) and can handle over a million requests per second.
The Sumo Logic App for AWS Network Load Balancer is using metrics to provide insights to ensure that your network load-balancers are operating as expected, backend hosts are healthy and to quickly identify errors.
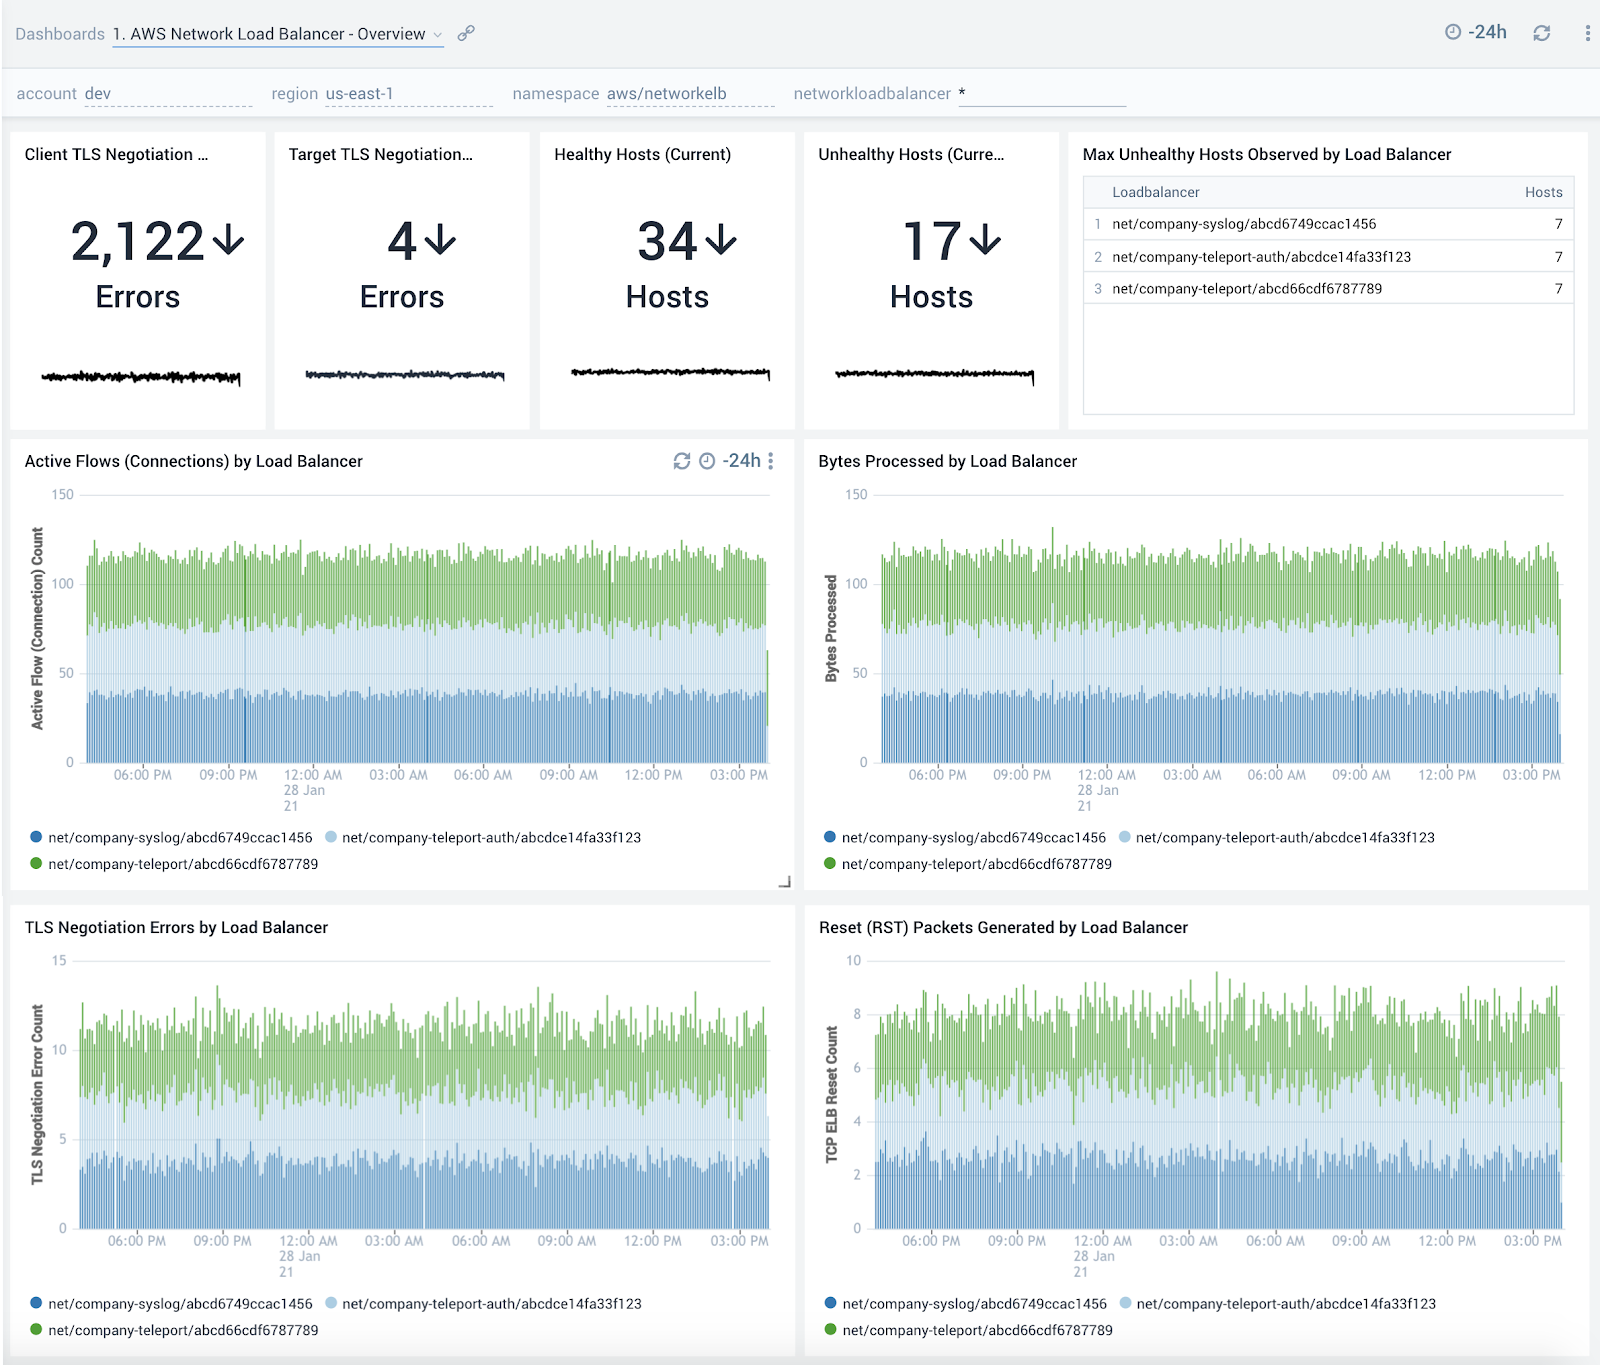
Overview
The AWS Network Load Balancer - Overview dashboard provides detailed insights into a view of network utilization and performance. The dashboard provides information about the errors, health, and traffic handled by the load balancer.
Use this dashboard to:
- Get an at-a-glance view of the number of errors and status of backend hosts.
- Identify load balancers with the most number of unhealthy hosts.
- Monitor trends around active connections, bytes processed, and reset packets to ensure load balancers are operating as expected.
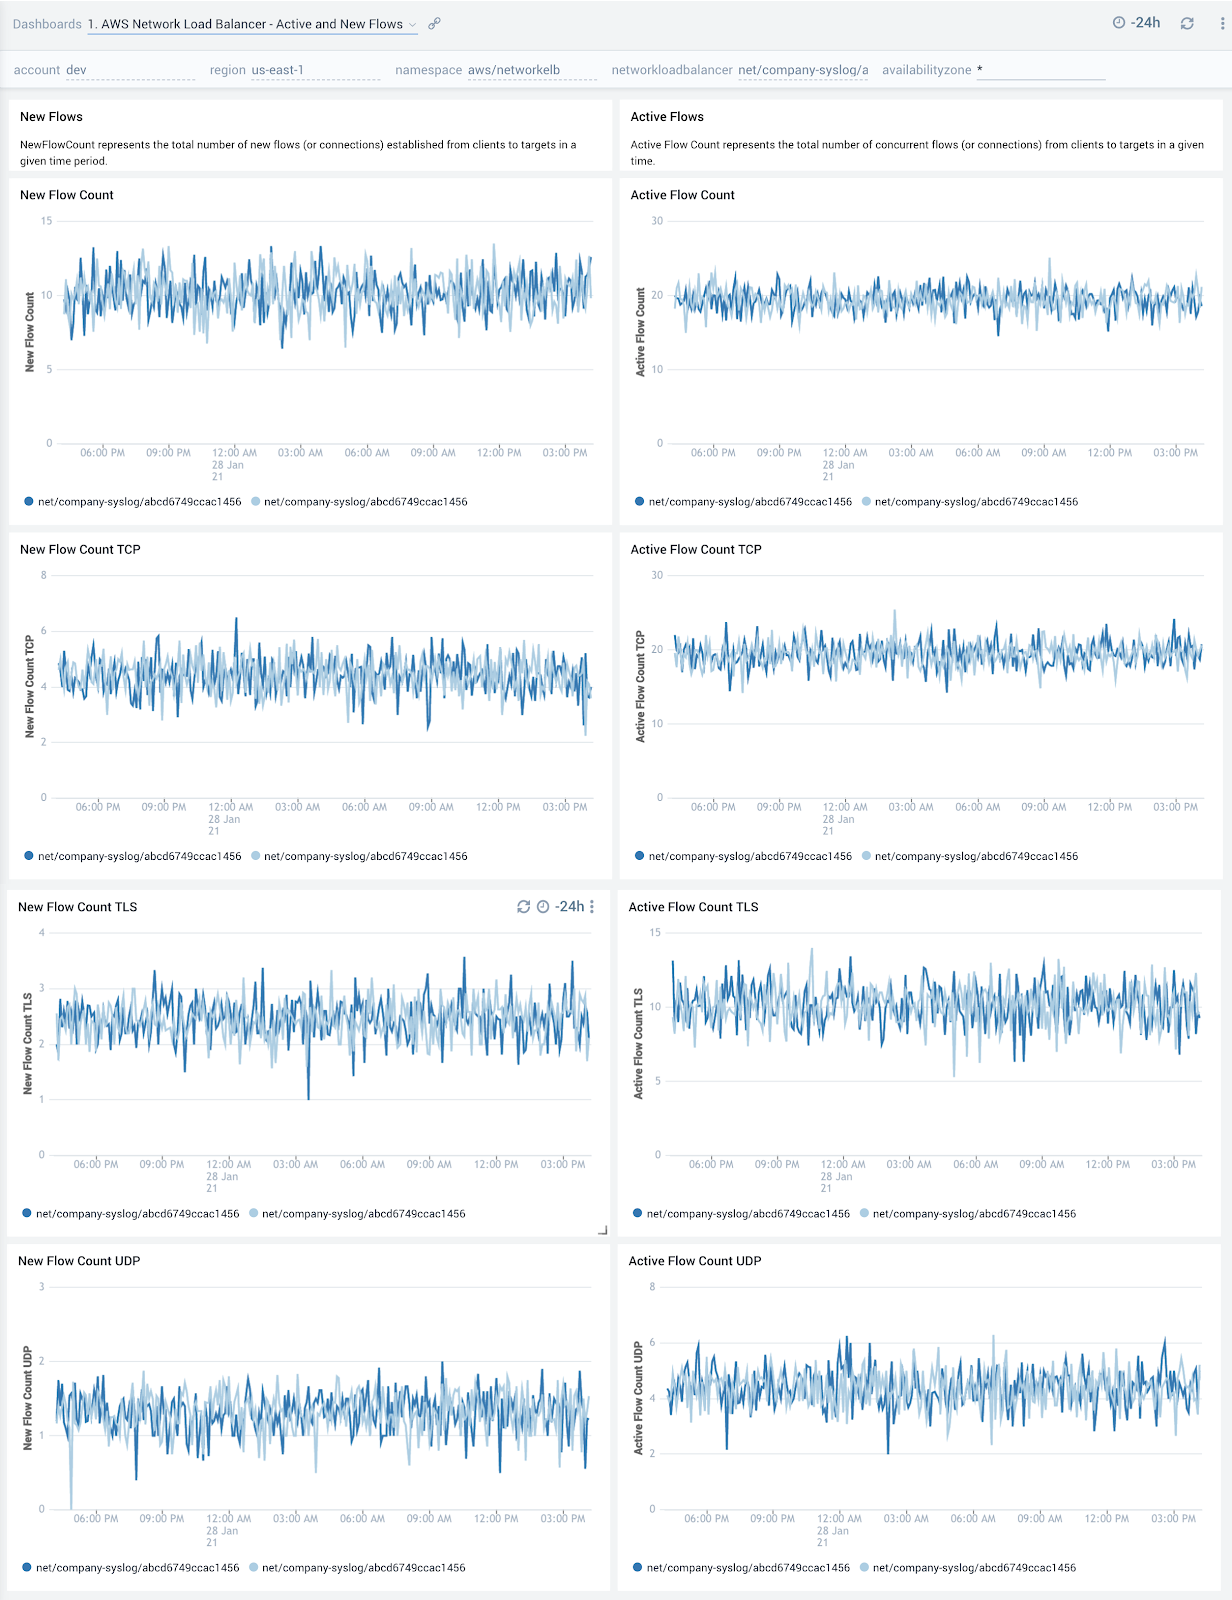
Active and New Flows
The AWS Network Load Balancer - Active and New Flows dashboard provides detailed insights for new flows, and active flows for TCP, TLS, and UDP traffic.
Use this dashboard to:
- Monitor trends around active and new flows (connections) to make sure they line up with expectations and then use that information to scale up/scale down backend hosts.
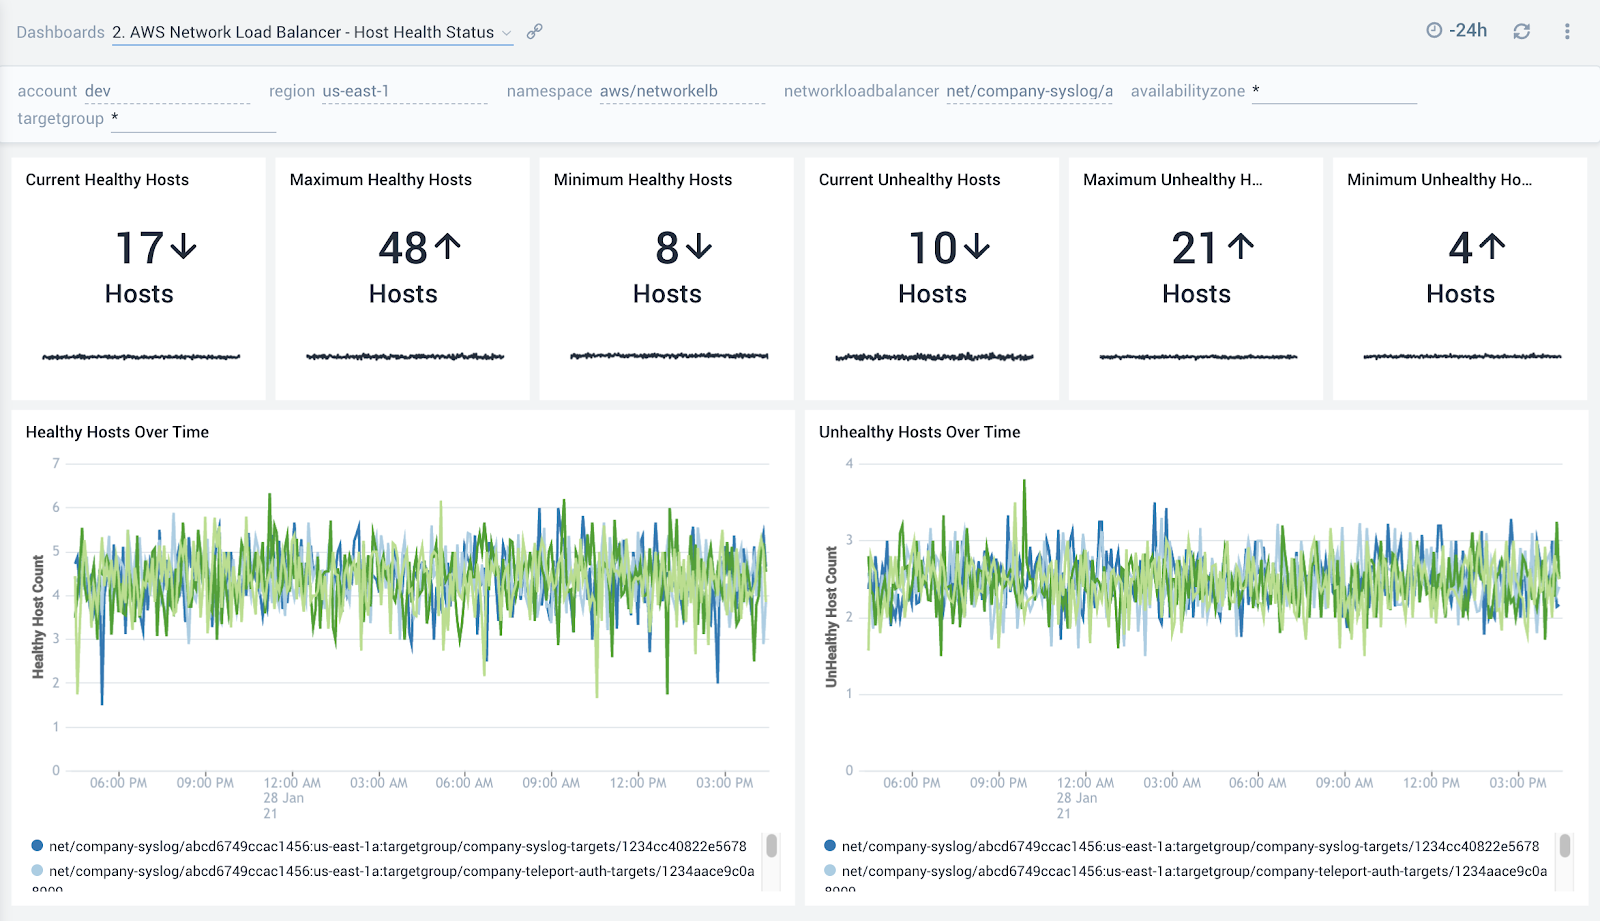
Host Health Status
The AWS Network Load Balancer - Host Health Status dashboard provides detailed insights into the number of healthy and unhealthy hosts.
Use this dashboard to:
- Get a quick overview of the number of healthy and unhealthy hosts.
- Monitor trends around the number of unhealthy hosts to spot potential service disruptions that could warrant deeper investigation.
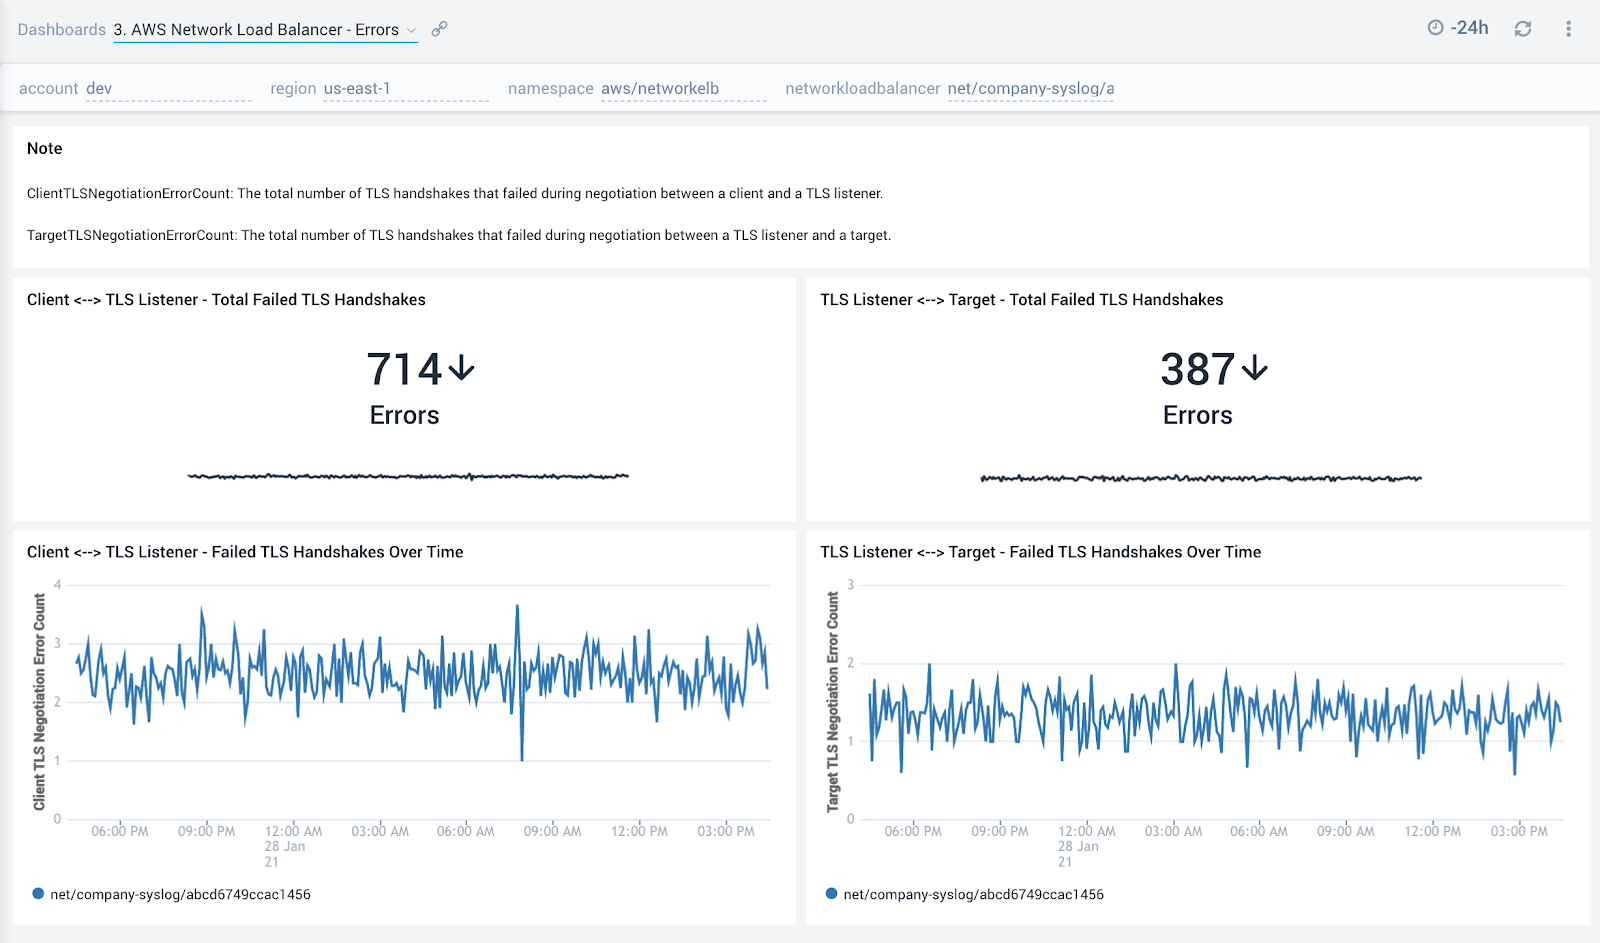
Errors
14
The AWS Network Load Balancer - Errors dashboard provides detailed insights into the errors reported by the network load balancer. This dashboard shows information for the total number of TLS handshakes that failed during negotiation between a client and a TLS listener, and the total number of TLS handshakes that failed during negotiation between a TLS listener and a target.
Use this dashboard to:
- Monitor TLS handshake errors during negotiation between a client and a TLS listener, which could happen if clients are sending an incorrect cipher or are using incorrect protocols not matching the one specified in the security policy. It’s recommended to use the most recent AWS CLI client version.
- Monitor TLS handshake errors during negotiation between a TLS listener and a target. Possible causes for this error include a mismatch of ciphers or protocols.
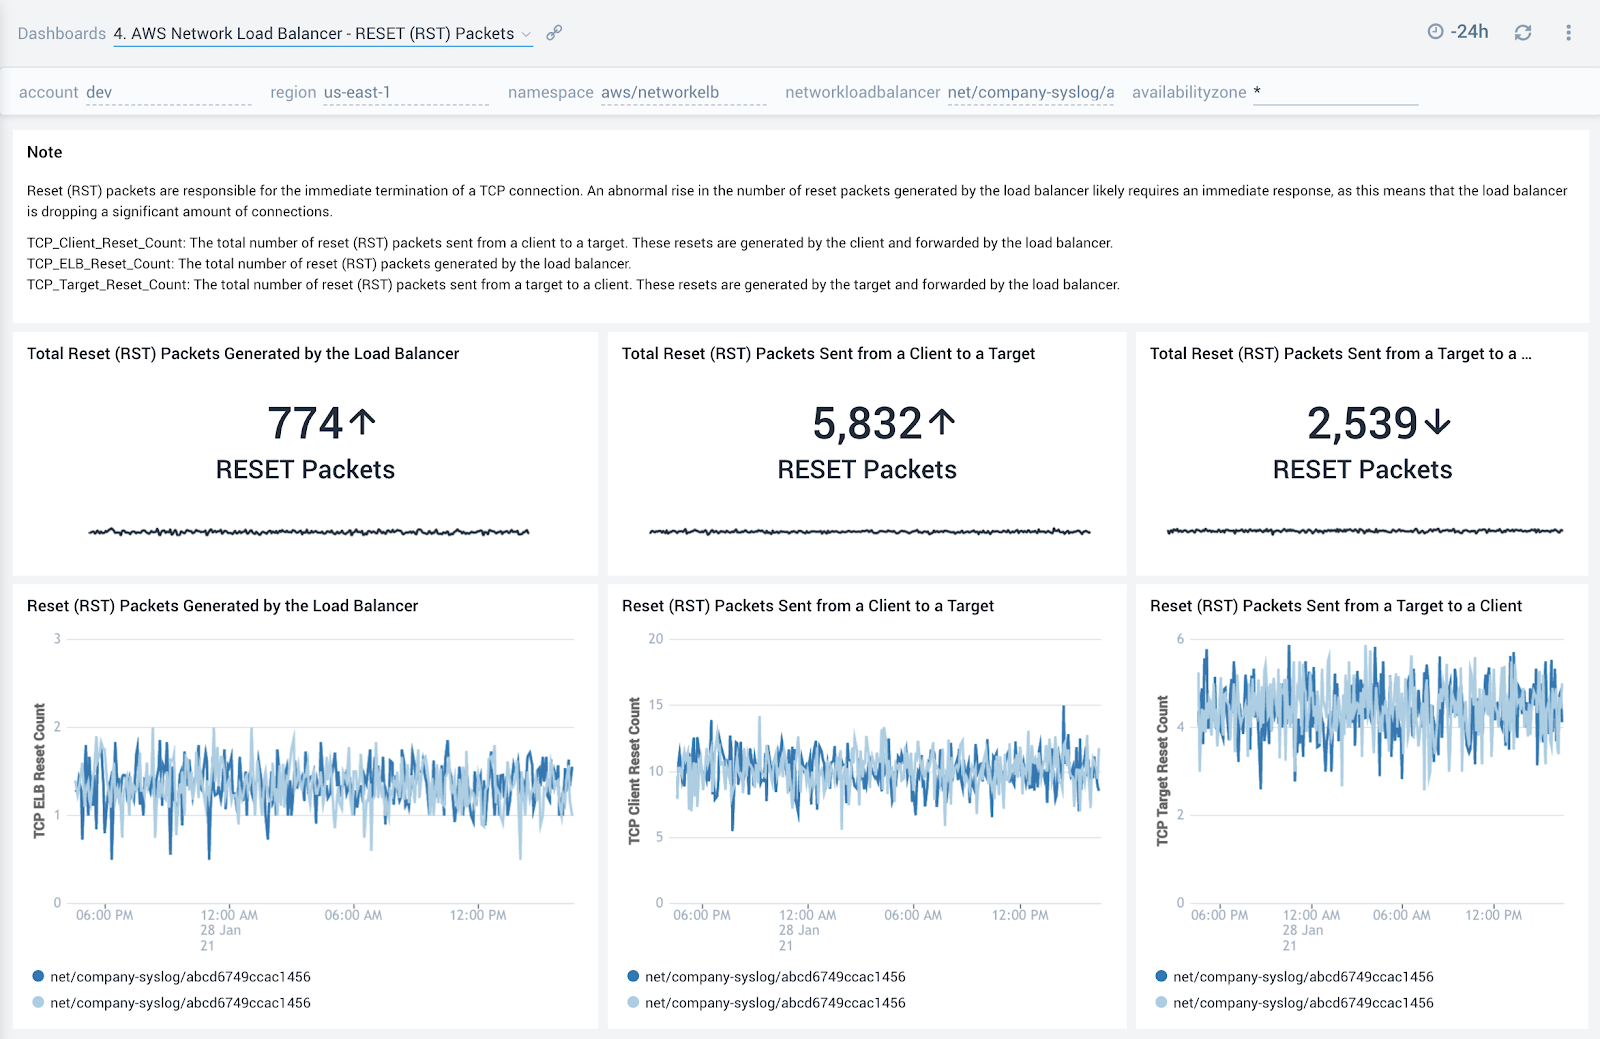
Reset (RST) Packets
The AWS Network Load Balancer - Reset (RST) Packets dashboard provides detailed insights into the number reset (RST) packets received by the network load balancer. The dashboard shows the information for the total number of reset (RST) packets sent from a client to a target , the total number of reset (RST) packets generated by the load balancer, and the total number of reset (RST) packets sent from a target to a client.
Use this dashboard to:
- To monitor the number of RST packets. A high number of reset packets could indicate connections are getting dropped and could mean a disruption in service.
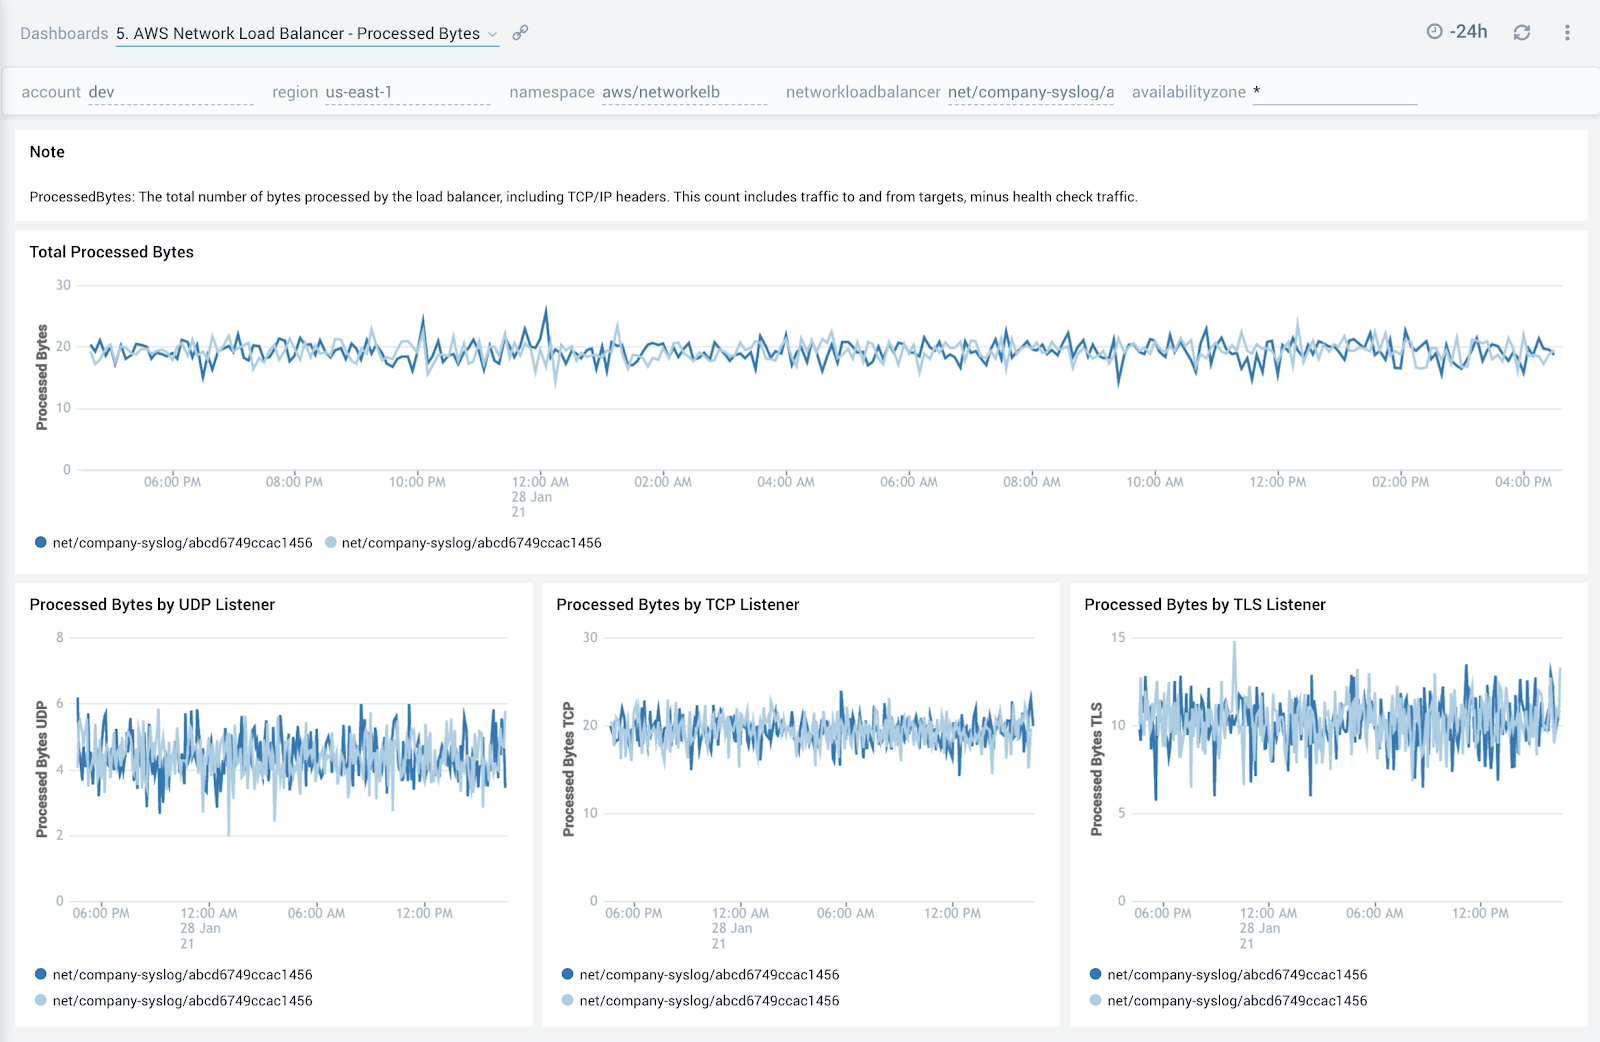
Processed Bytes
The AWS Network Load Balancer - Processed Bytes dashboard provides detailed insights into the amount of bytes processed by the load balancer for total, UDP, TCP and TLS traffic.
Use this dashboard to:
- Monitor trends around processed bytes to make sure they line up with expectations and then use that information to scale up or scale down backend hosts.
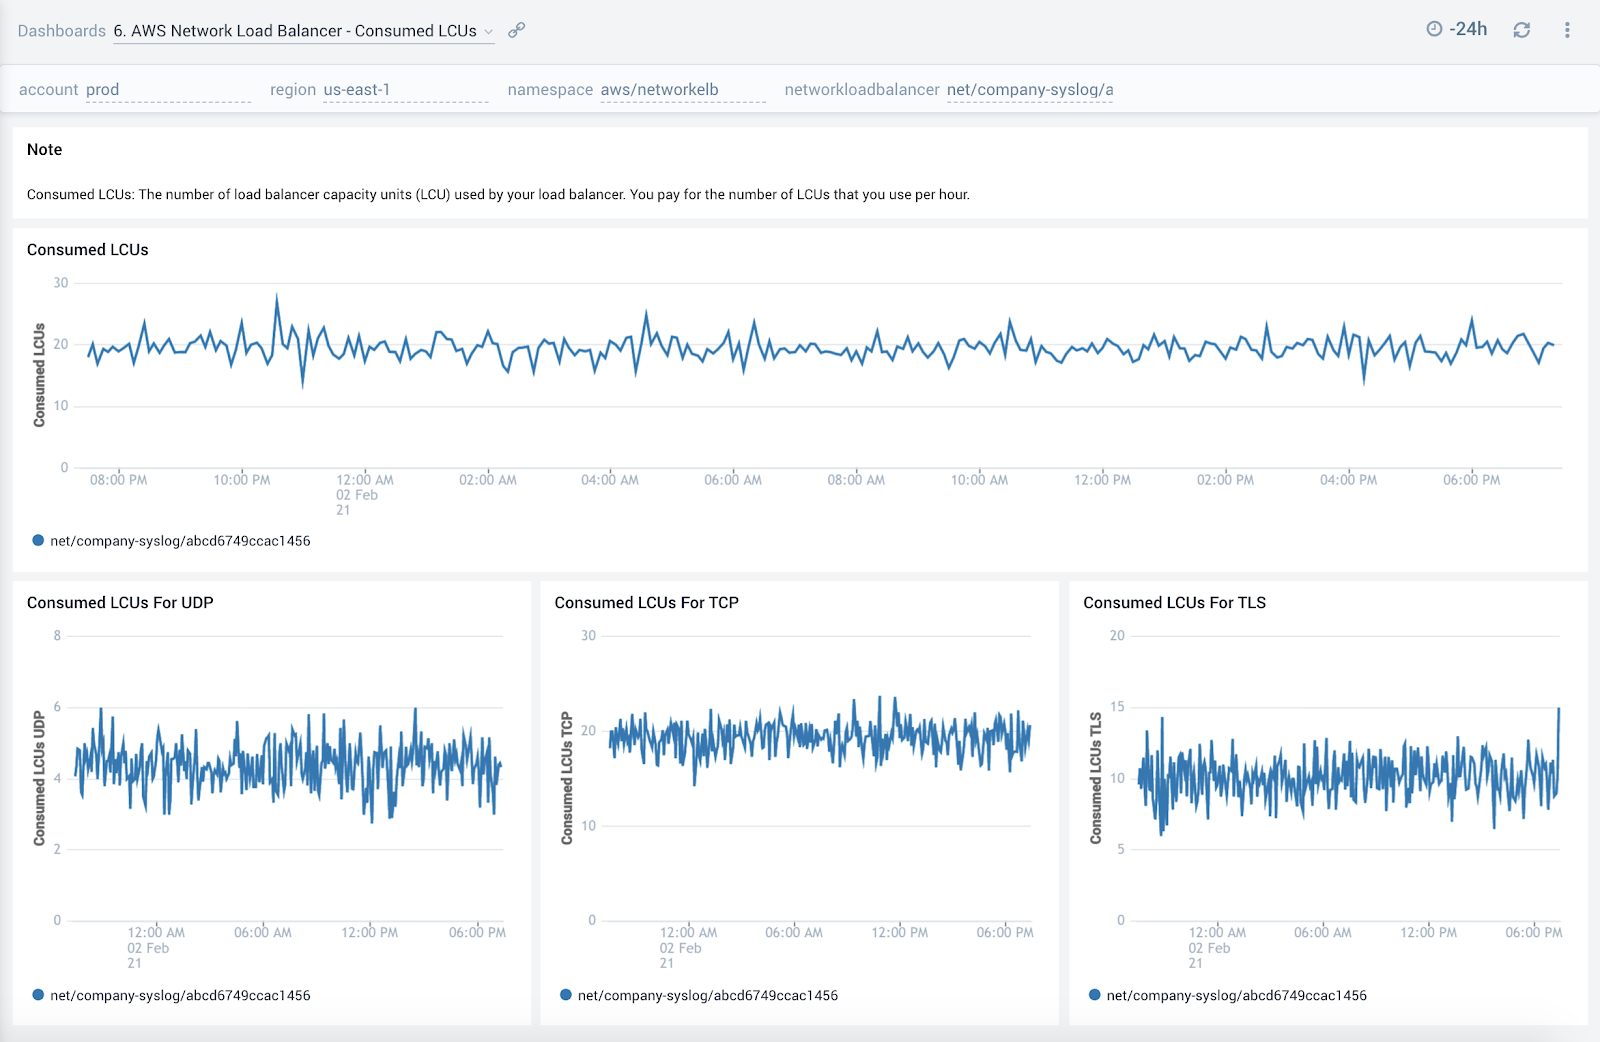
Consumed LCUs
The AWS Network Load Balancer - Consumed LCUs dashboard shows you the total number of load balancer capacity units (LCU) used by your load balancer by network protocol.
You pay for the number of LCUs that you use per hour.
Use this dashboard to:
- Optimize load balancer costs by monitoring trends around the number of load balancer capacity units (LCU) used by network protocol.