AWS API Gateway

AWS API Gateway service allows you to create RESTful APIs and WebSocket APIs for real-time two-way communication applications in containerized and serverless environments, as well as web applications.
The Sumo Logic AWS API Gateway App provides insights into API Gateway tasks while accepting and processing concurrent API calls throughout your infrastructure, including traffic management, CORS support, authorization and access control, throttling, monitoring, and API version management.
Log and Metric Types
The AWS API Gateway app uses the following logs and metrics:
Sample Log Message
{
   "eventVersion":"1.05",
   "userIdentity":{
      "type":"IAMUser",
      "principalId":"A12445W32RZN24HABCD12",
      "arn":"arn:aws:iam::123408221234:user/bob",
      "accountId":"123408221234",
      "accessKeyId":"ASIAZ123456Y3IMWK7X5",
      "userName":"bob",
      "sessionContext":{
         "sessionIssuer":{

         },
         "webIdFederationData":{

         },
         "attributes":{
            "mfaAuthenticated":"true",
            "creationDate":"2020-02-17T08:08:01Z"
         }
      },
      "invokedBy":"signin.amazonaws.com"
   },
   "eventTime":"2020-02-17T08:08:01Z",
   "eventSource":"apigateway.amazonaws.com",
   "eventName":"GetRestApi",
   "awsRegion":"us-east-1",
   "sourceIPAddress":"149.236.17.11",
   "userAgent":"signin.amazonaws.com",
   "requestParameters":{
      "restApiId":"w1234nsgjxf",
      "template":false
   },
   "responseElements":null,
   "requestID":"1234169e-e70a-44a1-a691-3cd3f857092a",
   "eventID":"051572b0-83ef-49a3-82f6-bbef1ac8c488",
   "readOnly":true,
   "eventType":"AwsApiCall",
   "recipientAccountId":"123408221234"
}
Sample Queries
Namespace=aws/apigateway metric=Latency statistic=Average account=* region=* apiname=* | avg by apiname, namespace, region, account
"\"eventSource\":\"apigateway.amazonaws.com\"" errorCode account=dev Namespace=aws/apigateway region=us-east-1
| json "eventName", "eventSource", "awsRegion", "userAgent", "recipientAccountId", "userIdentity", "requestParameters", "responseElements", "sourceIPAddress", "errorCode", "errorMessage", "requestID" as event_name, event_source, Region, user_agent, accountId1, userIdentity, requestParameters, responseElements, src_ip, errorCode, errorMessage, requestID nodrop
| where event_source = "apigateway.amazonaws.com" and !isEmpty(errorCode)
| json field=userIdentity "accountId", "arn", "userName", "type" as accountId2, arn, username, type nodrop | parse field=arn ":assumed-role/*" as user nodrop | parse field=arn "arn:aws:iam::*:*" as accountId, user nodrop
| json field=requestParameters "basePath", "domainName" as basePath, domainName nodrop | json field=responseElements "name" as ApiName nodrop // CreateRestApi, CreateApiKey, CreateUsagePlan, CreateUsagePlanKey, CreateUsagePlanKey, ImportApi, ImportRestApi, UpdateRestApi, UpdateUsagePlan provides ApiName
| where (tolowercase(ApiName) matches tolowercase("*")) or isBlank(apiname)
| if (isEmpty(errorCode), "Success", "Failure") as eventStatus
| if (!isEmpty(accountId1), accountId1, accountId2) as accountId
| if (isEmpty(userName), user, userName) as user
| count as eventCount by errorCode
| top 10 errorCode by eventCount, errorCode asc
Collecting Logs and Metrics for AWS API Gateway
Collect Metrics for AWS API Gateway
Sumo Logic supports collecting metrics using two source types:
- Configure an AWS Kinesis Firehose for Metrics Source (recommended); or
- Configure an Amazon CloudWatch Source for Metrics
Namespace for AWS API Gateway Service is AWS/ApiGateway.
For Metadata, add an account field to the source and assign it a value that is a friendly name/alias to your AWS account from which you are collecting metrics. This name will appear in the Sumo Logic Explorer View. Metrics can be queried via the “account field”.
Collect AWS API Gateway CloudTrail Logs
To your Hosted Collector, add an AWS CloudTrail Source:
- Name. Enter a name to display the new Source.
- Description. Enter an optional description.
- S3 Region. Select the Amazon Region for your API Gateway S3 bucket.
- Bucket Name. Enter the exact name of your API Gateway S3 bucket.
- Path Expression. Enter the string that matches the S3 objects you'd like to collect. You can use a wildcard (
*) in this string.NOTESDO NOT use a leading forward slash. See Amazon Path Expressions. The S3 bucket name is not part of the path. Don’t include the S3 bucket name when you are setting the Path Expression.
- Source Category. Enter
aws/observability/cloud trail/logs. - Fields. Add an account field and assign it a value that is a friendly name/alias to your AWS account from which you are collecting logs. This name will appear in the Sumo Logic Explorer View. Logs can be queried via the “account field”.
- Access Key ID and Secret Access Key. Enter your Amazon Access Key ID and Secret Access Key. Learn how to use Role-based access to AWS here
- Log File Discovery -> Scan Interval. Use the default of 5 minutes. Alternately, enter the frequency. Sumo Logic will scan your S3 bucket for new data. Learn how to configure Log File Discovery here.
- Enable Timestamp Parsing. Select the check box.
- Time Zone. Select Ignore time zone from the log file and instead use, and select UTC.
- Timestamp Format. Select Automatically detect the format.
- Enable Multiline Processing. Select the check box, and select Infer Boundaries.
- Click Save.
Field in Field Schema
Login to Sumo Logic, go to Manage Data > Logs > Fields. Search for the apiname field. If not present, create it. Learn how to create and manage fields here.
Field Extraction Rule(s)
Create Field Extraction Rule for CloudTrail Logs. Learn how to create Field Extraction Rule here.
Rule Name: AwsObservabilityApiGatewayCloudTrailLogsFER
Applied at: Ingest Time
Scope (Specific Data):
account=* eventname eventsource "apigateway.amazonaws.com"
Parse Expression:
| json "eventSource", "awsRegion", "responseElements", "recipientAccountId" as eventSource, region, responseElements, accountid nodrop
| where eventSource = "apigateway.amazonaws.com"
| "aws/apigateway" as namespace
| json field=responseElements "name" as ApiName nodrop
| tolowercase(ApiName) as apiname
| fields region, namespace, apiname, accountid
Centralized AWS CloudTrail Log Collection
In case you have a centralized collection of CloudTraillogs and are ingesting them from all accounts into a single Sumo Logic CloudTraillog source, create following Field Extraction Rule to map proper AWS account(s) friendly name/alias. You'll need to create it if not already present or update it as required.
Rule Name: AWS Accounts
Applied at: Ingest Time
Scope (Specific Data):
_sourceCategory=aws/observability/cloudtrail/logs
Parse Expression
Enter a parse expression to create an account field that maps to the alias you set for each sub account. For example, if you used the “dev” alias for an AWS account with ID "528560886094" and the “prod” alias for an AWS account with ID "567680881046", your parse expression would look like this:
| json "recipientAccountId"
// Manually map your aws account id with the AWS account alias you setup earlier for individual child account
| "" as account
| if (recipientAccountId = "528560886094",  "dev", account) as account
| if (recipientAccountId = "567680881046",  "prod", account) as account
| fields account
Installing the AWS API Gateway App
Now that you have set up a collection for the AWS API gateway, install the Sumo Logic App to use the pre-configured dashboards that provide visibility into your environment for real-time analysis of overall usage.
To install the app:
Locate and install the app you need from the App Catalog. If you want to see a preview of the dashboards included with the app before installing, click Preview Dashboards.
- From the App Catalog, search for and select the app.
- To install the app, click Add to Library and complete the following fields.
- App Name. You can retain the existing name, or enter a name of your choice for the app.
- Advanced. Select the Location in Library (the default is the Personal folder in the library), or click New Folder to add a new folder.
- Click Add to Library.
Once an app is installed, it will appear in your Personal folder, or another folder that you specified. From here, you can share it with your organization.
Panels will start to fill automatically. It's important to note that each panel slowly fills with data matching the time range query received since the panel was created. Results won't immediately be available, but with a bit of time, you'll see full graphs and maps.
Viewing AWS API Gateway Dashboards
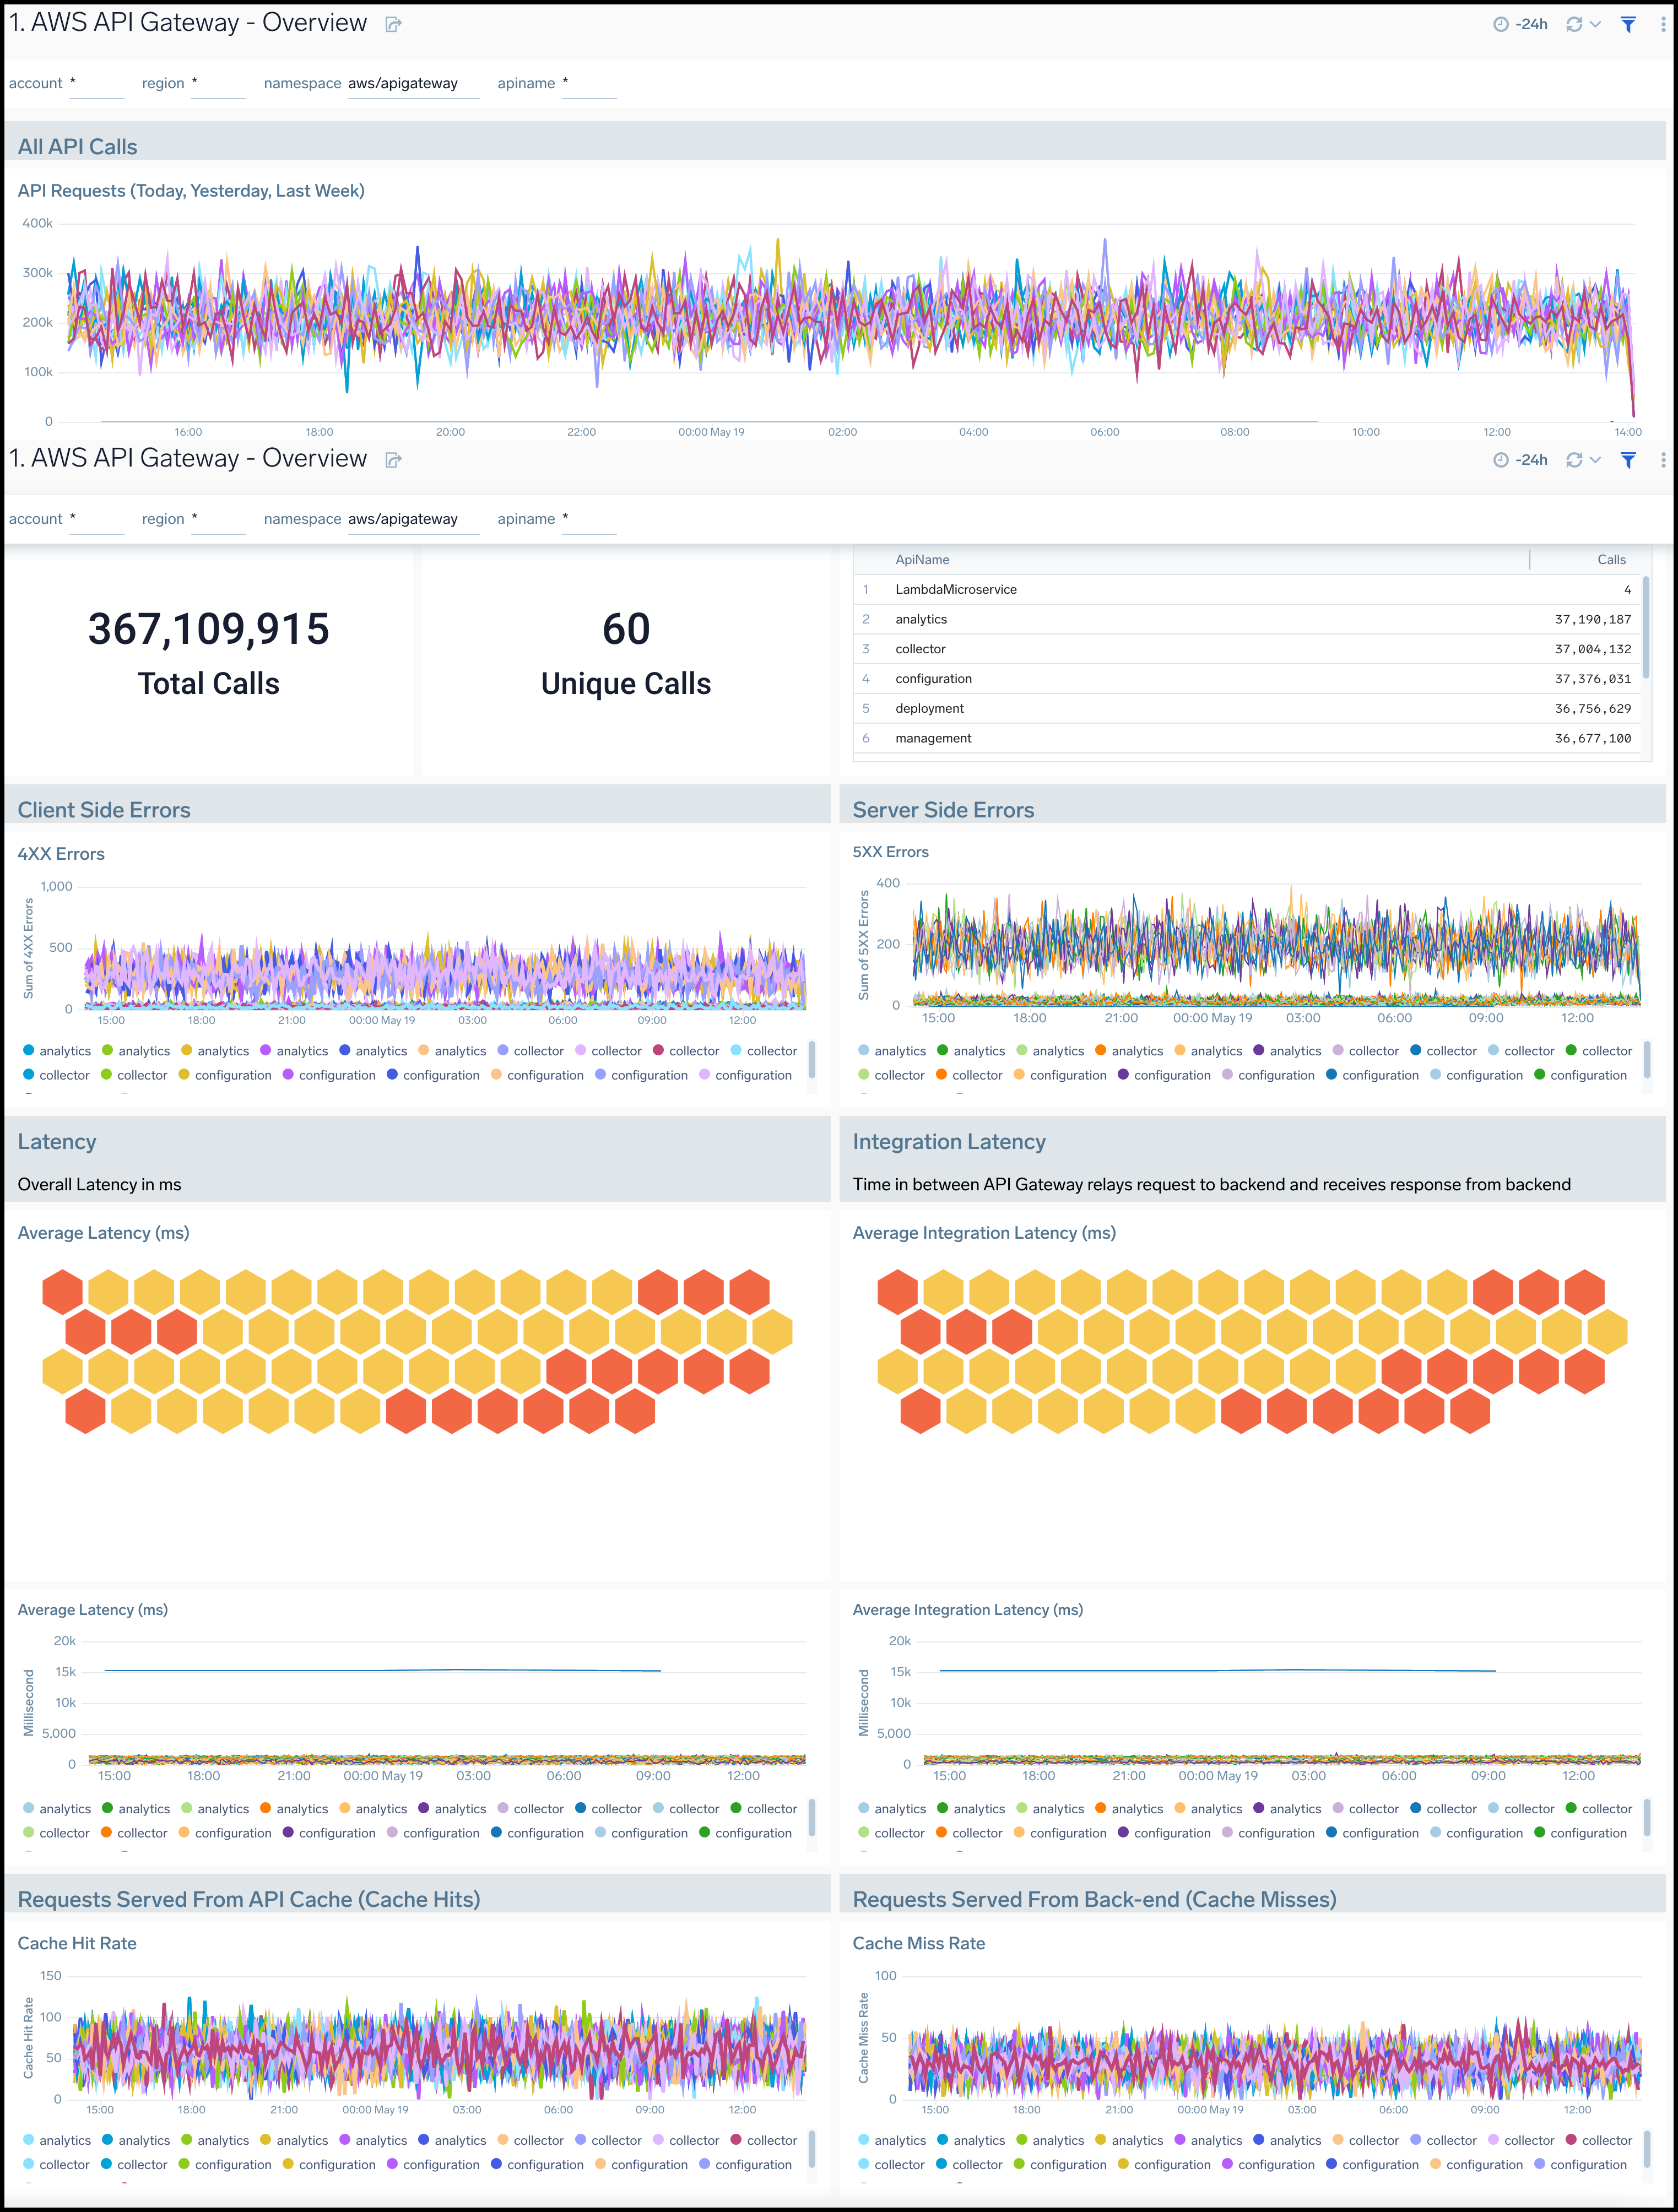
Overview
AWS API Gateway - Overview dashboard provides insights into API Gateway performance throughout your infrastructure, including API calls, latency, client and server-side errors, API cache hits, and back-end cache misses.
To collect CacheHitCount and CacheMissCount metrics, enable your API cache:
- On the AWS console, Go to API Gateway Service and select Specific API -> Stages.
- Select Specific Stage and go to the Settings tab.
- The API should have the "Enable API Cache" checkbox enabled to enable API caching and to collect the CacheHitCount and CacheMissCount metrics.
Use this dashboard to:
- Get a high-level overview of your API Gateway infrastructure.
- Compare API requests made today, yesterday, and last week to identify any abnormal deviations in load
- Get quick statistics on the number of requests and frequently used APIs.
- Monitor the number of client-side and server-side errors processed by API Gateway instances.
- Monitor relative, backend, and overall API responsiveness
- Monitor API cache hits and misses by API Gateway across your infrastructure to optimize cache capacities and achieve desired performance.
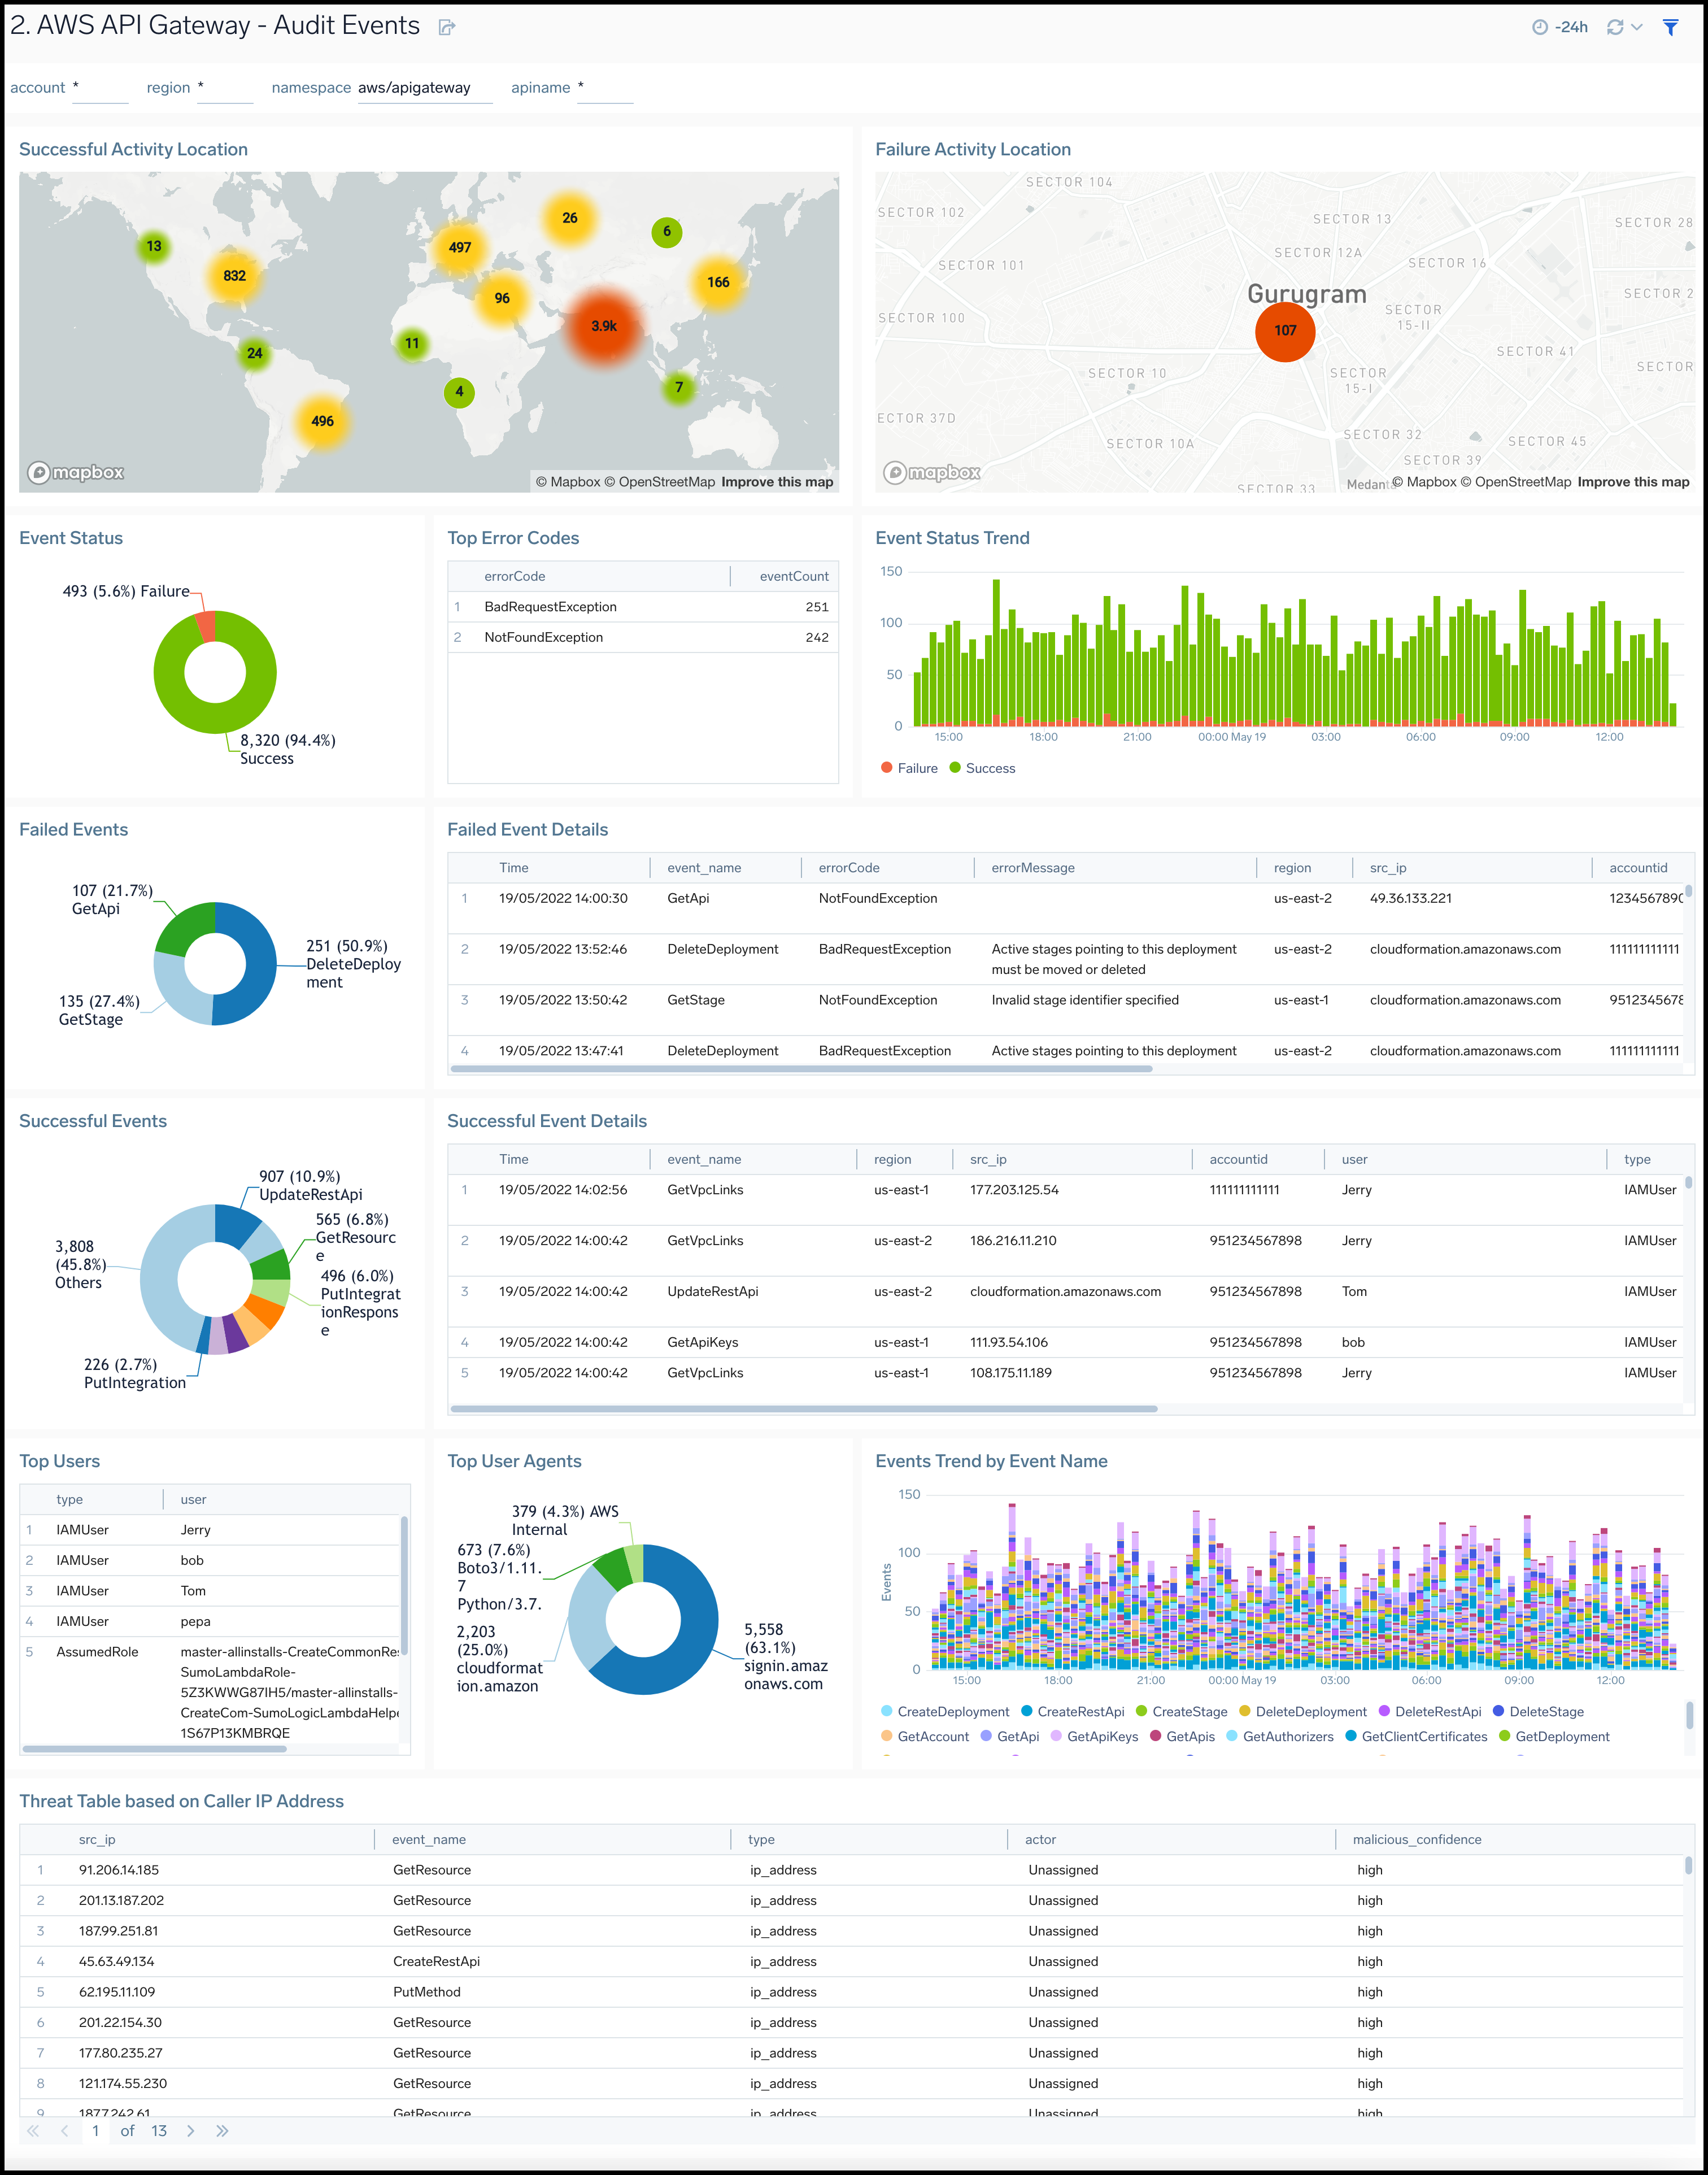
Audit Events
AWS API Gateway - Audit Events dashboard provides detailed audit insights into API Gateway events by various dimensions including event names, trends, regions, user agents, and recipient account IDs.
Use this dashboard to:
- Monitor all API Gateway-related audit logs available via CloudTrail events
- Monitor incoming user activity locations for both successful and failed events to ensure the activity matches with expectations
- Monitor successful and failed API Gateway events, users and user agents / fail activities, and failure reasons
- Monitor requests coming in from known malicious IP addresses detected via Sumo Logic Threat Intel
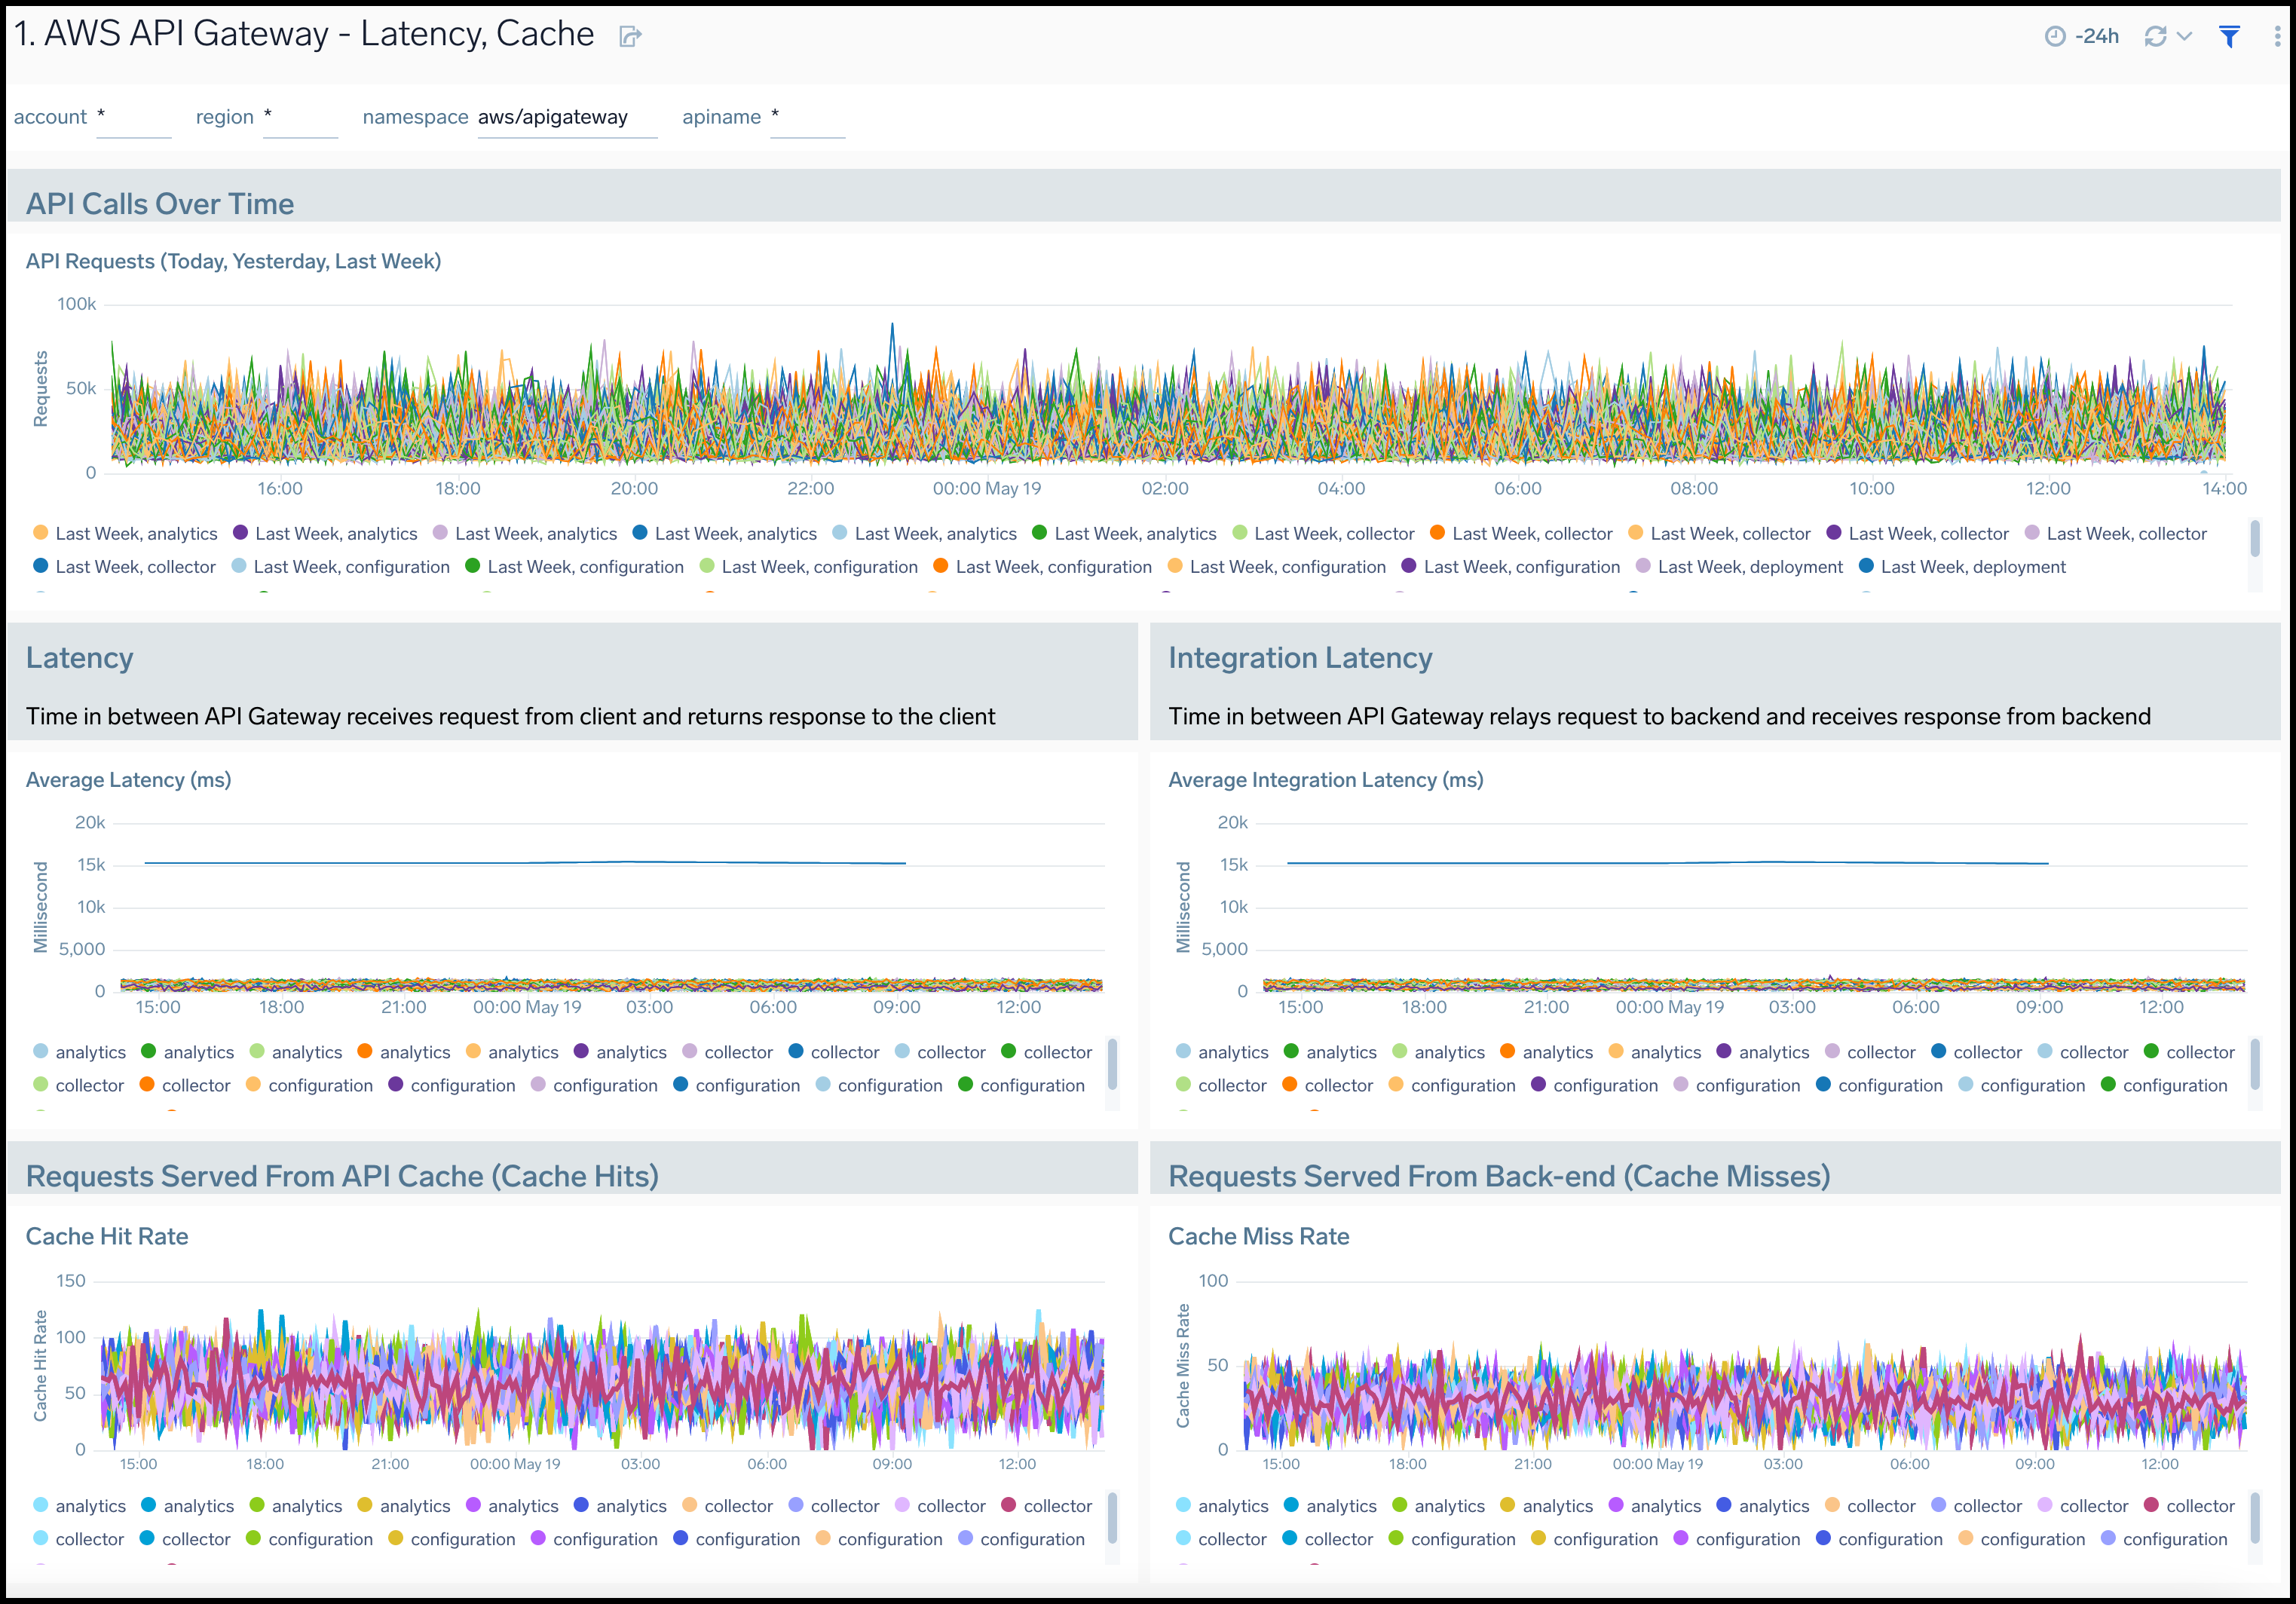
Latency and Cache
AWS API Gateway - Latency, Cache dashboard provides insights into API Gateway performance including API requests, latency, API cache hits, and back-end cache misses.
Use this dashboard to:
- Monitor the overall responsiveness of API calls (latency), comparing times (in milliseconds) between receiving a request from and returning a response to a client.
- Monitor the responsiveness of the backend (integration latency), comparing times (in milliseconds) between API Gateway relay requests to and receiving a response back from the backend.
- Monitor API cache hits and misses to optimize cache capacities across your infrastructure and achieve desired performance.
- Compare API requests made today, yesterday, and last week to identify any abnormal deviations.
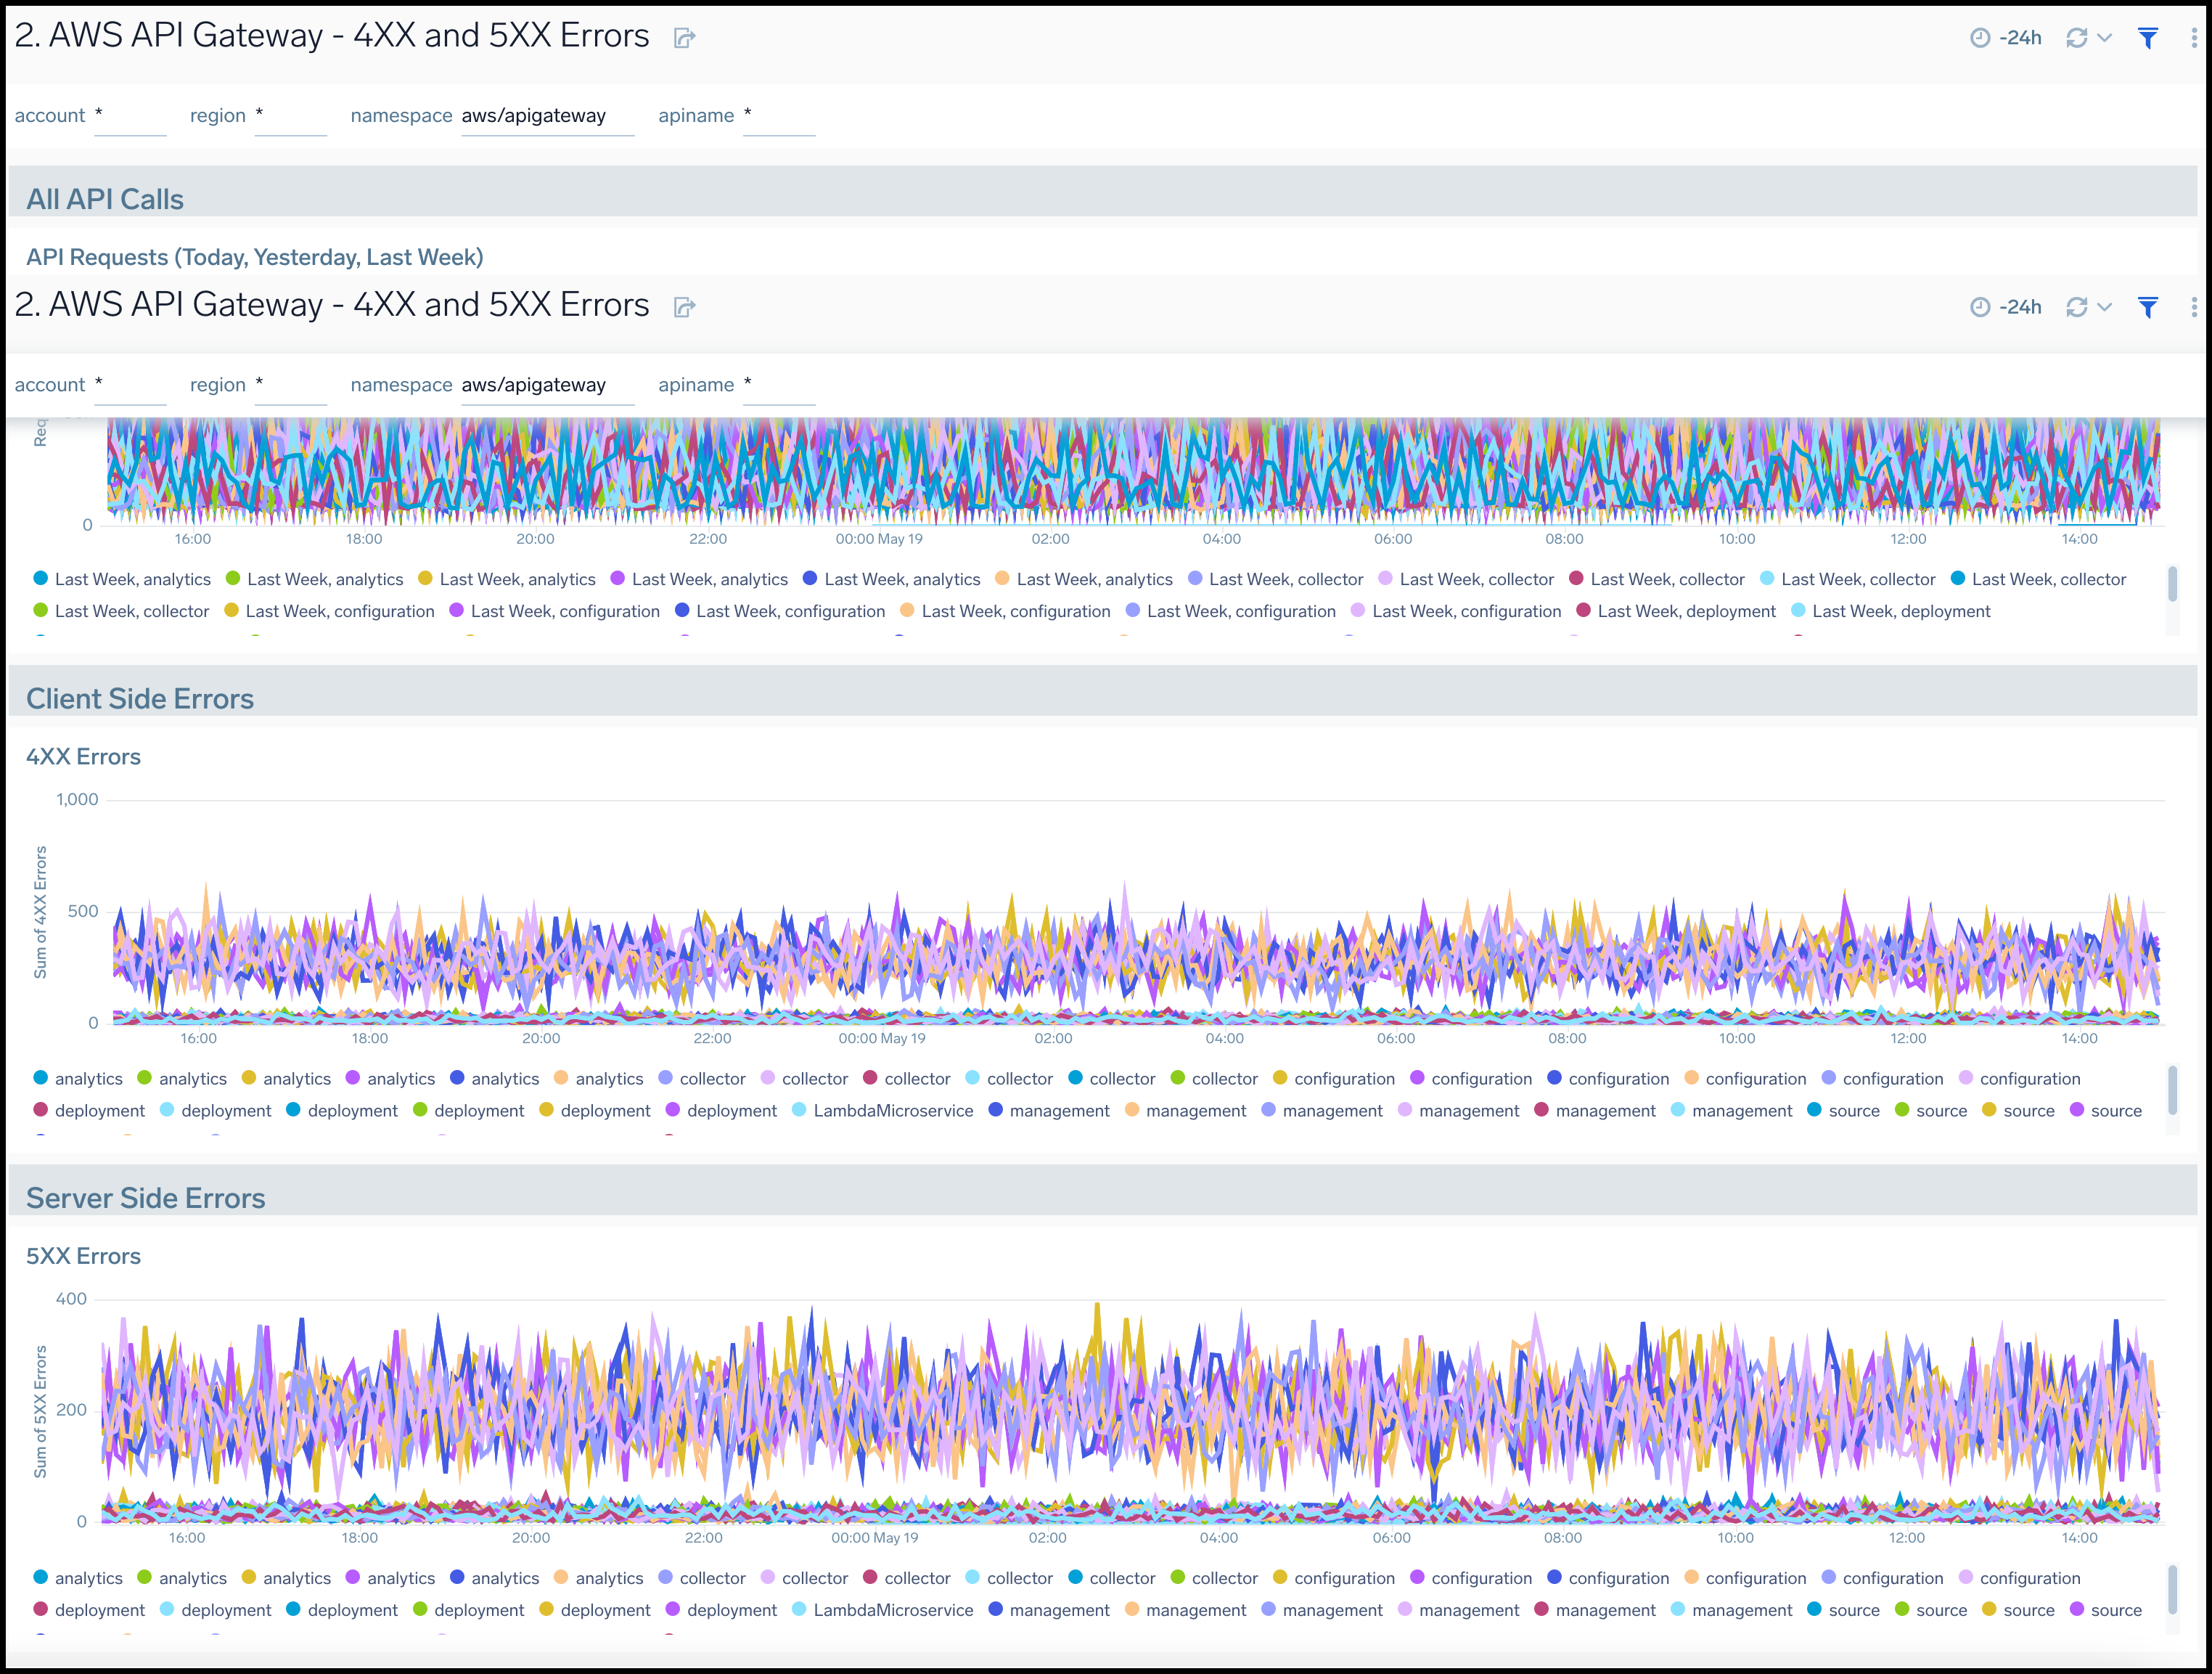
4xx and 5xx Errors
AWS API Gateway - 4xx and 5xx Errors dashboard provides insights into API Gateway HTTP 4xx and 5xx code errors throughout your infrastructure, including API requests, client-side errors, and server-side errors.
Use this dashboard to:
- Monitor the total number of client-side errors based on API name and region across your infrastructure.
- Monitor the total number of server-side errors based on API name and region across your infrastructure.
- Compare API requests made today, yesterday, and last week to identify any abnormal deviations.
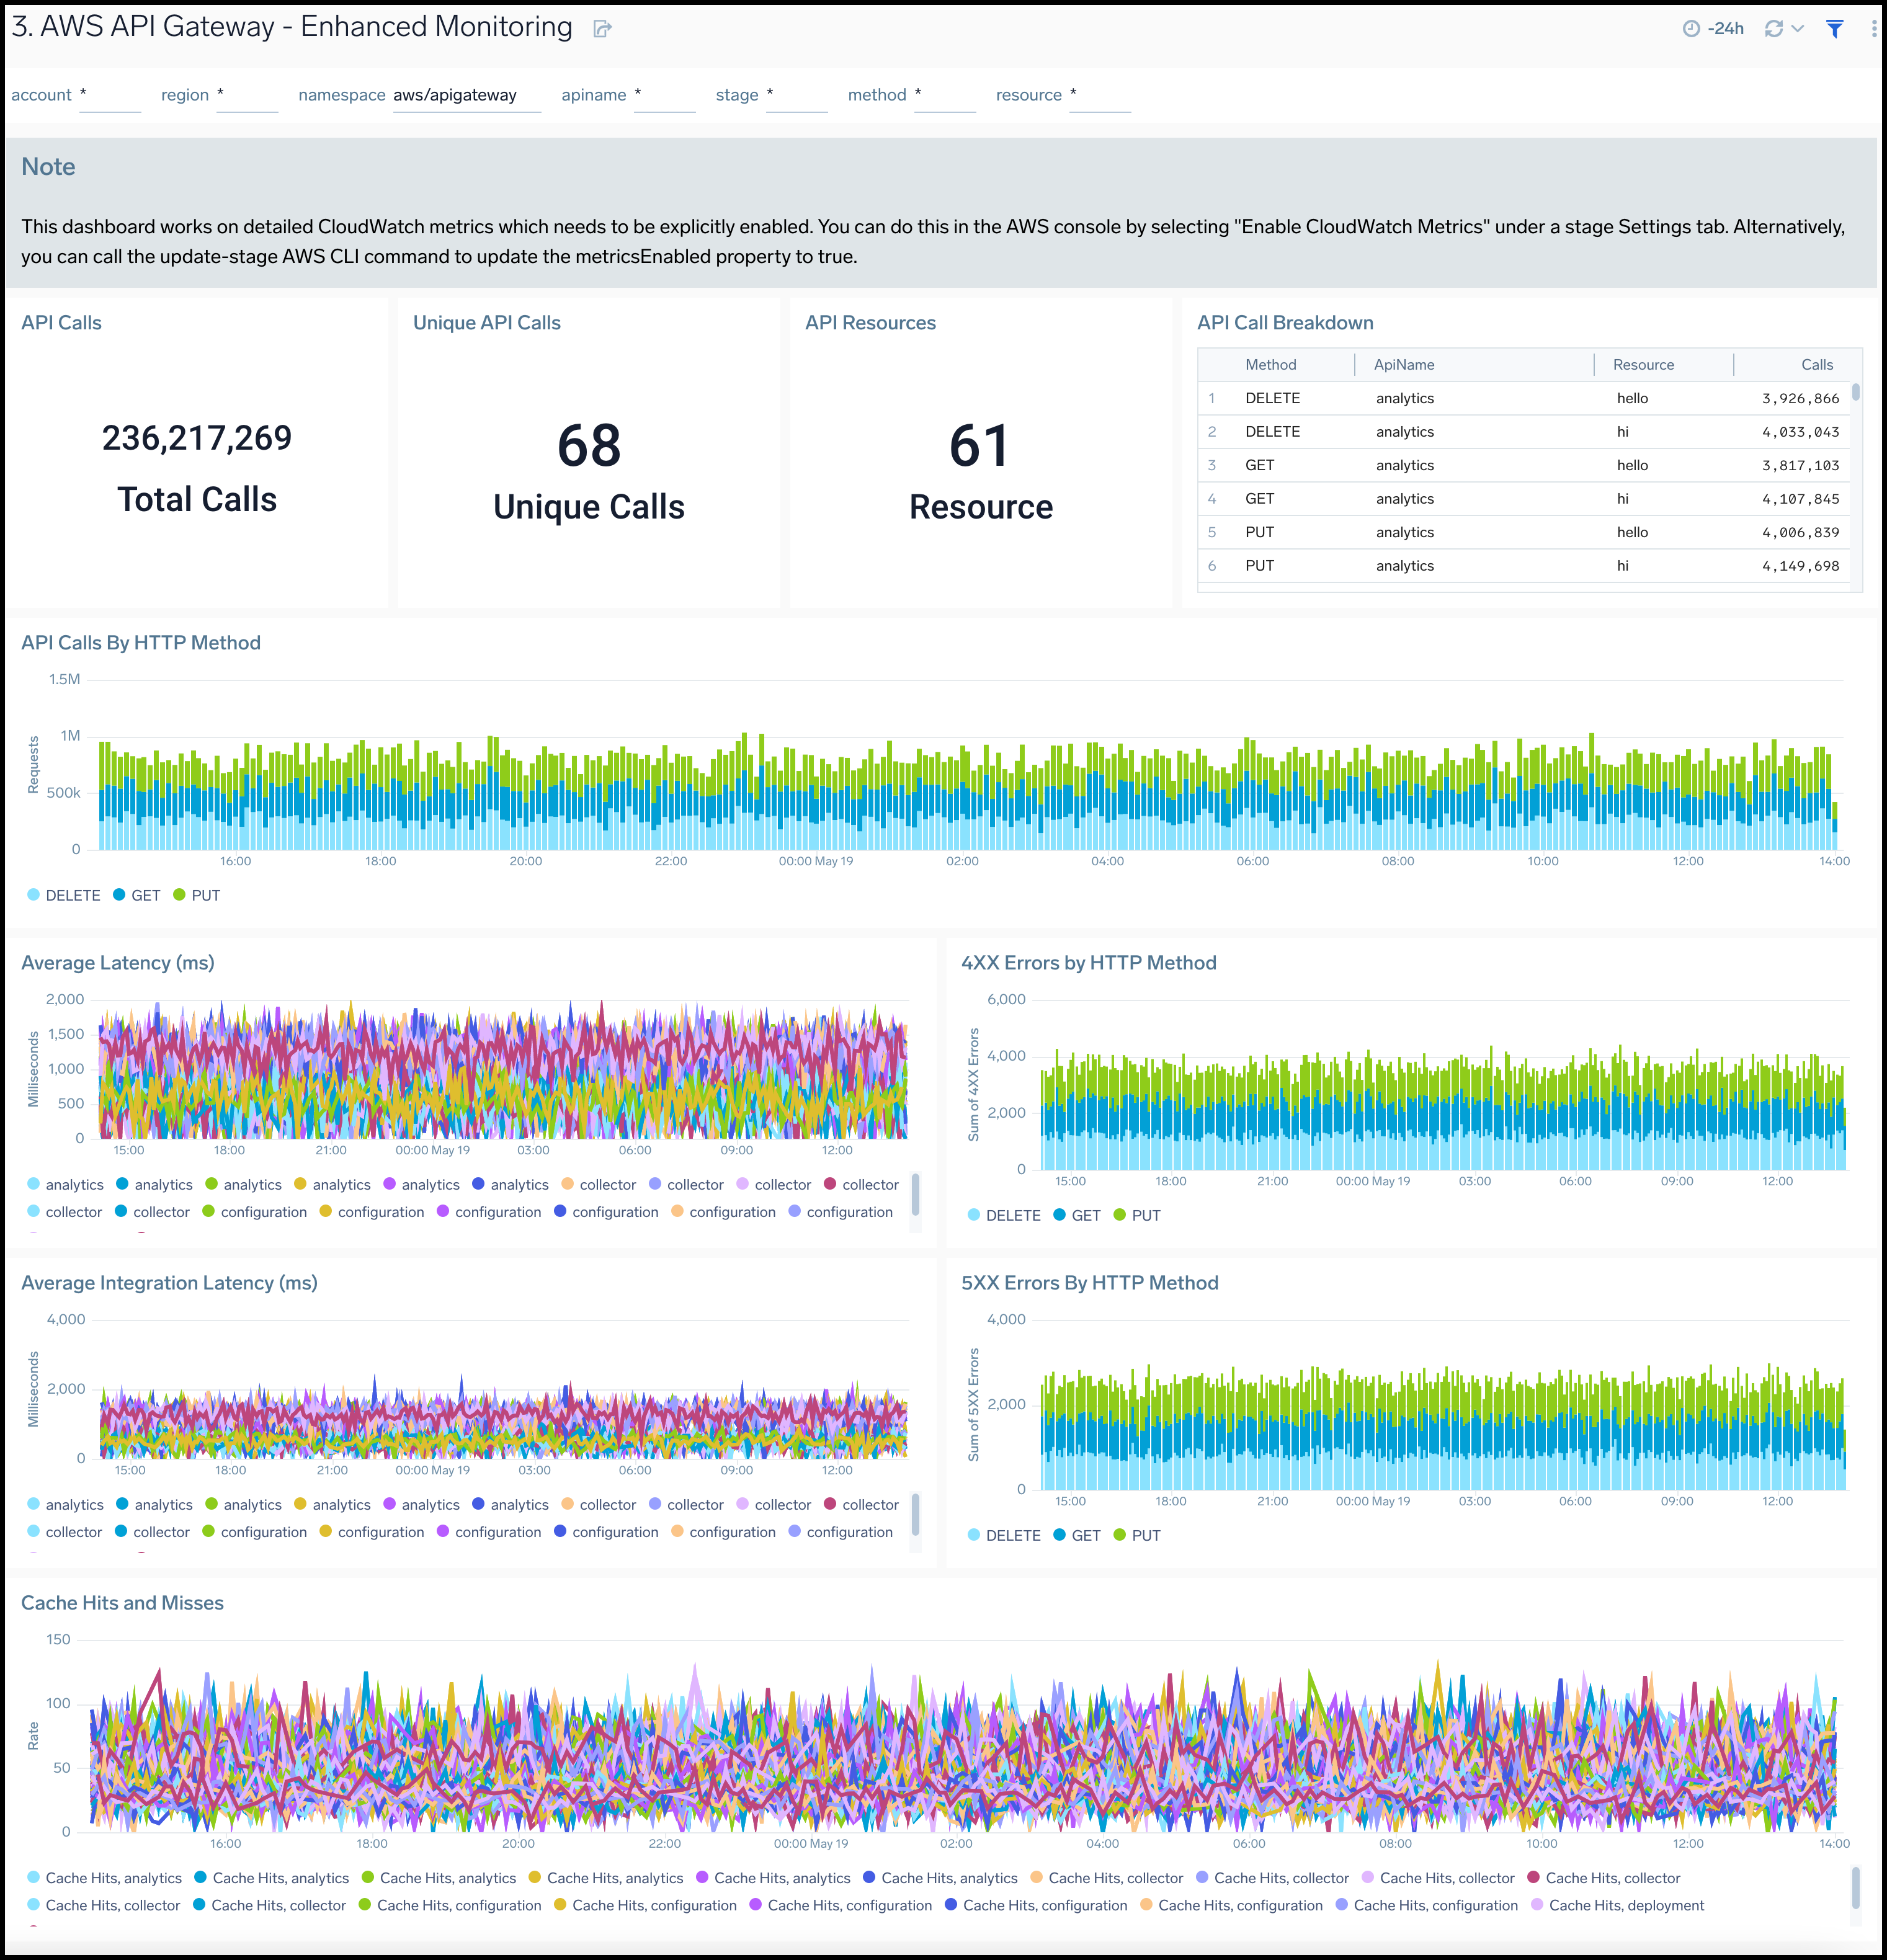
Enhanced Monitoring
AWS API Gateway - Enhanced Monitoring dashboard provides detailed insights into API Gateway performance throughout your infrastructure, including the number and types of API calls, API resources, cache hits, and misses, latency averages, and errors by HTTP method.
For your API Gateway instance to send enhanced metrics, you must have explicitly enabled detailed CloudWatch metrics. You can do this in the AWS management console under a Stage settings tab by selecting Enable CloudWatch Metrics. Alternatively, you can call the update-stage AWS CLI command to update the metrics enabled property to True.
Use this dashboard to:
- Monitor API Gateways across your infrastructure using enhanced metrics.
- Monitor API requests trend by resource, HTTP method, and deployment stage.
- Monitor API cache hits and misses to optimize cache capacities to achieve desired performance.
- Monitor the overall responsiveness of API calls and the backend origin servers
- Monitor the total number of client-side and server-side errors based on HTTP methods