AWS Elastic Load Balancing Metrics

The Sumo Logic App for AWS Elastic Load Balancing (ELB) Metrics lets you analyze the CloudWatch ELB metrics for the Application Load Balancer (ALB), and the Classic Load Balancer (CLB). The App provides preconfigured searches and dashboards that allow you to monitor the metrics healthy hosts, unhealthy hosts, HTTP backend codes, latency, requests, and more.
Collect Metrics for the AWS Elastic Load Balancing App
Metrics Types
For details on Amazon CloudWatch collected metrics, refer to: http://docs.aws.amazon.com/AmazonCloudWatch/latest/monitoring/CW_Support_For_AWS.html
For information on collecting unified logs and metrics for AWS Elastic Load Balancing Metrics, see AWS Elastic Load Balancing ULM - Application.
To collect AWS Elastic Load Balancing Metrics, perform the following tasks:
Installing the AWS ELB Metrics App
Now that you have configured AWS ELB Metrics, install the Sumo Logic App for AWS Elastic Load Balancing Metrics to take advantage of the preconfigured searches and dashboards to analyze your data.
To install the app:
Locate and install the app you need from the App Catalog. If you want to see a preview of the dashboards included with the app before installing, click Preview Dashboards
- From the App Catalog, search for and select the app.
- Select the version of the service you're using and click Add to Library. Version selection is applicable only to a few apps currently. For more information, see Installing the Apps from the Library.
- To install the app, complete the following fields.
- App Name. You can retain the existing name, or enter a name of your choice for the app.
- Data Source. Select either of these options for the data source.
- Choose Source Category, and select a source category from the list.
- Choose Enter a Custom Data Filter, and enter a custom source category beginning with an underscore. Example: (
_sourceCategory=MyCategory).
- Advanced. Select the Location in Library (the default is the Personal folder in the library), or click New Folder to add a new folder.
- Click Add to Library.
Once an app is installed, it will appear in your Personal folder, or other folder that you specified. From here, you can share it with your organization.
Panels will start to fill automatically. It's important to note that each panel slowly fills with data matching the time range query and received since the panel was created. Results won't immediately be available, but with a bit of time, you'll see full graphs and maps.
Viewing AWS ELB Metrics Dashboards
Application Load Balancer
AWS Elastic Load Balancing Metrics - ALB - Overview
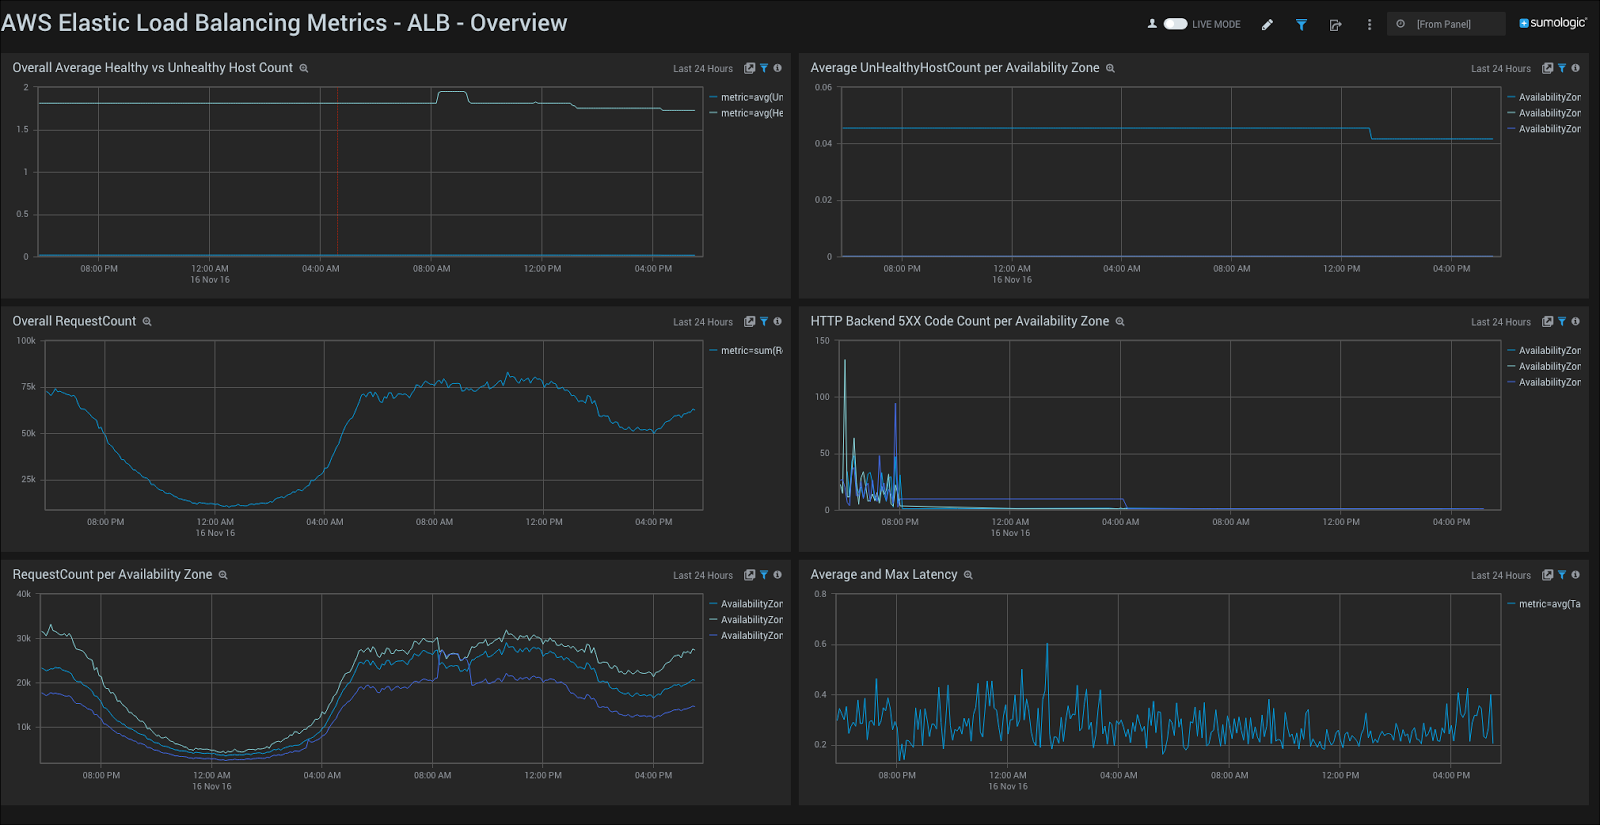
Overall Average Healthy vs Unhealthy Host Count. Displays the overall average number of healthy vs unhealthy hosts in a line chart on a timeline for the last hour.
Average UnHealthyHostCount per Availability Zone. Shows the average number of unhealthy hosts per availability zone in a line chart on a timeline for the last hour.
Overall RequestCount. Provides the overall request count in a line chart on a timeline for the last hour.
HTTP Backend 5XX Code Count per Availability Zone. Displays the number of HTTP backend 5XX codes per availability zone in a line chart on a timeline for the last hour.
Request Count per Availability Zone. Shows the number of requests per availability zone in a line chart on a timeline for the last hour.
Average and Max Latency. Provides details on average and max latency in a line chart on a timeline for the last hour.
AWS Elastic Load Balancing Metrics - ALB - Hosts (Healthy, Unhealthy)
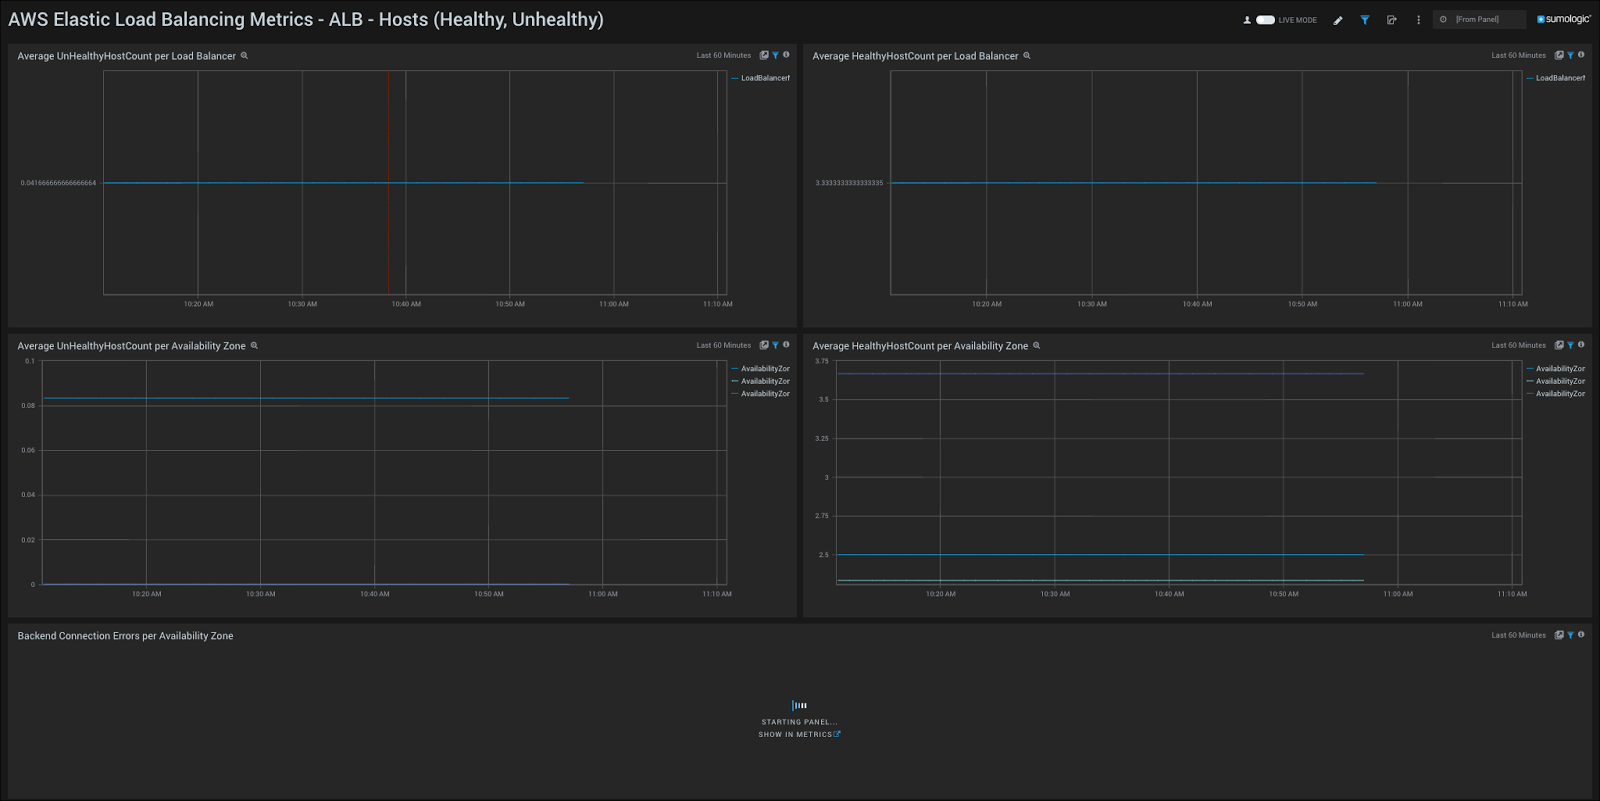
Average UnHealthyHostCount per Load Balancer. Displays the average number of unhealthy hosts per load balancer in a line chart on a timeline for the last hour.
Average HealthyHostCount per Load Balancer. Shows the average number of healthy hosts per load balancer in a line chart on a timeline for the last hour.
Average UnHealthyHostCount per Availability Zone. Provides details on the average number of unhealthy hosts per availability zone in a line chart on a timeline for the last hour.
Average HealthyHostCount per Availability Zone. Displays the average number of healthy hosts per availability zone in a line chart on a timeline for the last hour.
Backend Connection Errors Per Availability Zone. Shows the number of backend connections errors per availability zone in a line chart on a timeline for the last hour.
AWS Elastic Load Balancing Metrics - ALB - HTTP Backend Codes

HTTP Backend 5XX Count per Load Balancer. Displays the number of HTTP backend 5XX status codes per load balancer in a line chart on a timeline for the last hour.
HTTP Backend 5XX Count per Availability Zone. Shows the number of HTTP backend 5XX status codes per availability zone in a line chart on a timeline for the last hour.
HTTP Backend 4XX Count per Load Balancer. Provides the number of HTTP backend 4XX status codes per load balancer in a line chart on a timeline for the last hour.
HTTP Backend 4XX Count per Availability Zone. Displays the number of HTTP backend 4XX status codes per availability zone in a line chart on a timeline for the last hour.
HTTP Backend 3XX Count per Load Balancer. Shows the number of HTTP backend 3XX status codes per load balancer in a line chart on a timeline for the last hour.
HTTP Backend 3XX Count per Availability Zone. Provides the number of HTTP backend 3XX status codes per availability zone in a line chart on a timeline for the last hour.
HTTP Backend 2XX Count per Load Balancer. Displays the number of HTTP backend 2XX status codes per load balancer in a line chart on a timeline for the last hour.
HTTP Backend 2XX Count per Availability Zone. Shows the number of HTTP backend 2XX status codes per availability zone in a line chart on a timeline for the last hour.
AWS Elastic Load Balancing Metrics - ALB - Latency and Requests
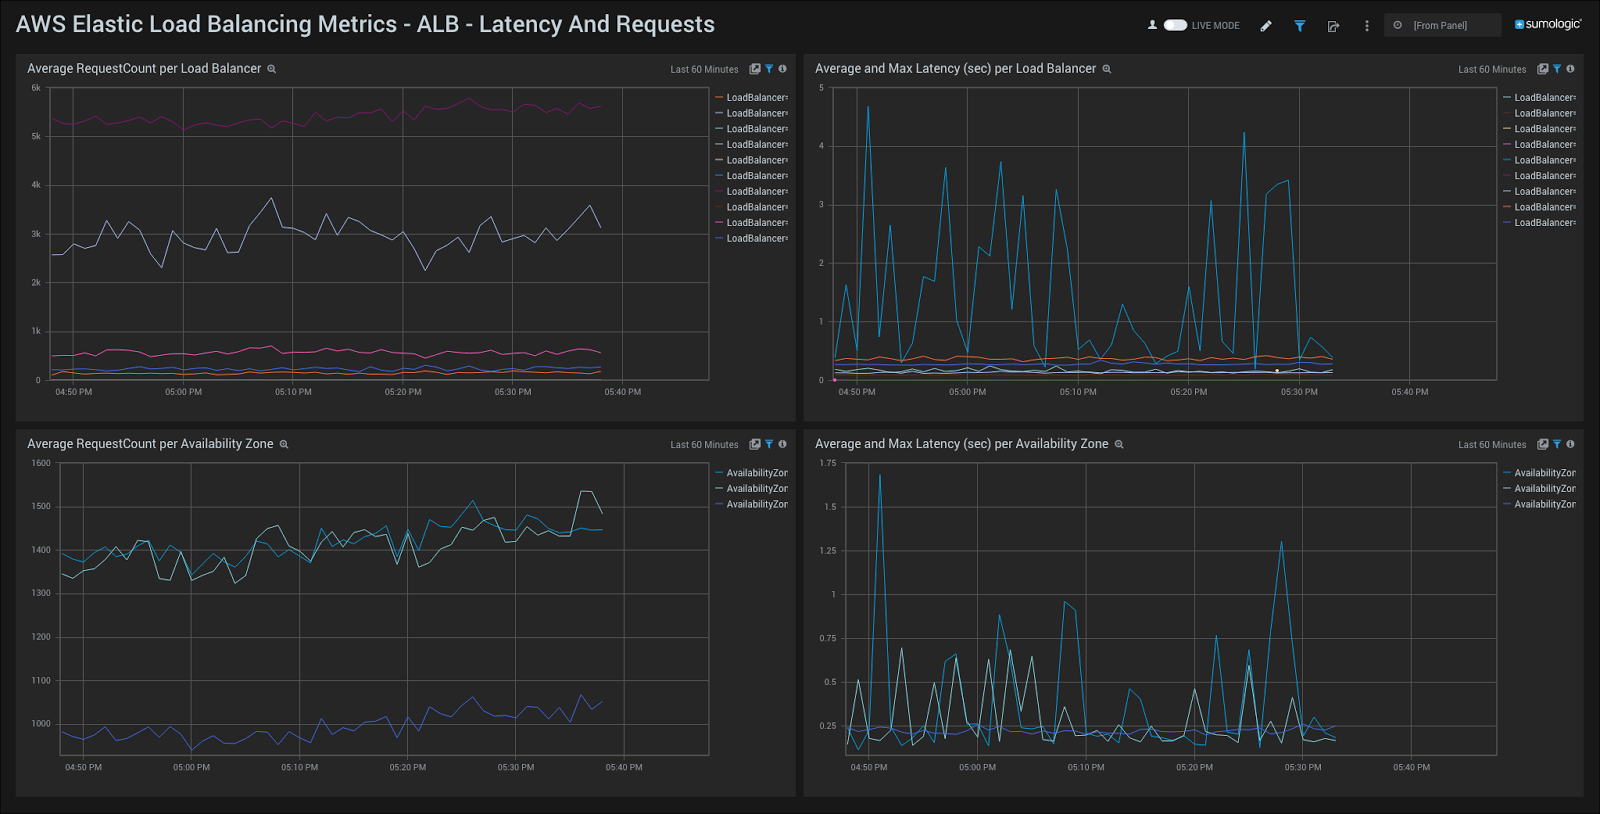
Average RequestCount Per Load Balancer. Displays the average number of requests per load balancer in a line chart on a timeline for the last hour.
Average and Max Latency (sec) per Load Balancer. Shows the average and max latency in seconds per load balancer in a line chart on a timeline for the last hour.
Average RequestCount per Availability Zone. Provides the average number of requests per availability zone in a line chart on a timeline for the last hour.
Average and Max Latency (sec) per Availability Zone. Displays the average and max latency per availability zone in a line chart on a timeline for the last hour.
Classic Load Balancer
AWS Elastic Load Balancing Metrics - CLB - Overview
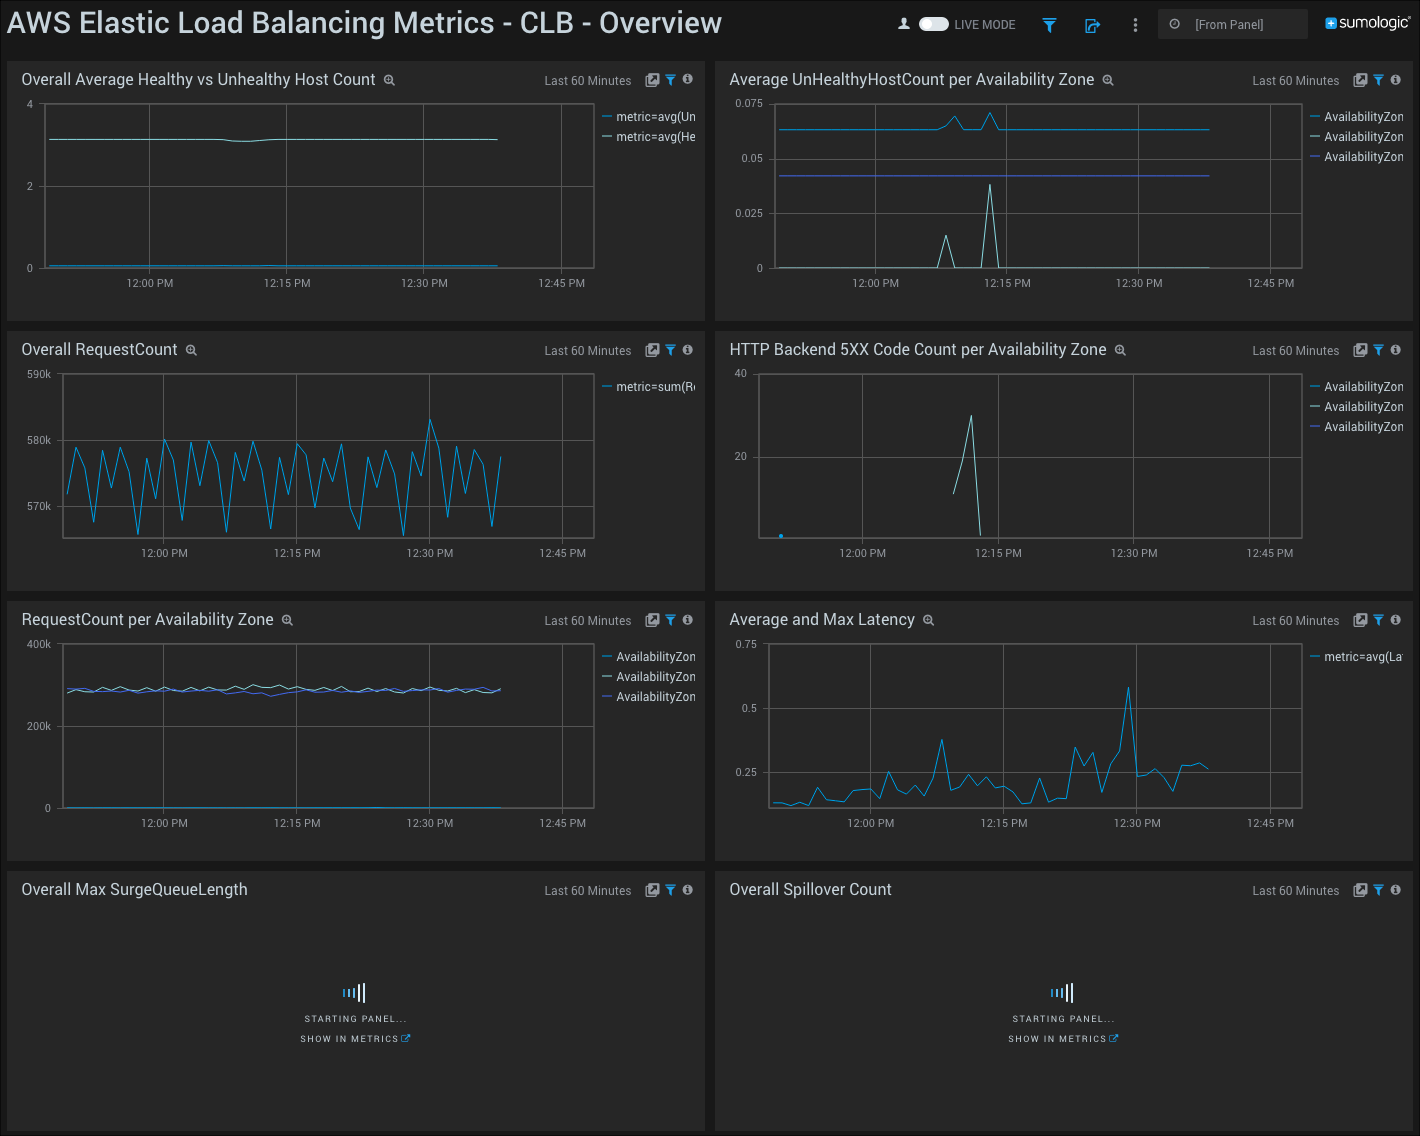
Overall Average Healthy vs Unhealthy Host Count. Displays the overall average number of healthy vs unhealthy hosts in a line chart on a timeline for the last hour.
Average UnHealthyHostCount per Availability Zone. Shows the average number of unhealthy hosts per availability zone in a line chart on a timeline for the last hour.
Overall RequestCount. Provides the overall request count in a line chart on a timeline for the last hour.
HTTP Backend 5XX Code Count per Availability Zone. Displays the number of HTTP backend 5XX codes per availability zone in a line chart on a timeline for the last hour.
Request Count per Availability Zone. Shows the number of requests per availability zone in a line chart on a timeline for the last hour.
Average and Max Latency. Provides details on average and max latency in a line chart on a timeline for the last hour.
Overall Max SurgeQueueLength. Displays the overall max surge queue length in a line chart on a timeline for the last hour.
Overall Spillover Count. Shows the overall spillover count in a line chart on a timeline for the last hour.
AWS Elastic Load Balancing Metrics - CLB - Hosts (Healthy, Unhealthy)
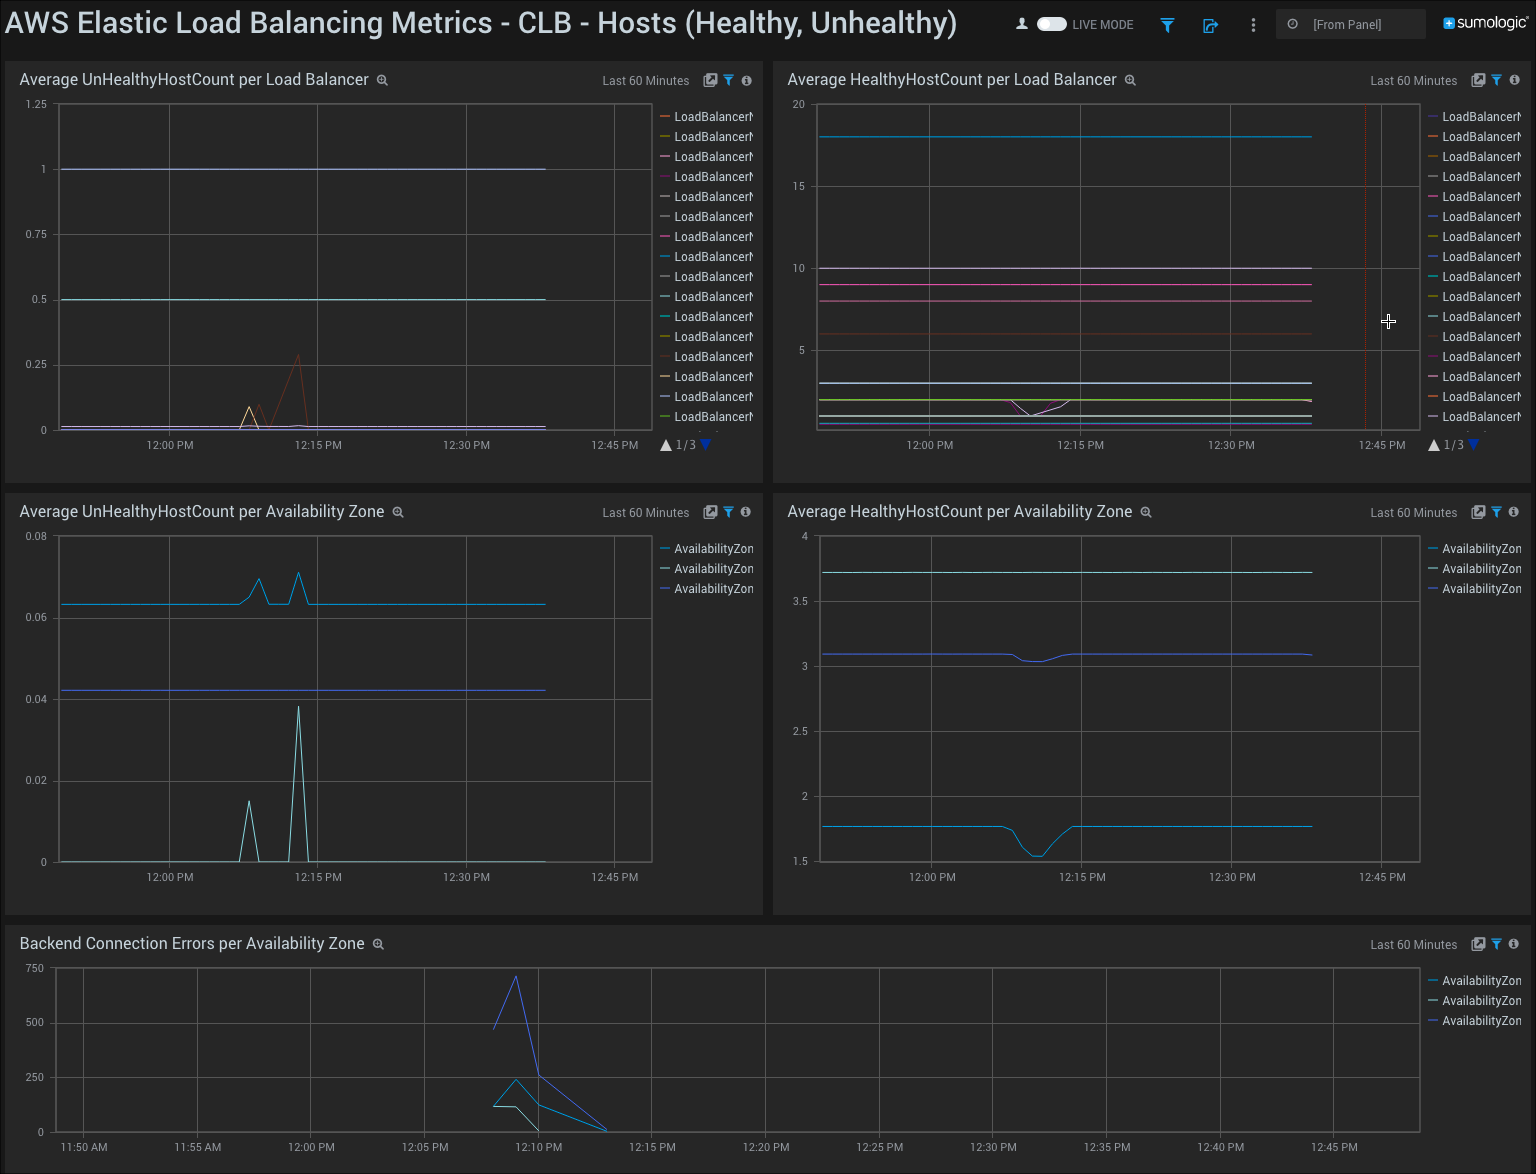
Average UnHealthyHostCount per Load Balancer. Displays the average number of unhealthy hosts per load balancer in a line chart on a timeline for the last hour.
Average HealthyHostCount per Load Balancer. Shows the average number of healthy hosts per load balancer in a line chart on a timeline for the last hour.
Average UnHealthyHostCount per Availability Zone. Provides details on the average number of unhealthy hosts per availability zone in a line chart on a timeline for the last hour.
Average HealthyHostCount per Availability Zone. Displays the average number of healthy hosts per availability zone in a line chart on a timeline for the last hour.
AWS Elastic Load Balancing Metrics - CLB - HTTP Backend Codes
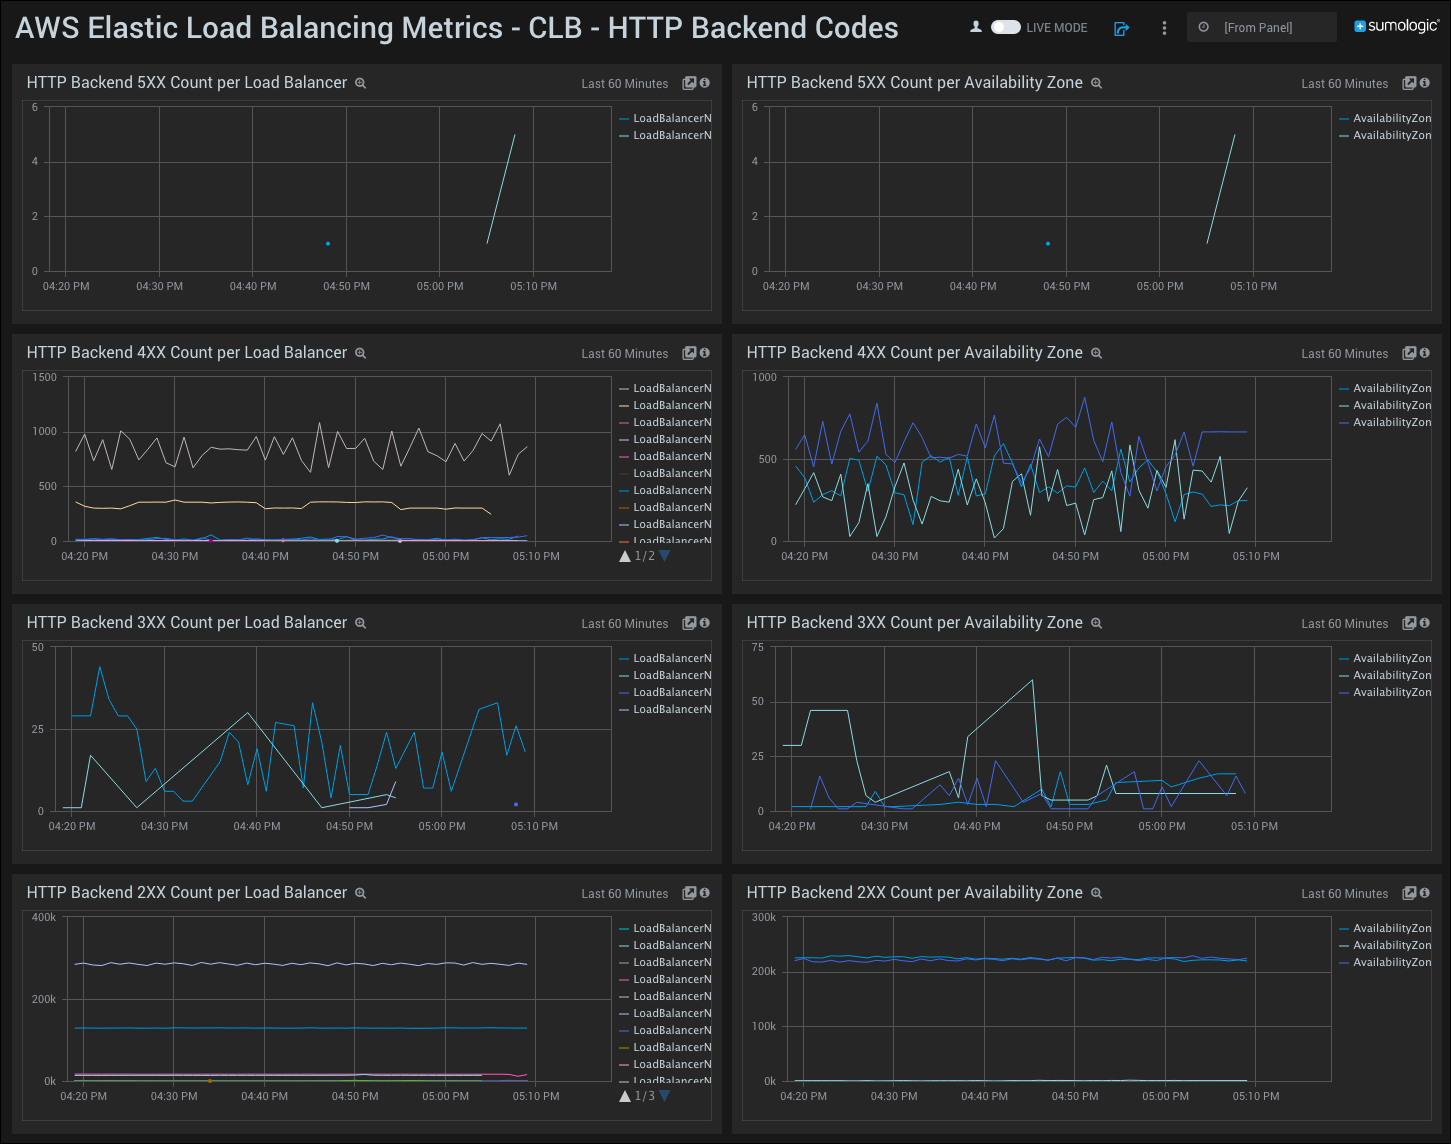
HTTP Backend 5XX Count per Load Balancer. Displays the number of HTTP backend 5XX status codes per load balancer in a line chart on a timeline for the last hour.
HTTP Backend 5XX Count per Availability Zone. Shows the number of HTTP backend 5XX status codes per availability zone in a line chart on a timeline for the last hour.
HTTP Backend 4XX Count per Load Balancer. Provides the number of HTTP backend 4XX status codes per load balancer in a line chart on a timeline for the last hour.
HTTP Backend 4XX Count per Availability Zone. Displays the number of HTTP backend 4XX status codes per availability zone in a line chart on a timeline for the last hour.
HTTP Backend 3XX Count per Load Balancer. Shows the number of HTTP backend 3XX status codes per load balancer in a line chart on a timeline for the last hour.
HTTP Backend 3XX Count per Availability Zone. Provides the number of HTTP backend 3XX status codes per availability zone in a line chart on a timeline for the last hour.
HTTP Backend 2XX Count per Load Balancer. Displays the number of HTTP backend 2XX status codes per load balancer in a line chart on a timeline for the last hour.
HTTP Backend 2XX Count per Availability Zone. Shows the number of HTTP backend 2XX status codes per availability zone in a line chart on a timeline for the last hour.
AWS Elastic Load Balancing Metrics - CLB - Latency and Requests
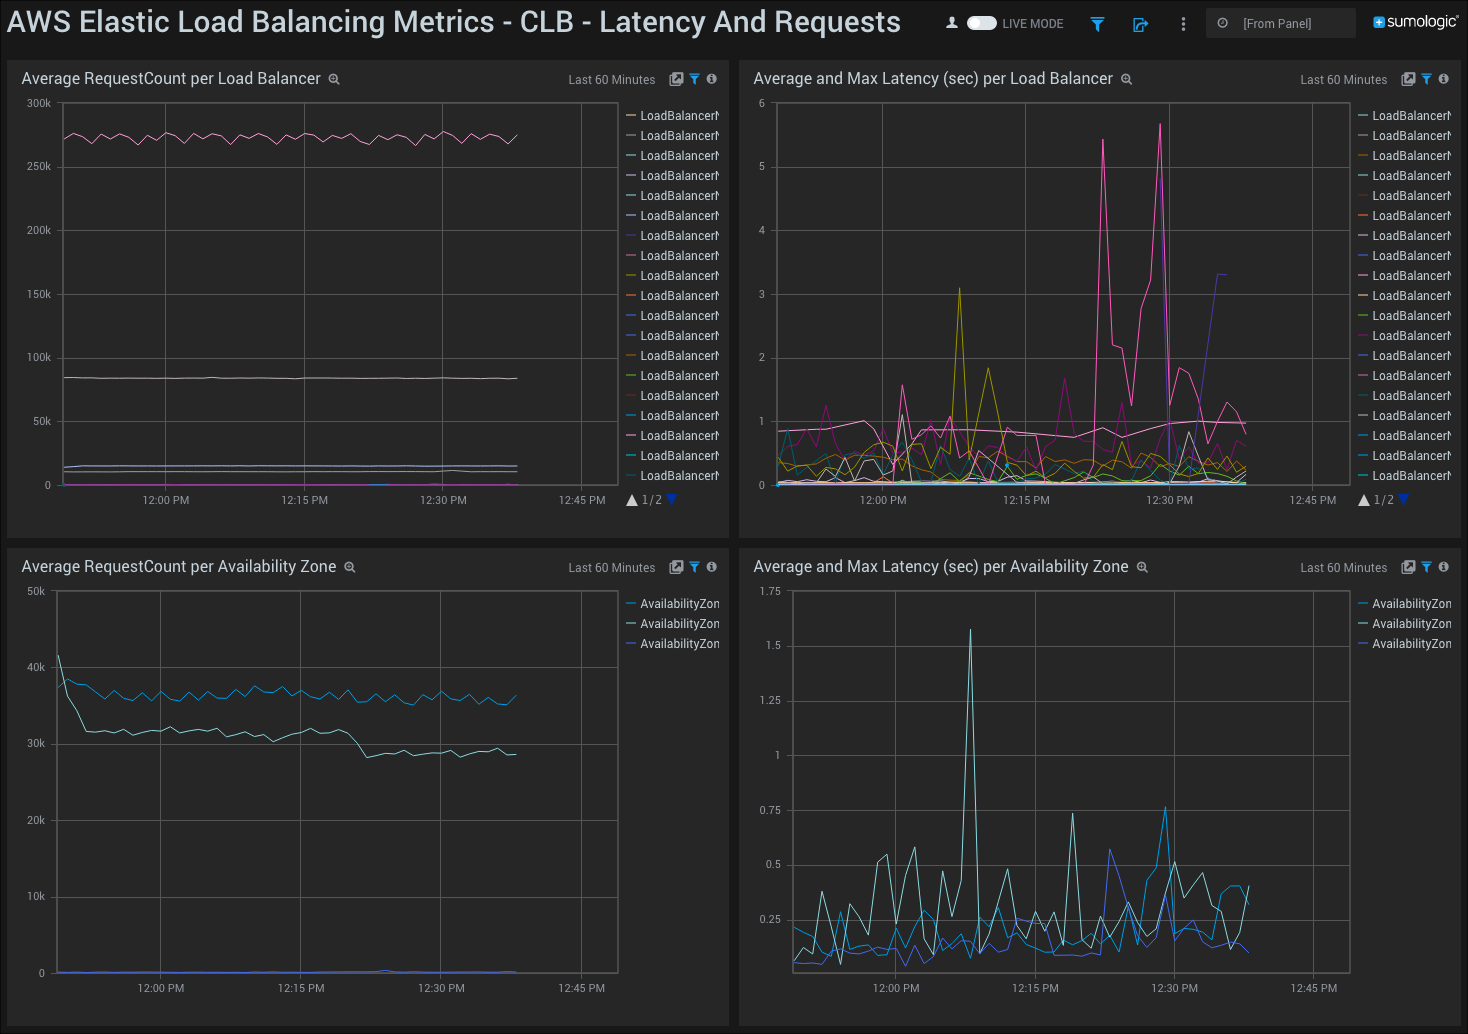
Average RequestCount Per Load Balancer. Displays the average number of requests per load balancer in a line chart on a timeline for the last hour.
Average and Max Latency (sec) per Load Balancer. Shows the average and max latency in seconds per load balancer in a line chart on a timeline for the last hour.
Average RequestCount per Availability Zone. Provides the average number of requests per availability zone in a line chart on a timeline for the last hour.
Average and Max Latency (sec) per Availability Zone. Displays the average and max latency per availability zone in a line chart on a timeline for the last hour.
Filters
The Sumo Logic App for Amazon CloudWatch - ELB Metrics also includes the following filters:
- _collector
- _source
- _sourceCategory
- AvailabilityZone
- LoadBalancerName
- Region