Migrate to Dashboards (New)
The Migrate to New Dashboards functionality allows you to transform Dashboards (Classic) to the Dashboards (New) format, with minimal intervention from post-migration activity.
Advantages
Dashboards (New):
- Are continuously released and updated with new feature additions.
- Provide the unique ability to analyze metrics metadata and logs data on the same dashboard, in an integrated seamless view. This is exactly what you need to monitor and manage a Kubernetes environment effectively.
- Give you control over the visual display of metric and logs data.
- Streamline dashboard configuration and on-the-fly analytic visualizations with its new templating features.
Changes after migration
This table shows the complete list of features that are changed after the implementation of the Migrate to New Dashboards feature.
| Features | Supported | Not Supported |
|---|---|---|
| Theme | No effect, migrated as it is | NA |
| Dashboard Layout |
| NA |
| Chart colors |
| NA |
| Table Panels |
| Text Truncation |
| Bar/Column panel |
|
|
| Line/Area panel |
|
|
| Pie/Donut panel |
|
|
| SVP panel |
|
|
| Map panel | Migrated as is | NA |
| Text/Title panel | Migrated as is | NA |
| Box plot / Sankey |
| ❌ |
| Panel time ranges | Migrated as is | NA |
| Dashboard time range | Migrated as is | NA |
| Metrics query data interpolation | NA | ❌ |
| Metrics series |
| |
| Metrics panel (Line) |
|
|
| Metrics panel (Area) |
| |
| Metrics panel (Single Value) |
|
|
| Metrics panel (Single Value (Gauge) |
| |
| Metrics panel (Single Value (Sparkline) |
|
|
Migration Steps
We do not guarantee 100% conversion from classic to new dashboard, although we do provide an exhaustive list of incompatibilities that need to be taken care of. You can still keep your old dashboard after migration.
This section explains to you the step-by-step process to migrate your dashboards.
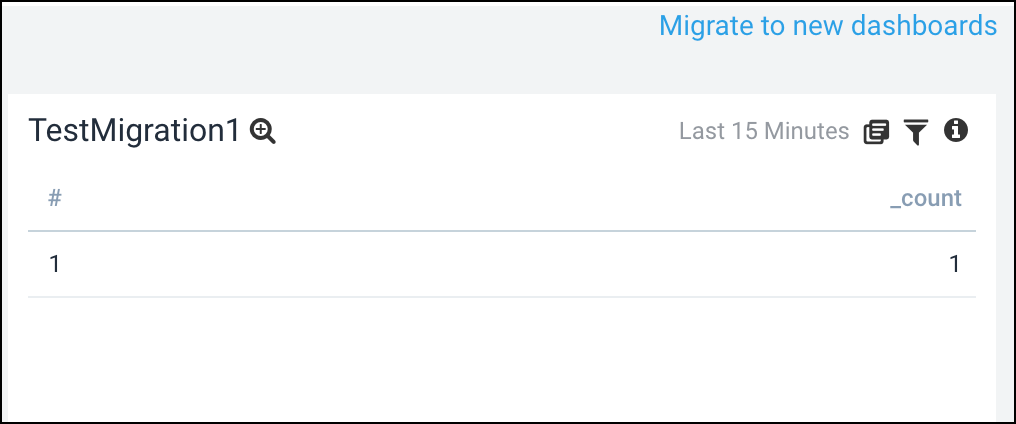
- Navigate to any of your classic dashboards or create a new one. Click Migrate to new dashboards link.
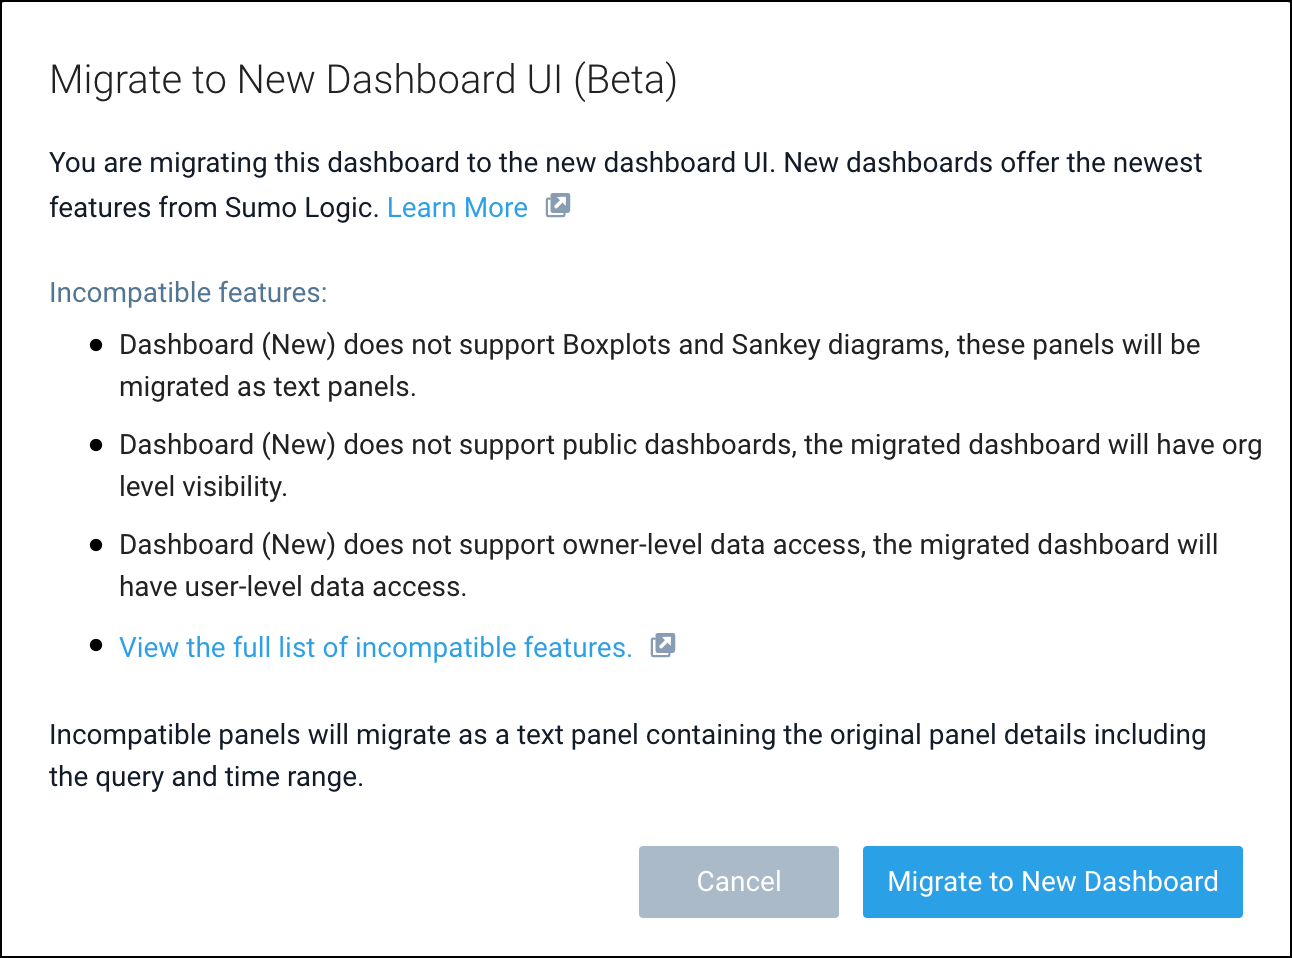
- A dialog box appears. Click Migrate to New Dashboard as shown below.
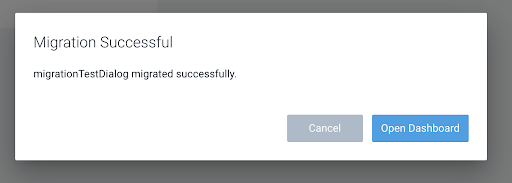
- Click Open Dashboard to view the migrated dashboard, given the migration is successful.
The following dialog can have 2 other states:- Warning State. Showing any warnings during migrations: warnings don’t fail the migration process, however, it might be something that you have to fix on your own or is a feature that is not yet supported on the new dashboard.
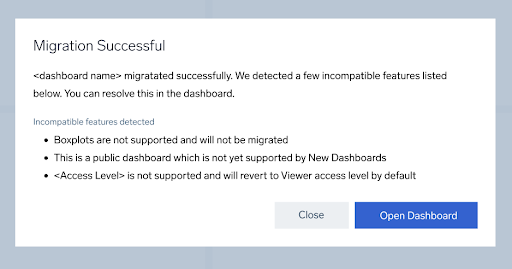
- Error State. The process can sometimes run into an error state, this fails the migration and the new dashboard is not created.
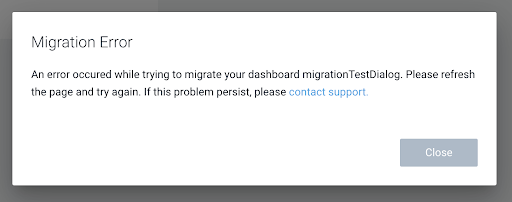
- Warning State. Showing any warnings during migrations: warnings don’t fail the migration process, however, it might be something that you have to fix on your own or is a feature that is not yet supported on the new dashboard.
Bulk Migration
The bulk migration feature is an extension to the dashboard migration feature that allows the user to migrate multiple classic dashboards at once:
- Go to Library, and select two or more Dashboards. Click Migrate Dashboards link.

- A dialog box appears. Click Migrate to New Dashboard as shown.

- The bottom right corner shows real-time information on the migration process.

- The following information is populated once the migration is complete.
- Summary of the process.
- Hovering on the error (if any) shows the error information in the tooltip.
- The dashboard's blue names are clickable and open up the dashboard.

Choosing more than fifty dashboards will disable the Migrate button.
Limitations
| Incompatibility | Description |
|---|---|
| Panels |
|
| Public dashboards |
|