Linking Multiple Dashboards (New)
Link Multiple Dashboards Together
You can link dashboards together to quickly view related data. Each panel can have links to other dashboards. Links have options to include metadata and time range. When you select a data point on the panel you will have an option to click on linked dashboards. This allows you to quickly reference other related dashboards to investigate.
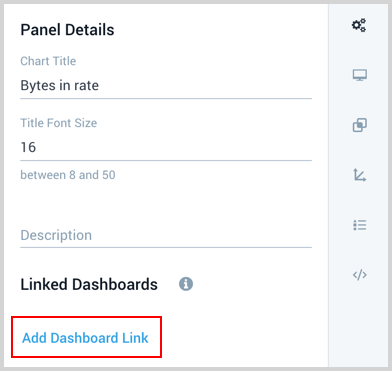
- Click the Add Dashboard Link from the general settings menu when modifying a chart in a panel.
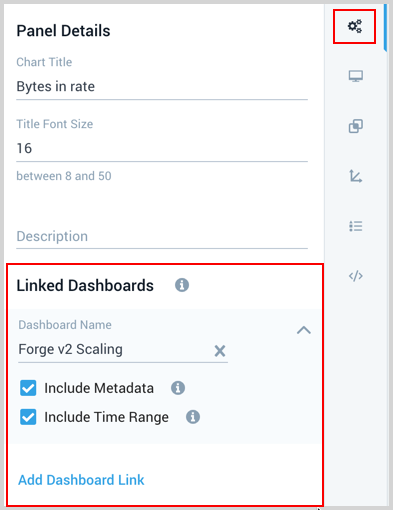
- Click in the Dashboard Name input area and select or enter the name of the dashboard you want the panel to link to.
- Select to Include Metadata if you want the linked dashboard to run against the metadata and variable values of this panel.
- Select to Include Time Range if you want the linked dashboard to run with the time range of this panel.
Using links
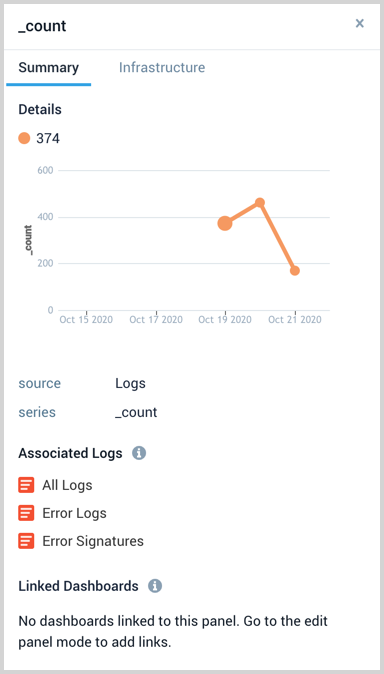
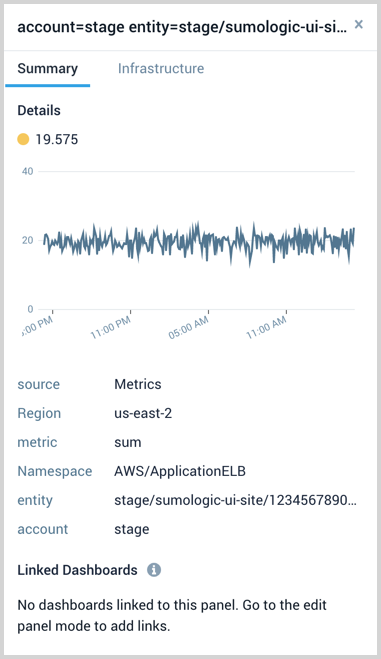
When you click a data point on a Dashboard (New) chart the Summary tab provides your Linked Dashboards.
- The following image shows a Summary panel from a selected log data point. The Linked Dashboards section is at the bottom.
- The following image shows a Summary panel from a selected metric data point. The Linked Dashboards section is at the bottom.
Link a Dashboard (New) to Explore
Stack linking connects Dashboard (New) to Explore so you can view dashboards when exploring infrastructure components.
You link a Dashboard (New) to your stack in Explore by specifying metadata key-value pairs:
- Key - Metadata field name, this is collected from your data and is usually an entity or component name.
- Value(s) - The values of the entity or component.
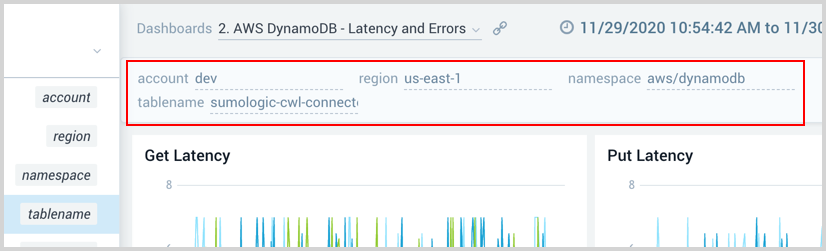
The metadata keys assigned to your Dashboard (New) Stack Linking must be the same as the explored component for the dashboard to show as an option. For example, if your component is named tablename, and has account, region, and namespace metadata assigned to it, as seen in the following Explore screenshot:
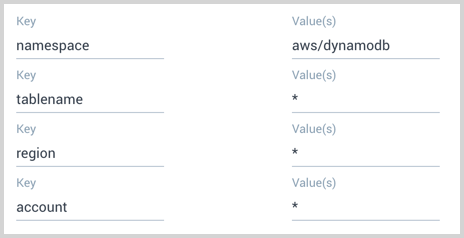
The keys assigned to the Dashboard (New) Stack Linking would need to include those, for example:
To link a custom Dashboard (New) to your stack in Explore, do the following:
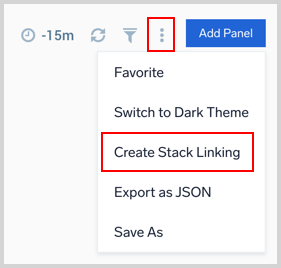
- From your custom dashboard, click the three-dot icon in the upper right corner of the window and select Create Stack Linking from the dropdown menu.
- In the Dashboard Stack Linking dialog, set the Domain you want the key available in.
- Enter a Key that describes the dashboard.
- Next enter Value(s), the component to which the dashboard will be linked in the Explore hierarchy.
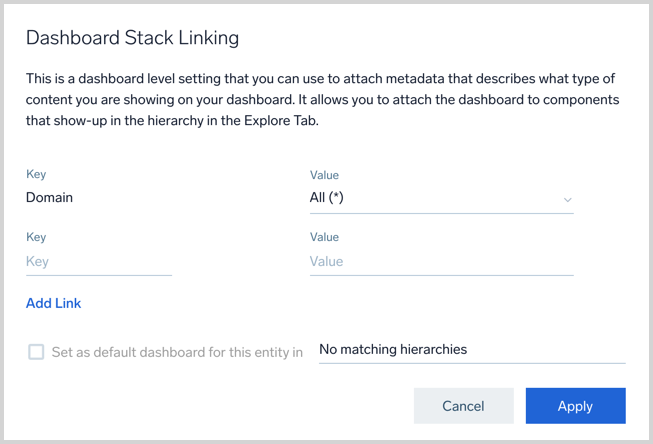
- You can add more key-value pairs by clicking the Add Link link.
- The checkbox to Set as default dashboard for this entity in a hierarchy is available to set when you have defined a specific Domain. When set, you can limit the scope to a subset of hierarchies using the dropdown labelled No matching hierarchies.
- Click Apply to apply the stack link.
- Now when you navigate in Explore to an entity or component with matching key-value pairs you will have the option to view your Dashboard (New) in Explore.
View linked dashboards
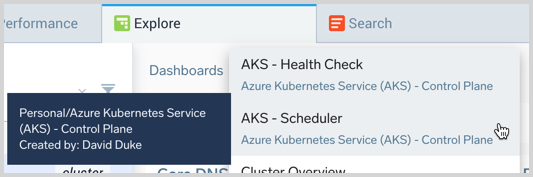
In Explore, when navigating to components you will have the option to select other dashboards that were linked.
From the Dashboards dropdown menu, select the name of the linked dashboard to load it in Explore. When hovering over available dashboards the tooltip provides the location and creator so it is easier to identify.