Drill Down to Discover Root Causes
When you see a spike of interest on a dashboard that requires further investigation, you can easily drill into the related content to discover the root cause. This page shows you how you can easily discover related dashboards and corresponding logs searches that pertain to an issue in your environment.
If you're looking for our Root Cause Explorer observability tool, click here.
Drilling into related content
Sumo Logic provides relevant log searches and dashboards to consider investigating, as well as other locations with relevant content. This facilitates quickly discovering the root cause and devising a plan of action.
Not all error states will provide related content links.
To discover and view related content, do the following:
- Log in to Sumo Logic and open the Dashboard (New).
- Select the graph data point you are interested in. In the following screenshot, we selected a bar in a bar chart. A panel appears on the right of the window with details and a list of related content links.
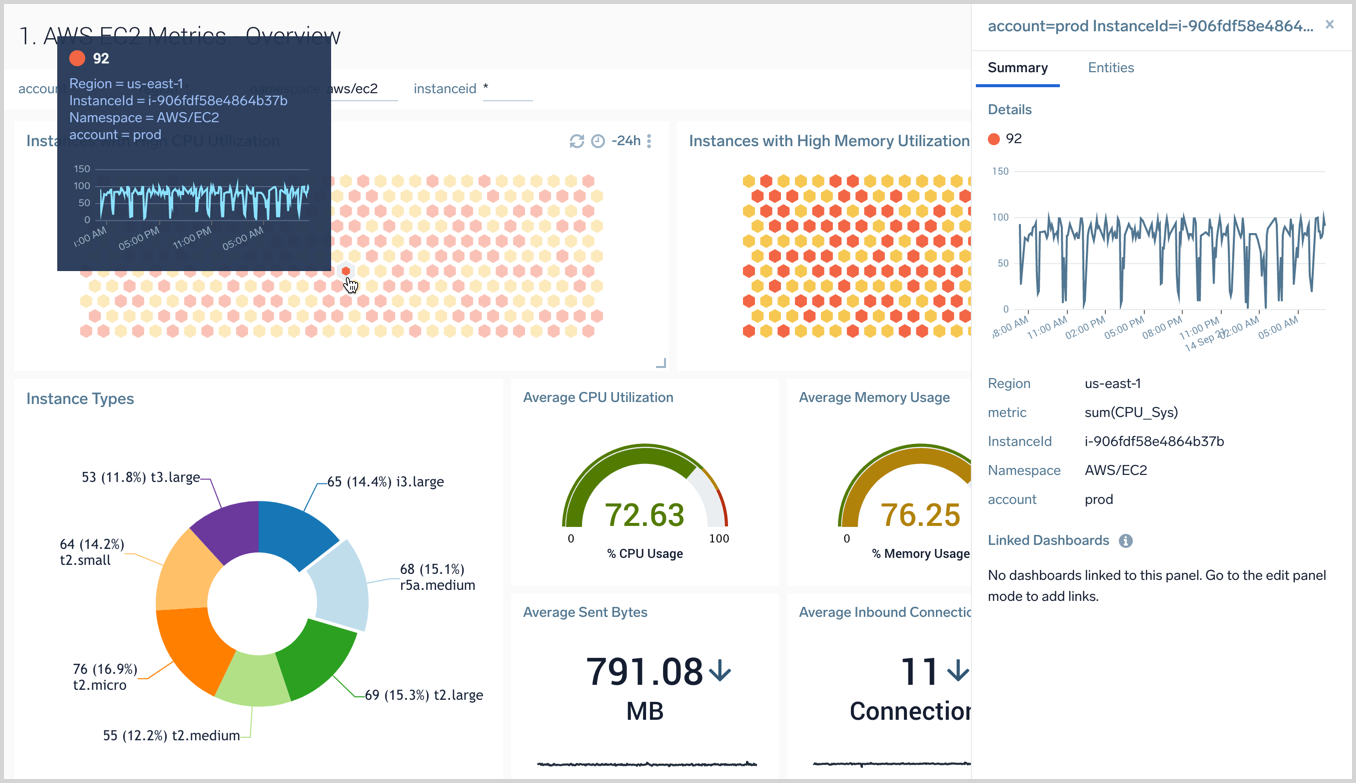
Summary tab
The Summary tab provides details and helpful links based on the selected data point.
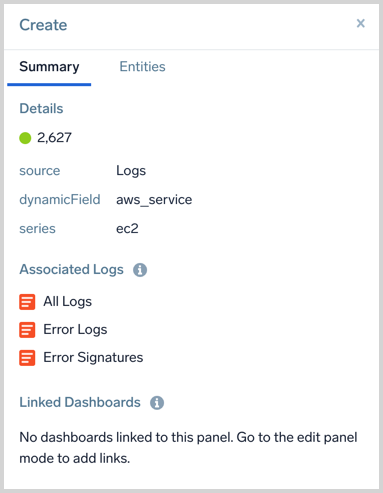
Logs
The Summary tab for log data provides links to other associated logs based on metadata and any Linked Dashboards.
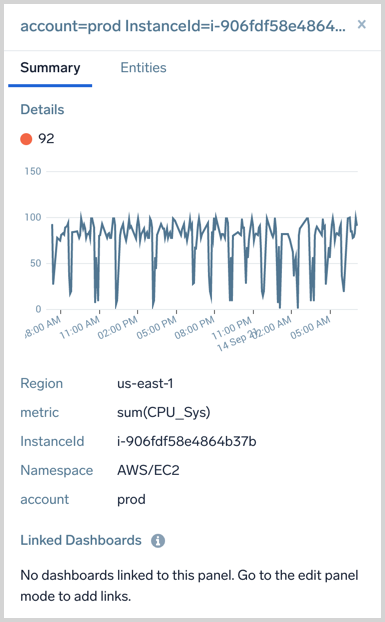
Metrics
A metrics data Summary tab includes links to any Linked Dashboards.
Entities tab
The Entities tab provides troubleshooting links for related Entities and Environments, as well as any Monitors with a Critical, Warning, or Missing Data status that are tracking logs or metrics on the Entity. The entities are grouped by their domain and by entity type (if there are more than one entity of a given type).
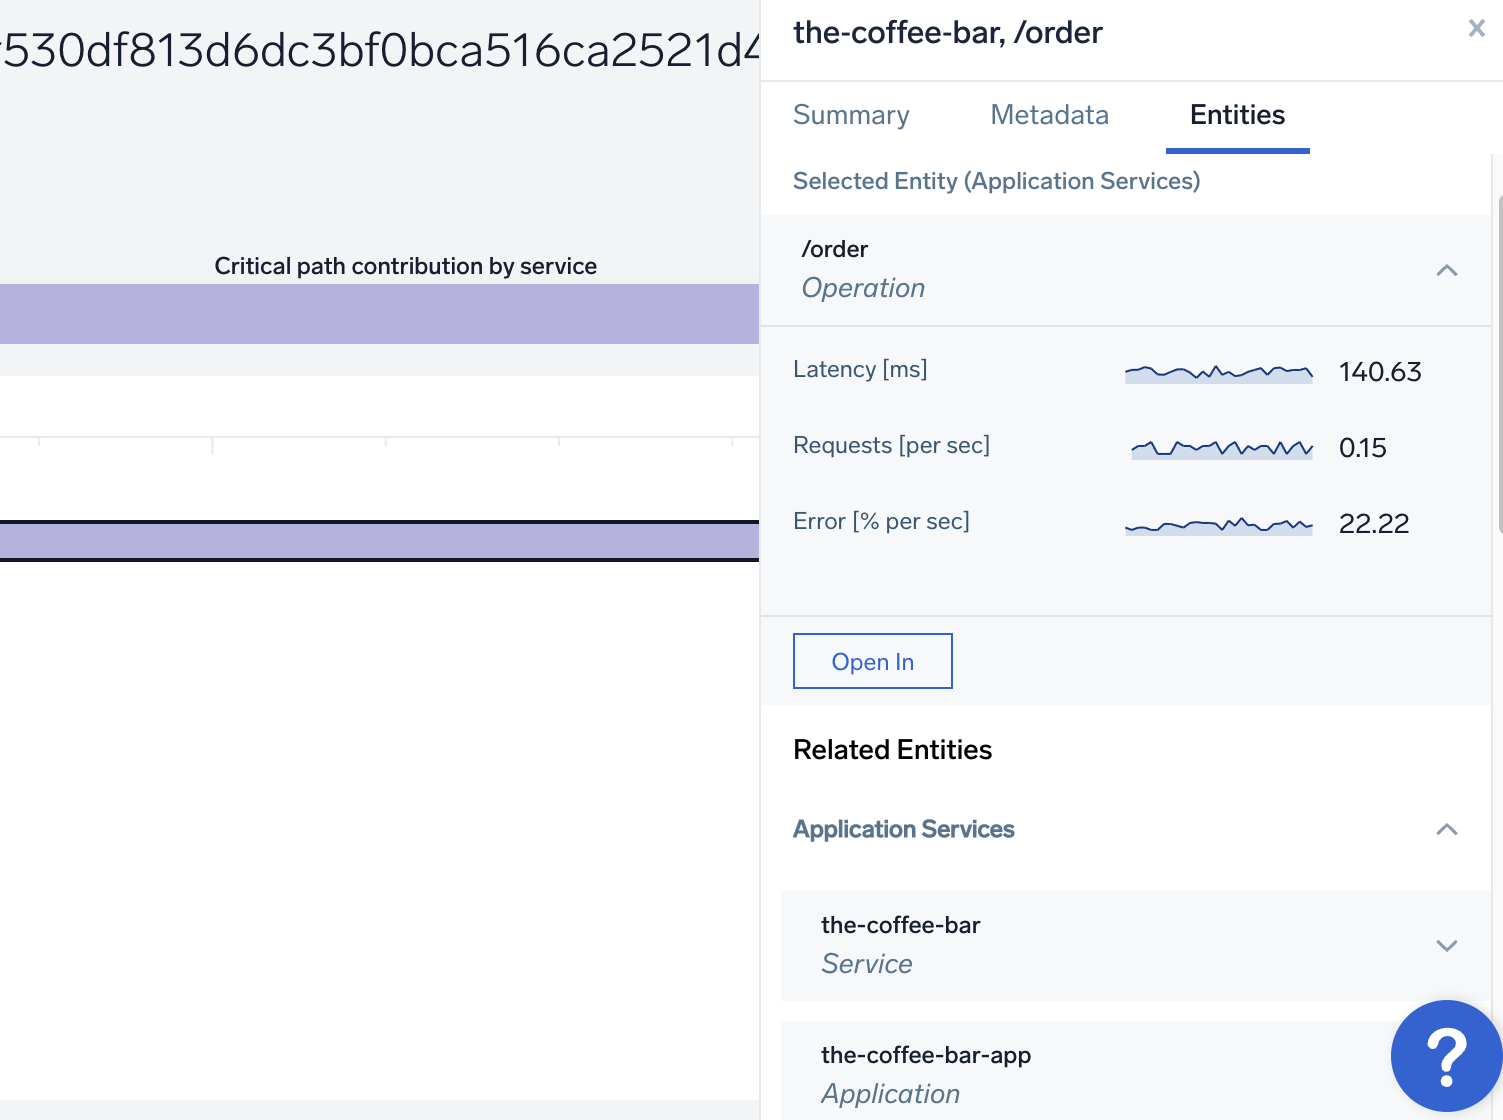
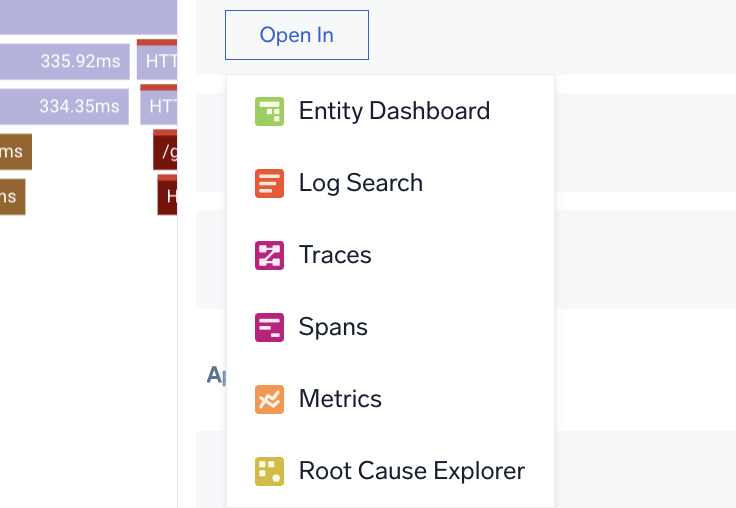
Troubleshoot links
To investigate, click the Open In button and select an icon to launch another feature against the entity or environment. An icon is not available if it is not a valid launch.
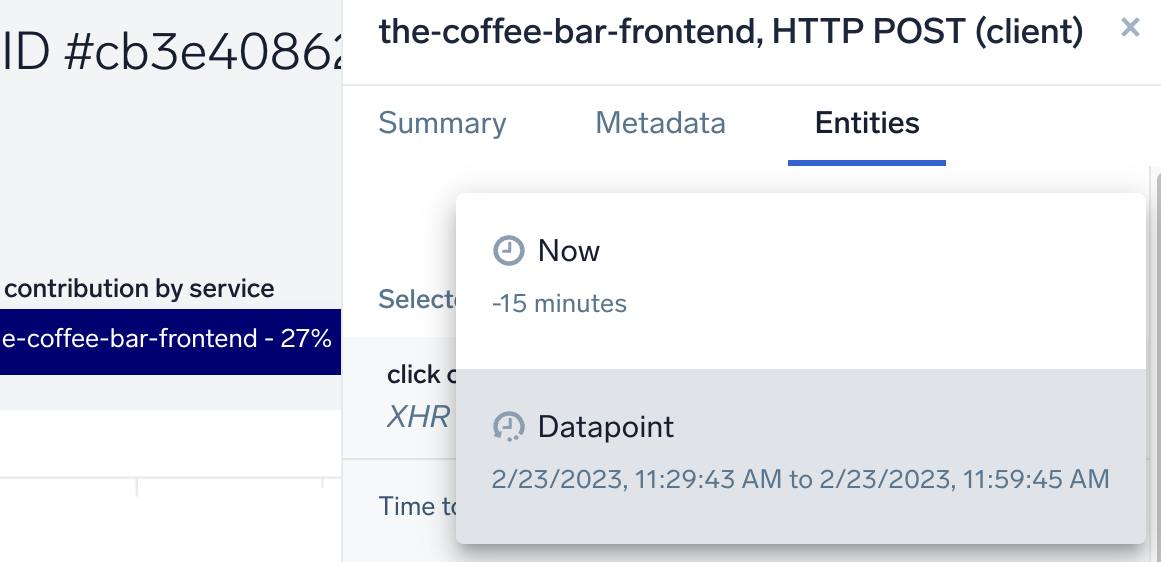
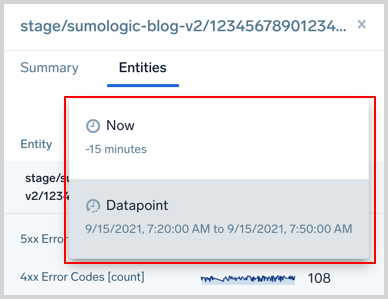
Time selector
Use the time selector to set if data is related to the "now" moment of time or the moment of time around the data point you clicked on.
If the Datapoint is the same as Now the selector will not allow you to select Now.
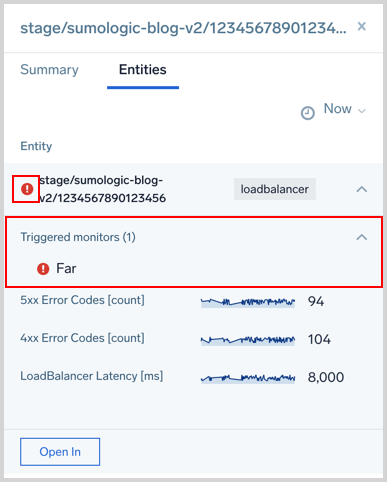
Triggered monitors
Monitors track your Metrics or Logs data in real time and send notifications when noteworthy changes happen in your production applications. The Entities tab shows any Monitors with a Critical, Warning, or Missing Data status that are tracking logs or metrics on the Entity.
Alerts are only visible when the Time Selector is set to Now.
Next to the Entity, you will see any of the following icons indicating the type of Monitor alert that has triggered.

Click the Triggered monitors row to view the related Monitors. You can click on them to view the Monitor on the Monitors page.
Limitations
- Only entity types from a curated list are identified. The AWS, Kubernetes, Traces, Application Components, and Host domains are supported.
- A few Panel types don't support the features documented on this page. You will not have the option to click on a data point to view the Summary and Entities tabs on the following Panel types: