Viewing SLO Dashboards
SLO Dashboards provide an active view into the health and status of services and systems based on your SLI and SLO configurations.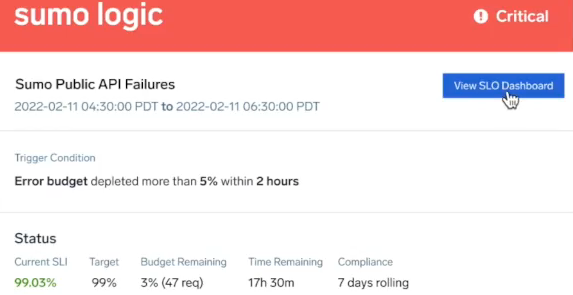
After setting up SLO monitors, you'll start receiving notifications, which you can configure to be sent to you by email, Slack channel, and other options. To begin reviewing your data for this alert in Sumo, click View SLO Dashboard.
The dashboard will load in Sumo Logic with that time period in view with vital information to begin investigating the service. For example, selecting the option for this error opens the following board. Here, we can review the current SLI and target, the remaining error budget, compliance settings, and review trending issues caught by the SLO.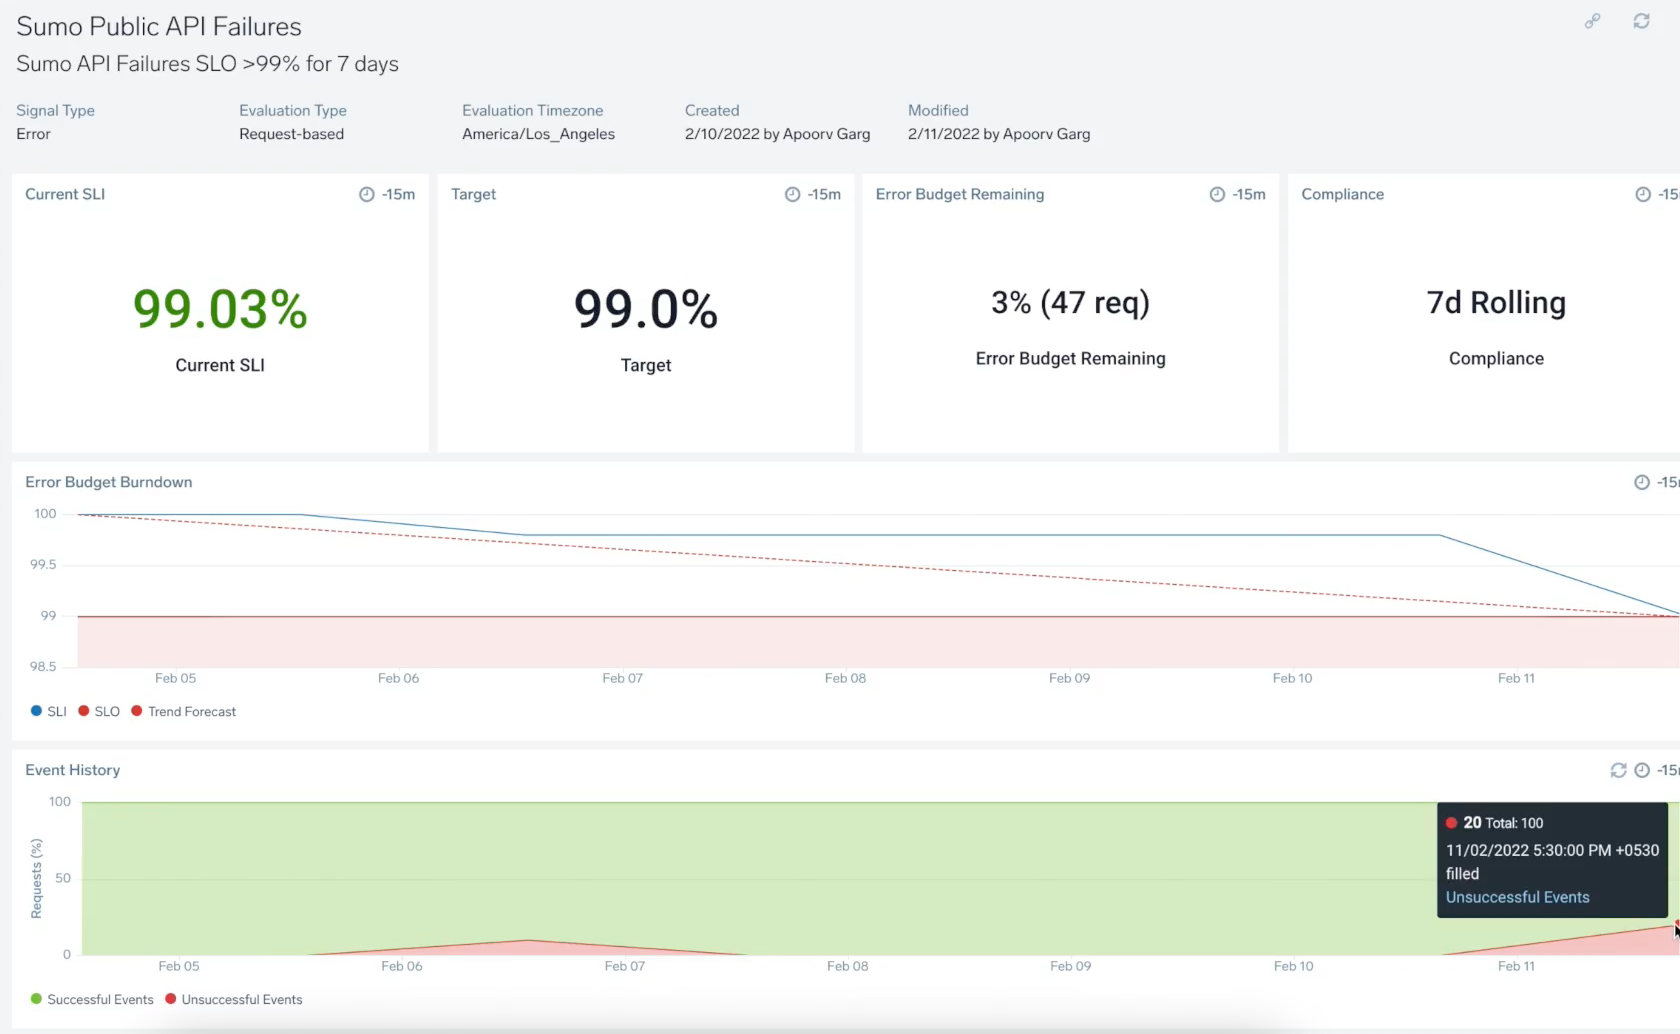
Dashboard Metrics
Each dashboard contains the following information: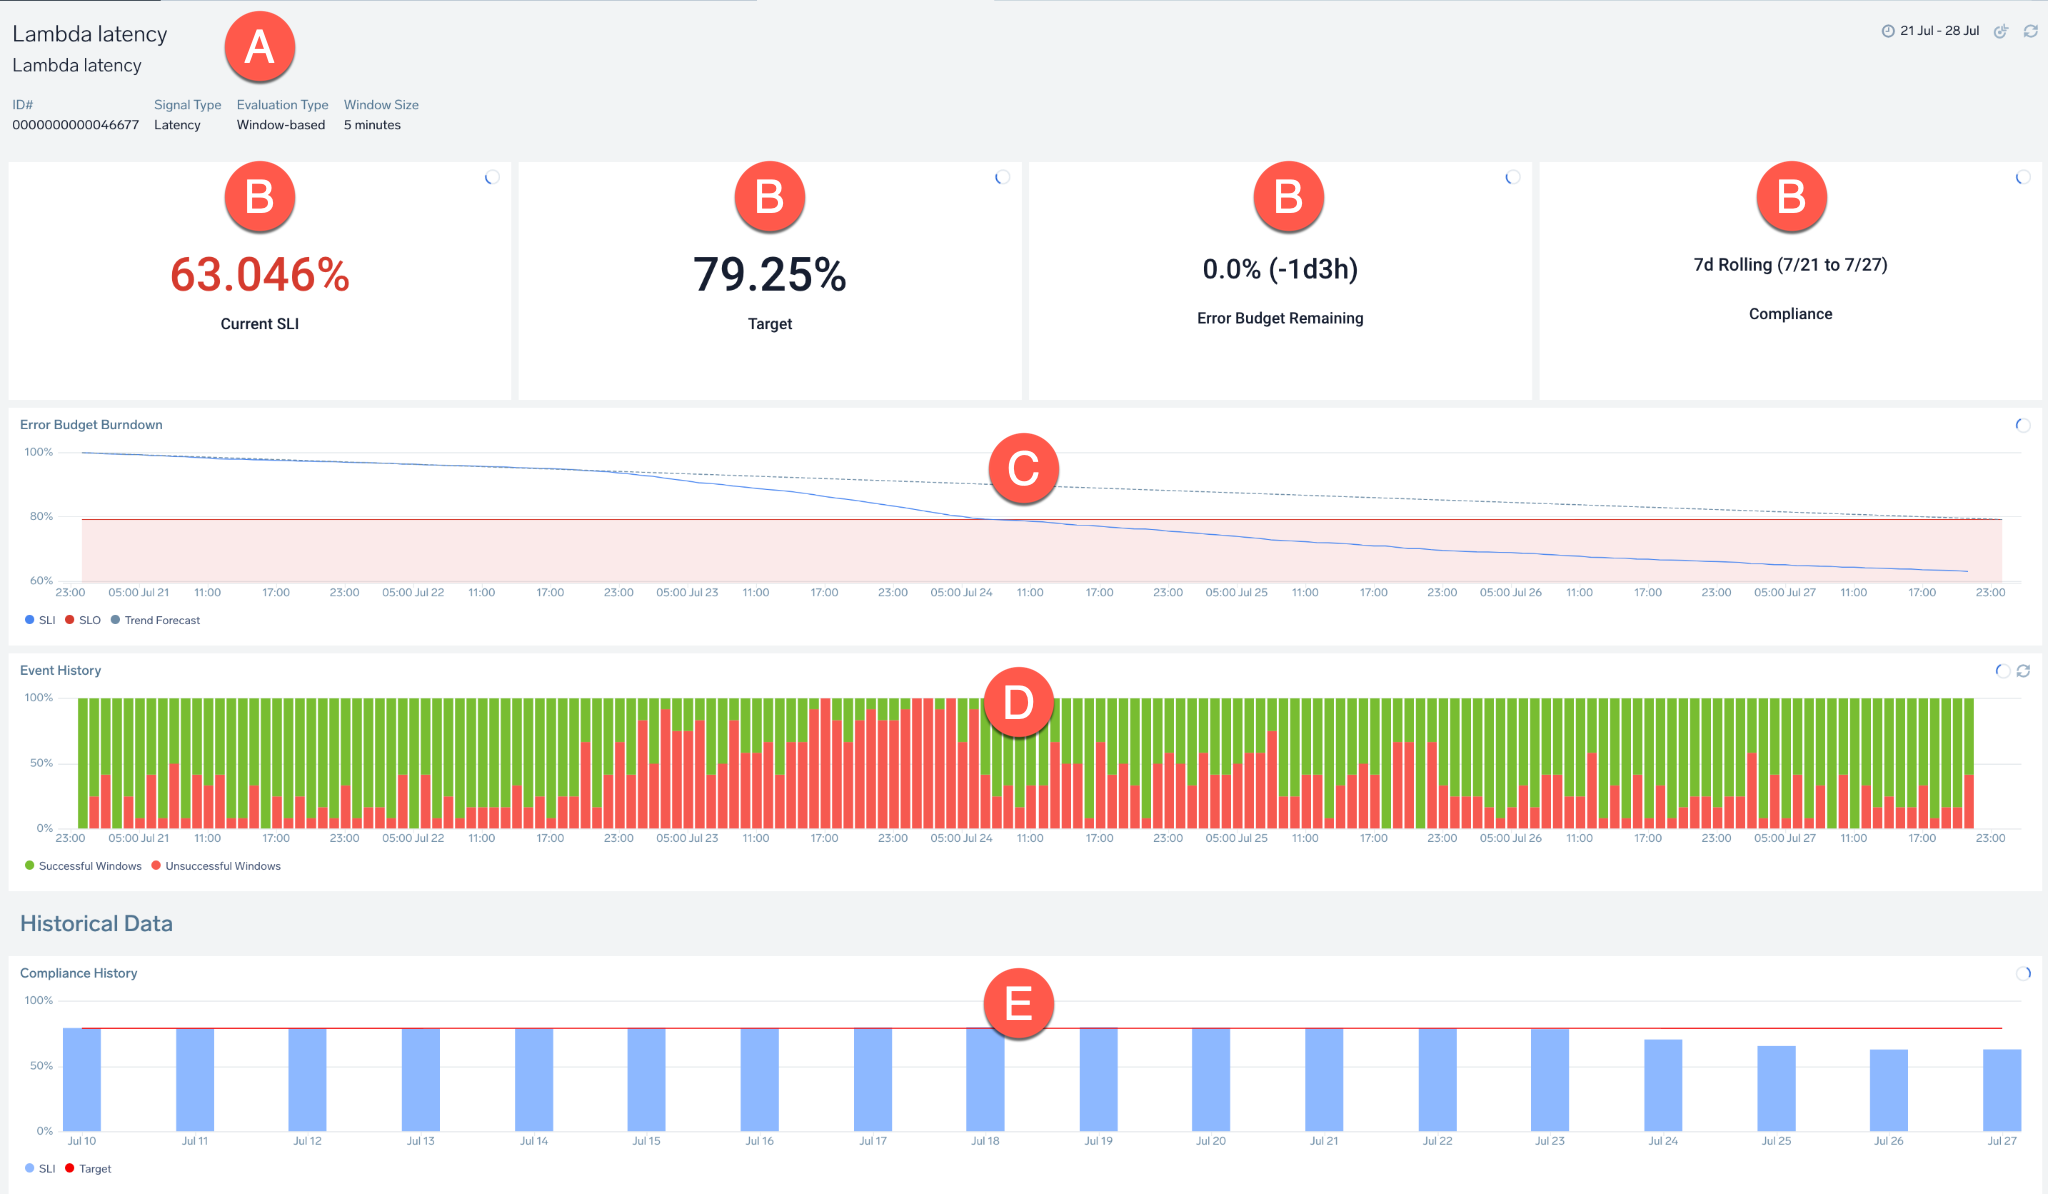
| A | General information, including the SLO name/description and SLI information:
|
| B | Panels showing:
|
| C | Error Budget Burndown: Chart tracking amount of error budget and the events that consumed it within the compliance period. Hover over any timeline to receive more information. |
| D | Event History: Tracked events that occurred during the compliance period as successful (good) and unsuccessful (bad) events. Hover over the chart to learn more about the total number of good or bad events, timeframe, and more. |
| E | Compliance History/Historical Data: Displays SLI and SLO for up to 30 compliance periods. |
Setting SLO Data Granularity
Time Ranges
To modify the time range, select and drag across dates to zoom in further. This can be useful if you want to zoom in for granular details, especially for charts with larger compliance periods.
Compliance Period
You can also filter by compliance period to view your past activity and plan ahead.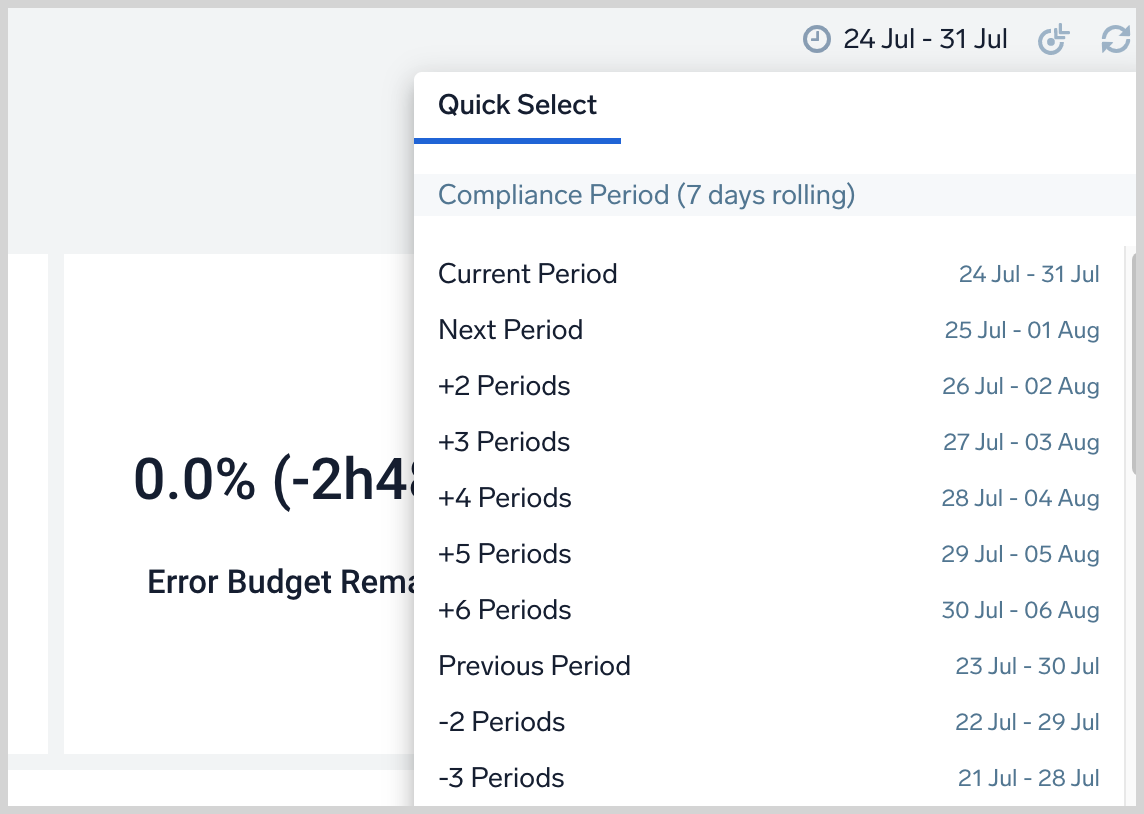
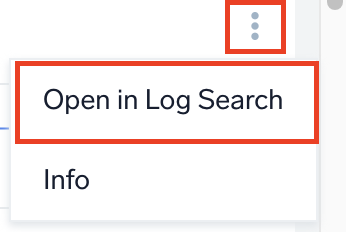
Open in Log Search
You can launch a Log Search session directly from an SLO dashboard panel, giving you the ability to drill down into further granular details.
- Go to Manage Data > Monitoring > SLO.
- Double-click on any SLO line item.
- Hover over the panel > Click the kebab icon > Open in Log Search.
Refreshing Your Data
You can also refresh individual charts or the entire page by clicking the Reset button.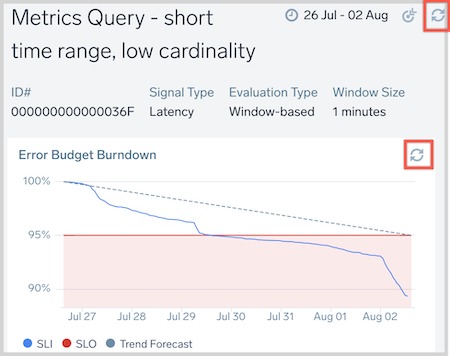
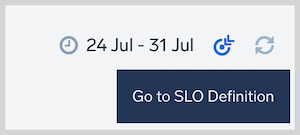
To revise or review your SLO parameters, click Go to SLO Definition to open the specific SLO.