Create an SLO
When creating an SLO, you'll need to define the following:
- SLI (service level indicator) metric you are tracking and target configuration using ratio- or threshold-based definitions
- SLO (service level objective) defining the target and duration to monitor (for example, the uptime for the target)
- Basic details for SLO name and description
You have multiple configurations for creating SLOs:
- Measurement for SLO: Windows of time or Requests.
- Query type: Metrics or Logs.
- Calculation definition: Ratio (tracked amount against a total) or Threshold. Instead of defining two queries to identify successful versus total events to create a Ratio, you can specify a Threshold for the Total Events query that identifies successful events.
The following table lists the available options for an SLO:
| Window-based | Request-based | |
|---|---|---|
| Metrics-based SLO | Ratio and Threshold | Ratio Only |
| Logs-based SLO | Ratio and Threshold | Ratio and Threshold |
Create an SLO (General)
- Click Manage Data > Monitoring > SLO tab.
- Click Add > New SLO. Optionally, you can also:
- Create folders to manage your SLOs.
- Import an SLO:
- To transfer data immediately and create an SLO using an import, you should first export JSON content to use that formatting. The Sumo Logic JSON format may change without notice. See Export and Import Content in the Library for complete details.
- Click Manage Data, then Monitoring. Select the SLO tab if not loaded.
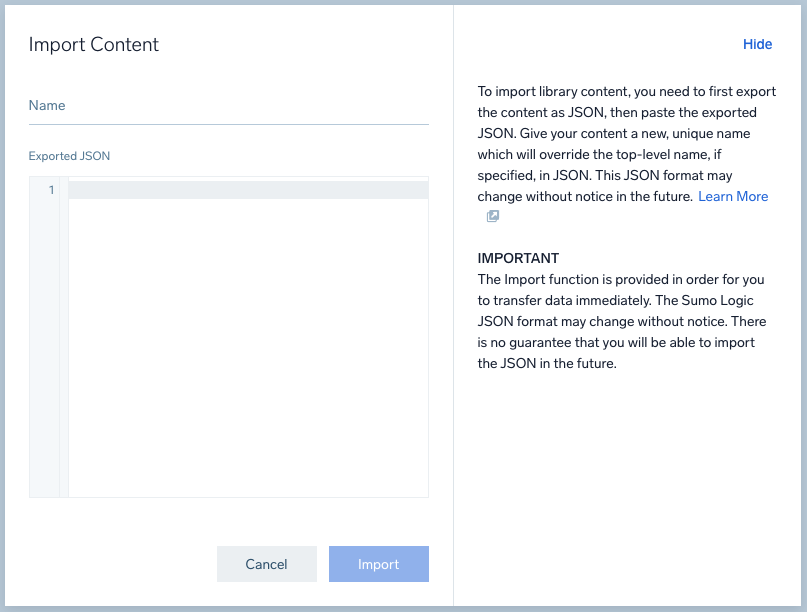
- Click Add > Import.
- Enter a Name for the SLO.
- Copy and paste the JSON in the text editor.
- Click Import.
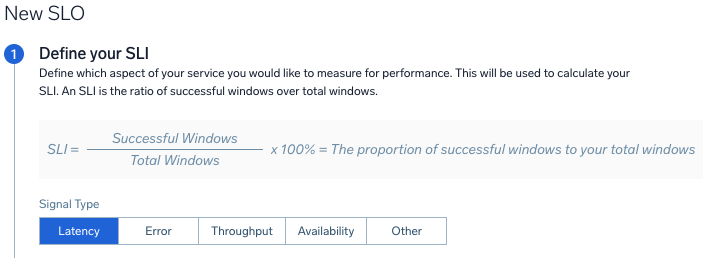
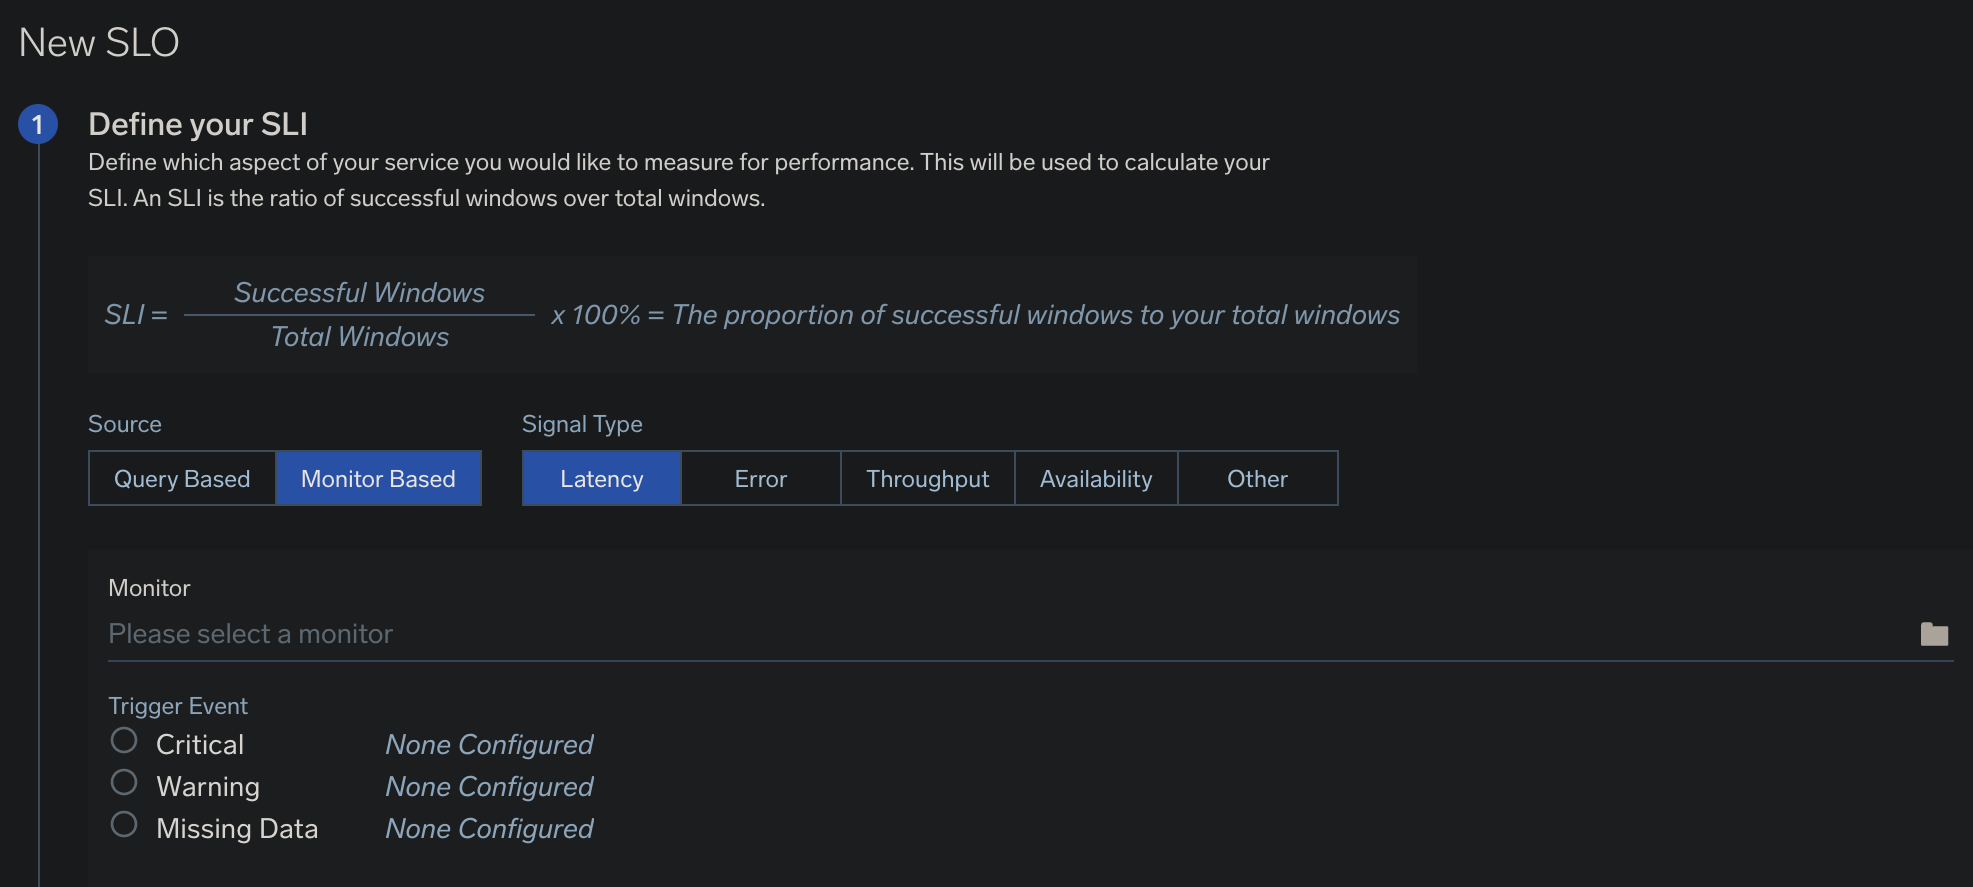
- Select the Signal Type:
- Latency. Select to calculate the speed of services, lag time.
- Error. Select to monitor for errors that occur in your services.
- Throughput. Select to track the throughput of services and processing.
- Availability. Select to monitor the uptime of services.
- Other. Select to monitor any other metric or log for SLIs.
- Select the Evaluation Type which determines how the events are measured:
- Window-based. Select the time frame window for the events. Window sizes should be between 1m to 60m.
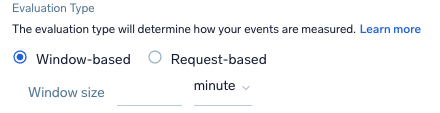
- Request-based.

- Window-based. Select the time frame window for the events. Window sizes should be between 1m to 60m.
Select the Query Type to select and build your queries for the SLI data. You have a choice of Metrics or Logs with a ratio-based (partial against the total) or threshold-based (events amount against a set threshold amount) calculation. Review Query recommendations before building.
Follow the instructions below based on the query type:
| Metrics: Ratio-based | Metrics: Threshold-based |
For Ratio-based definition, define queries for the successful or unsuccessful events to calculate against total events:
| For Threshold-based definitions, which calculate against success criteria:
|
| Logs: Ratio-based | Logs: Threshold-based |
For Ratio-based definitions, which calculate successful or unsuccessful events against total events:
| For Threshold-based definitions, which calculate against success criteria:
|
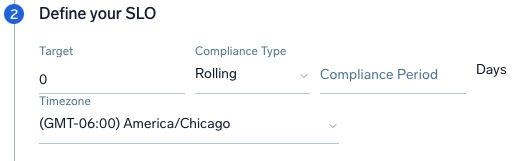
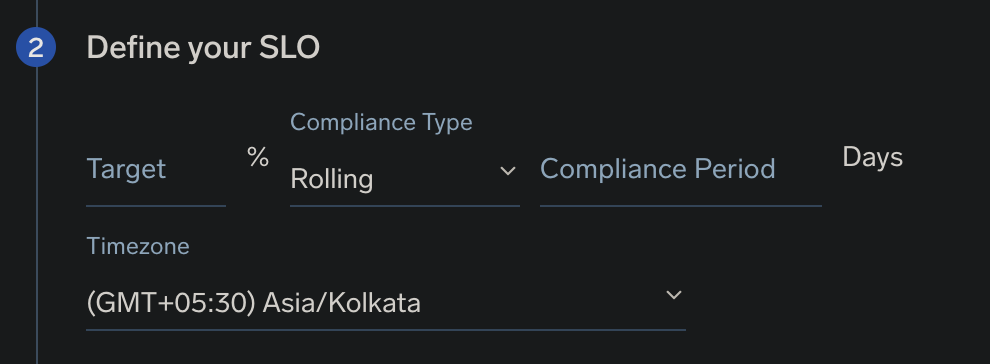
- Define your SLO for target amount and duration period to monitor:
- Target. The value in percentage you want to target for the SLO, for example 99 for 99%.
- Compliance Type. Rolling provides a sequence of recent days for the Compliance Period, such as the last 7d or last 30d. Calendar calculator over a window of time for a Week.
- Timezone. Select a timezone. This is important to accurately assign events on the boundary of a compliance period, such as events received at 11:59 PM in a particular time zone.
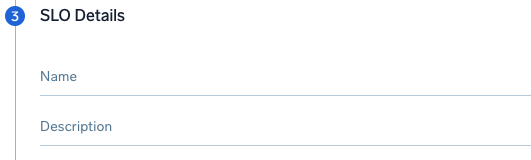
- Enter SLO Details, including a Name and Description. This is used in the list and for searches.
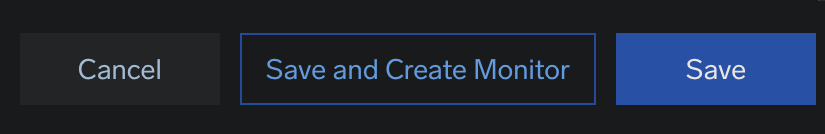
- Click Save. To create a monitor, click Save and Create Monitor.
Create a Logs-based SLO
You can create SLOs directly from your Sumo Logic log search. This allows you to validate queries, quickly create SLOs, and re-use queries from existing dashboard panels.
- Enter a new Log search query (or use an existing one).

- Click the More Actions (kebab icon) dropdown menu.
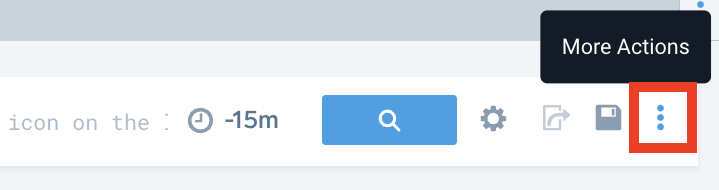
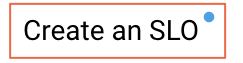
- Click Create an SLO.
Create a Metrics-based SLO
You'll be able to create SLOs from Metrics Explorer.
Create a Monitor-based SLO
Critical Monitors are great candidates to convert to SLOs. From the Monitors section, you can create a Monitor- and window-based SLO for a given trigger condition.
As an example, say you have an existing Monitor that fires a Critical alert if the latency of a customer-critical service exceeds 500ms. By creating an SLO directly through this specific Monitor, those thresholds will automatically carry over into the new SLO, saving you time and effort.
Your Monitor must be in an active state.
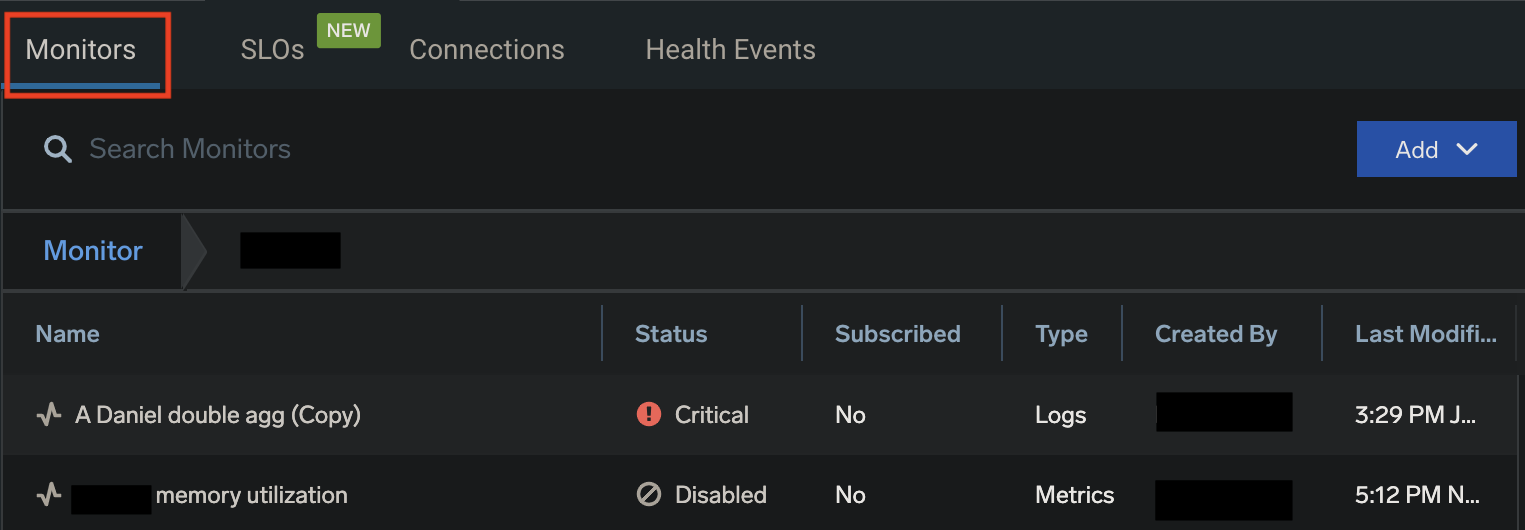
- Go to Manage Data > Monitoring > Monitors tab.
- Click on any active Monitor to open its panel.
- Choose one of the methods below:
Click More Actions > Create SLO.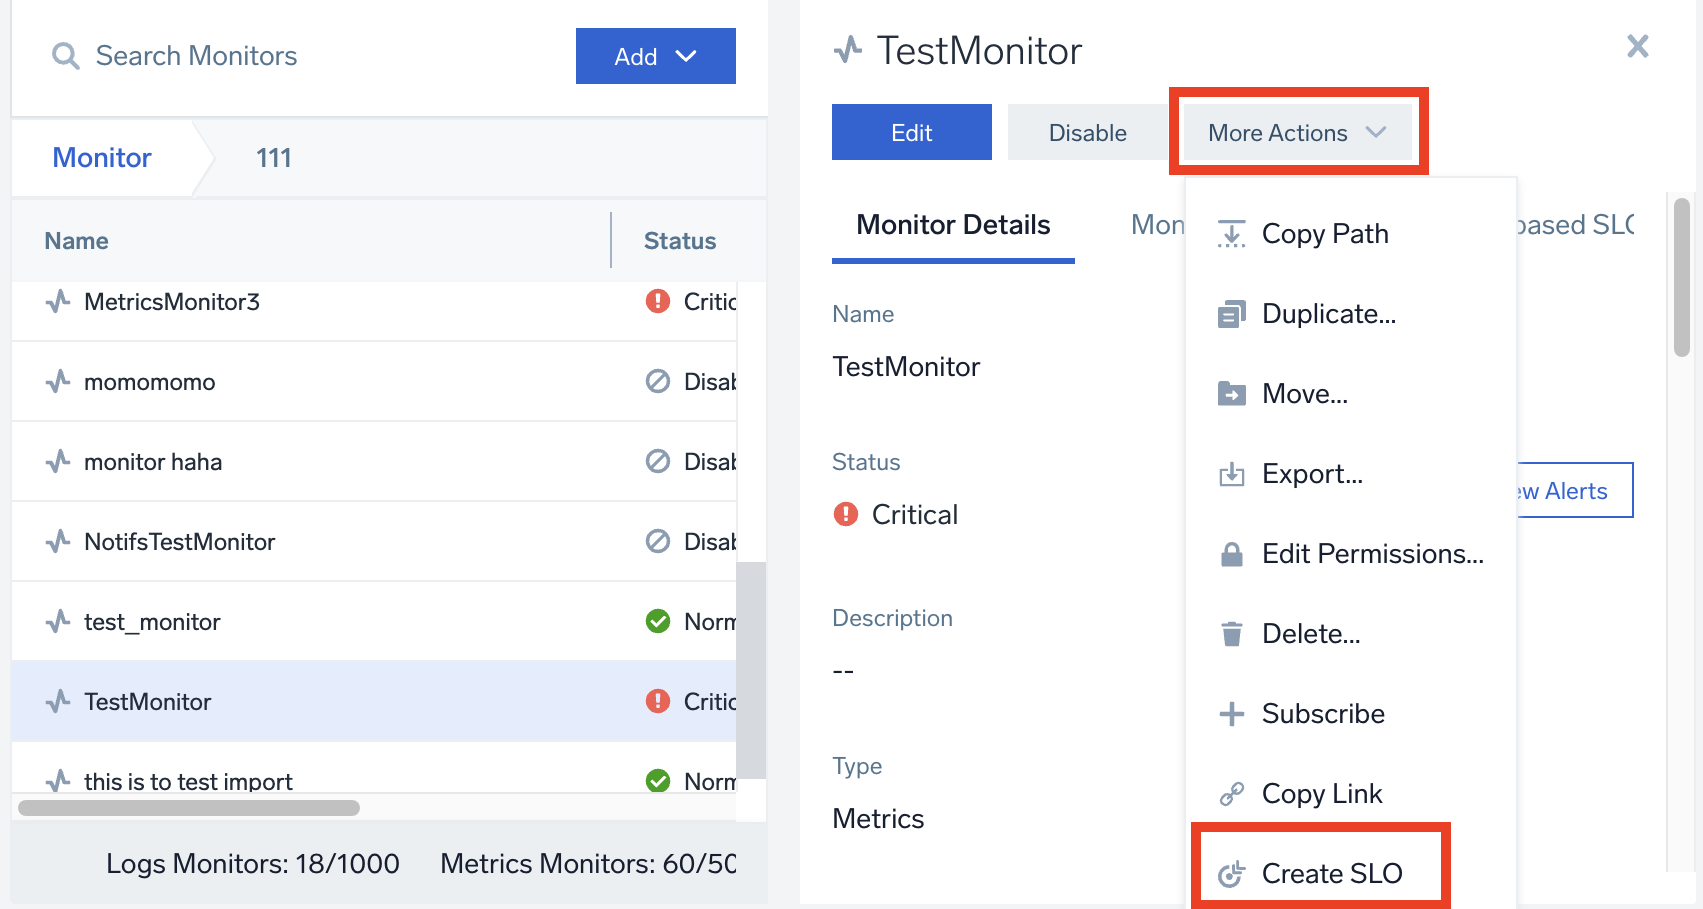
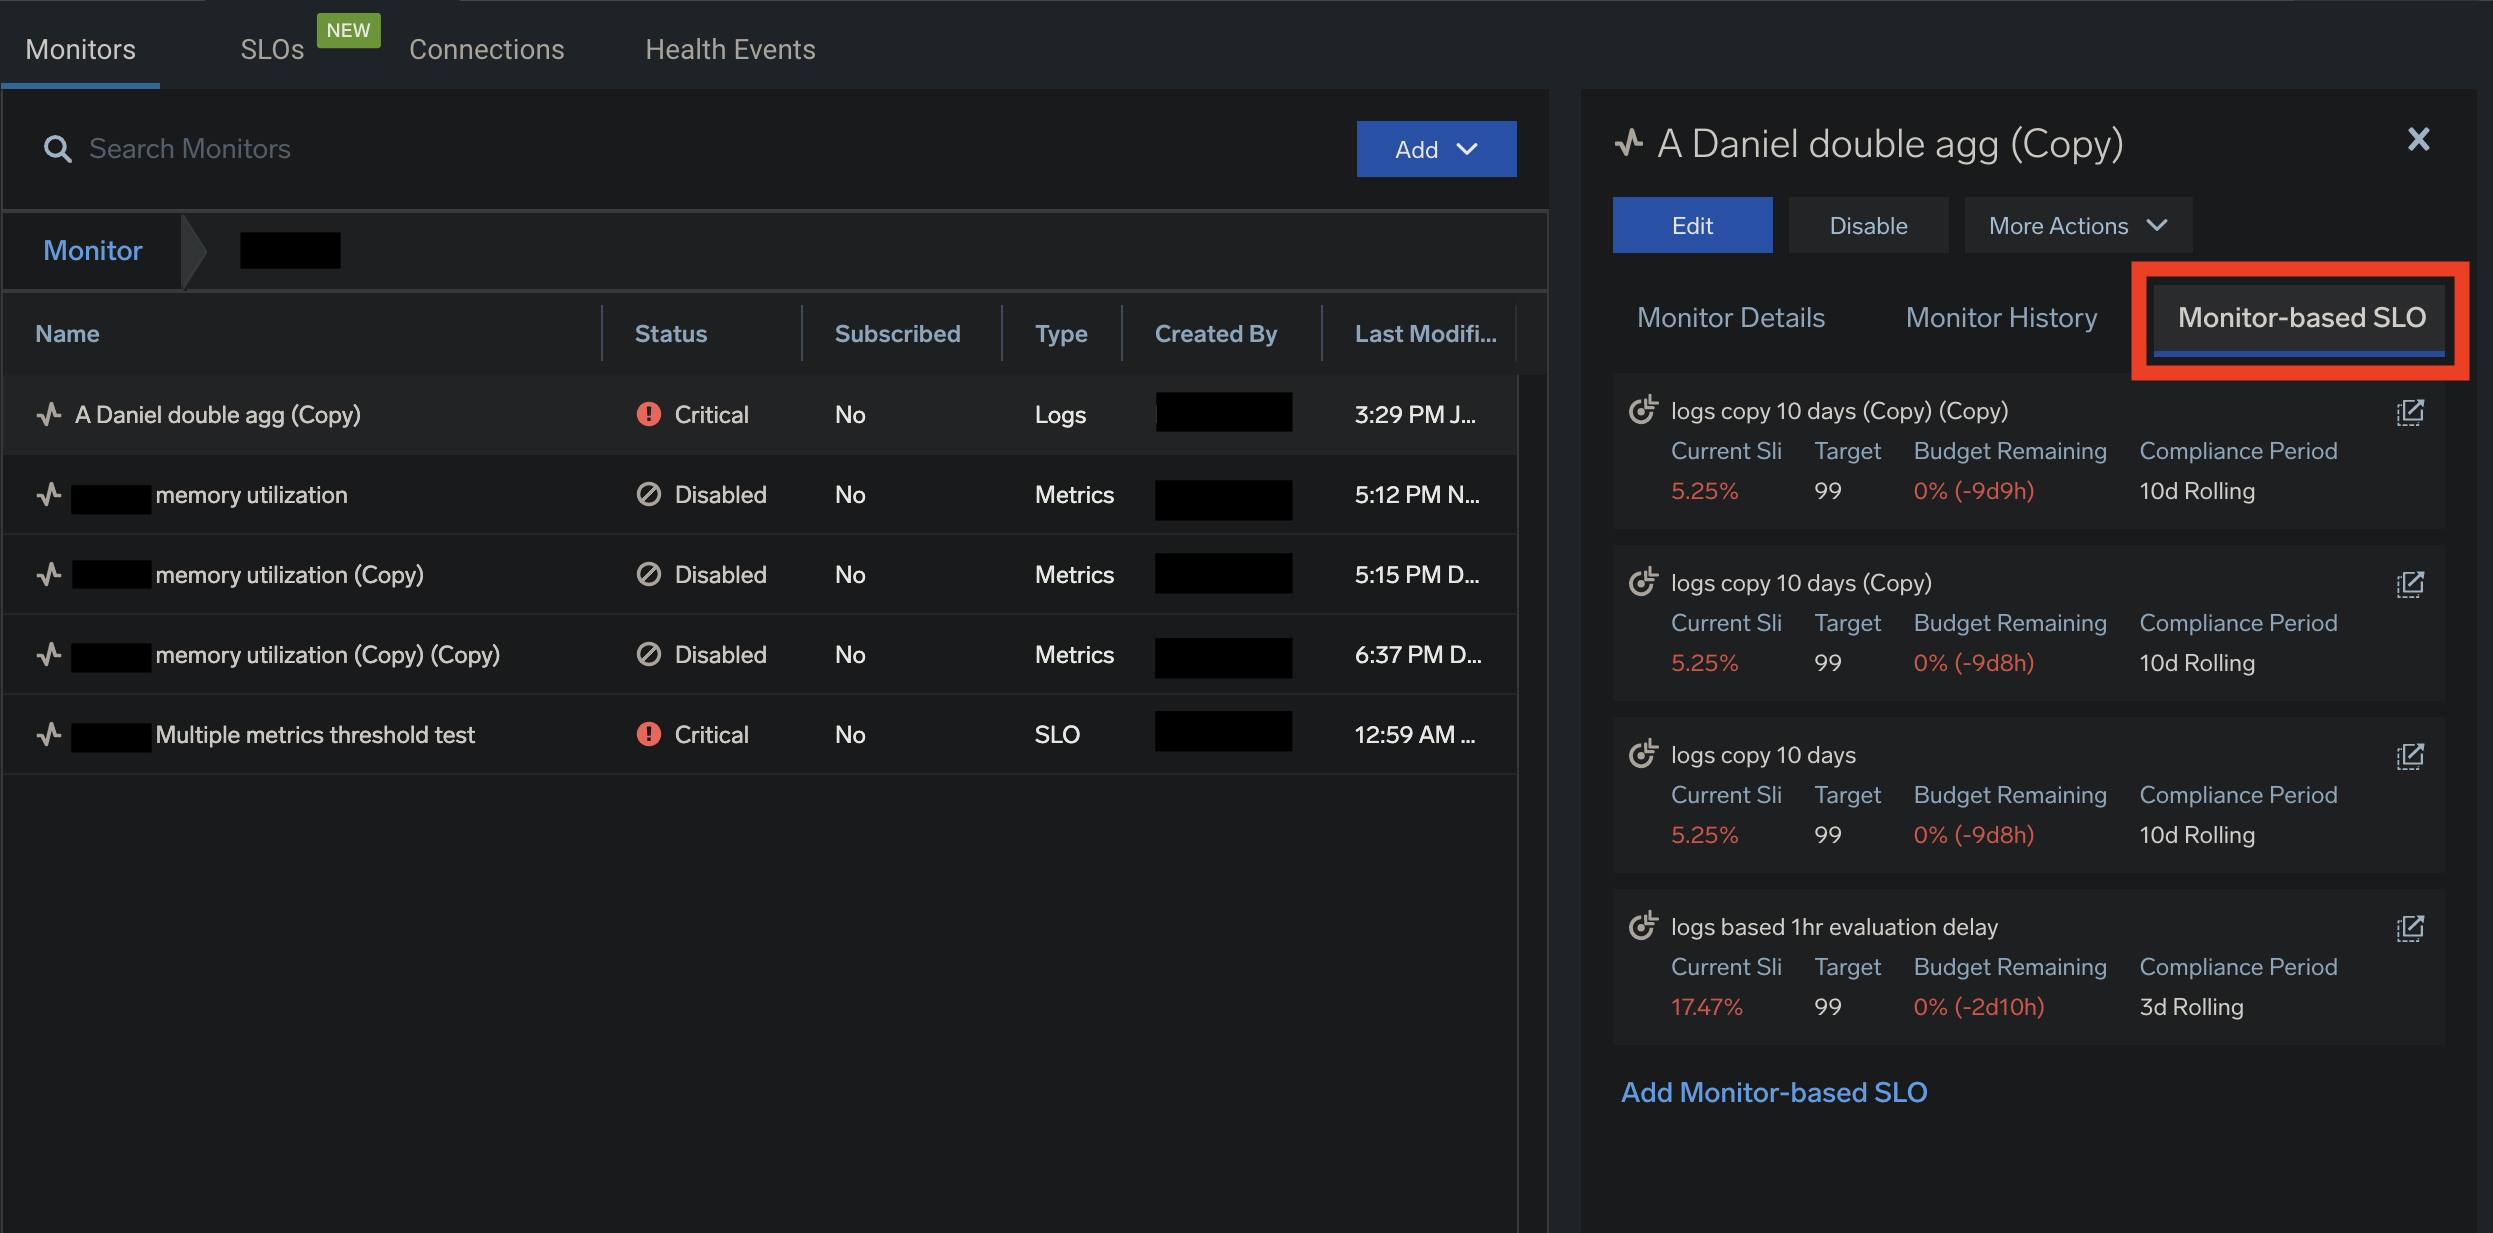
Or, click Monitor-based SLO > Add Monitor-based SLO.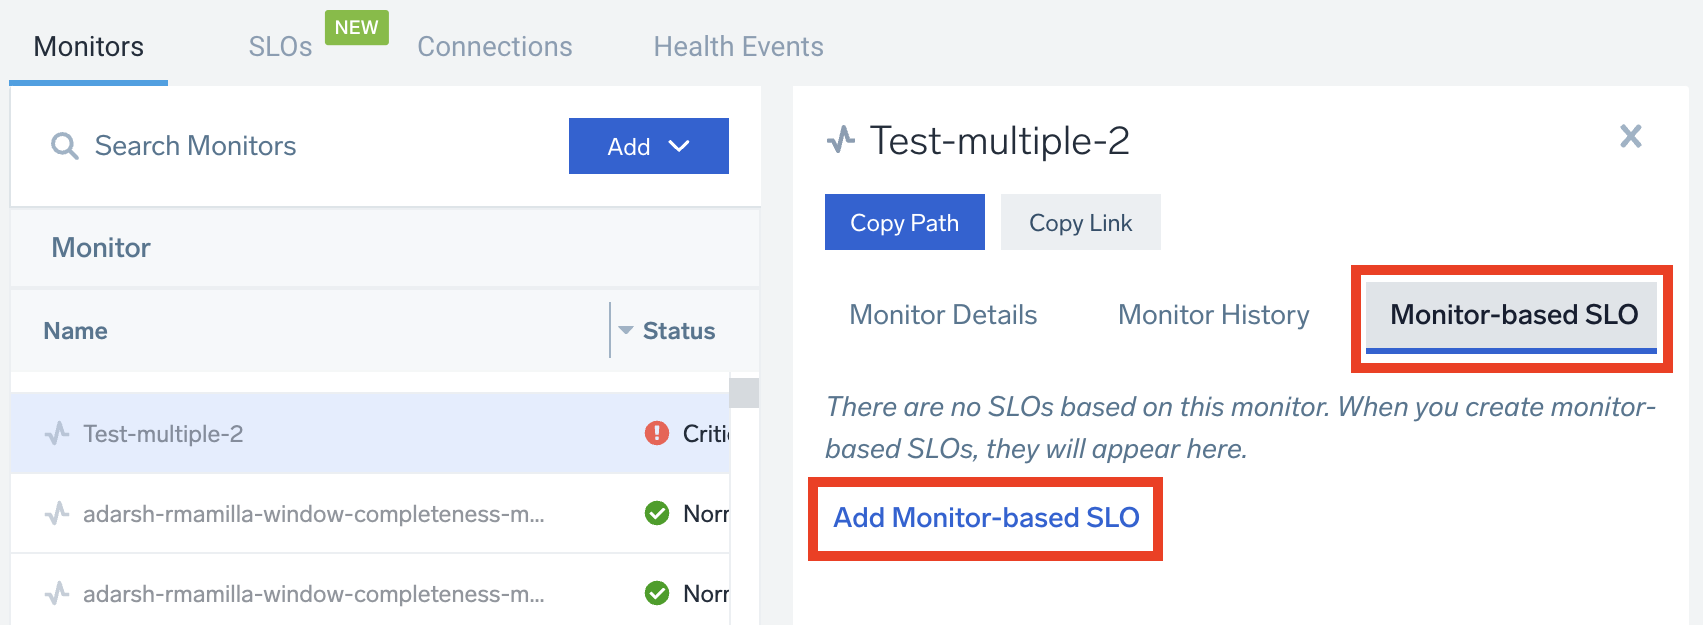
This will open the New SLO window. - Define your SLI. Your Monitor's Source, Signal Type, and Trigger Event settings will auto-populate here (you can override these if you need to).
- Define your SLO. Set your window-based threshold here.
- When you're done, click Save, which will save the SLO.
To edit SLO parameters:
- Go to the SLO tab, locate your SLO and click on it. (If you're unable to find it, try applying filters or go to the search bar at the top and enter the SLO name or folder name.)
- Edit definition and other parameters.
To edit SLO parameters from a Monitor:
- Go to the Monitors tab and click on any Monitor.
- In the panel, click Monitor-based SLO to view the list of SLOs associated with that particular Monitor.
Any Monitor update that changes the Monitor definition will lead to a change in the version of related SLOs. This means that the SLO history or SLI will get reset for the SLO. Example include trigger condition changes and evaluation delay changes. Changes unrelated to the definition like Name, Description will not affect the related SLOs.
SLI calculation for Monitor-based SLOs
SLIs for Monitor-based SLOs are calculated at a granularity of 1 minute. A minute is treated as unsuccessful if the Monitor threshold is violated at any point of time within that minute.
Create an SLO Monitor
- Alert Responses are not yet supported for SLO-based Monitors. Notifications will provide information and links to SLO dashboards.
- It is not possible to create an SLO on top of an SLO Monitor.
Create one or more Monitors as needed for your SLO. We recommend creating separate Monitors for SLI-based and Burn Rate-based condition types. You can access SLO Monitors through your SLO Details or from the Monitors list page.
You will receive notifications according to Monitor configurations, such as email messages and Slack channel posts. Use the variable {{SloDashboardUrl}} in your connection payloads, which will generate an SLO dashboard link in notifications. This variable will be included automatically in email notifications.
The Alert Response page is not supported for SLO-based Monitors at this time. Notifications will provide access to the SLO dashboard when warning and critical triggers occur.
Monitor notifications may auto-resolve. See Auto-Resolving Notifications for details according to the evaluation type (Windows or Request) and compliance type (Calendar or Rolling).
You can create one condition type for your SLO Monitor, either an SLI trigger or Error Budget trigger. You can create one condition type for your SLO Monitor, either a SLI condition or Error Budget condition. We support configuring a threshold value per critical and warning trigger for that condition type.
You have two options to create an SLO Monitor:
- Select Save and Create Monitor when creating an SLO.

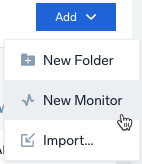
- Go to the Monitors tab, select Add > New Monitor, then select the SLO option.
When you click Save and Create Monitor, a New Monitor dialog loads:
For the Monitor Type, select SLO. When creating from the Monitors tab, select an SLO from the dropdown menu. A preview of the SLO loads on the page.
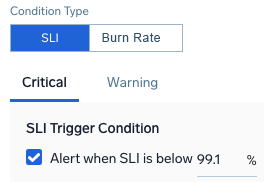
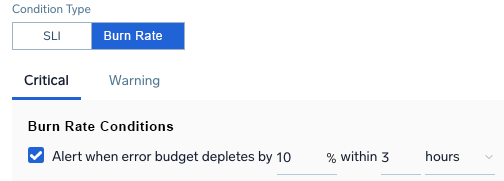
Select and configure a Condition Type:
- For the SLI Condition Type, you can select to alert when the SLI is below an entered percentage, as it nears your SLI target. For example, you could set this to 99.1% to raise a critical alert when it is getting close to a target of 99%.
- For the Burn Rate Condition Type, create an alert indicating Critical and Warning conditions based on burn rate or the rate at which error budget is depleted. Enter a percentage depleted within an amount of minutes, hours, or days. For example, a critical alert for 10% depletion within 3 hours indicates the error budget is depleting quickly.
- For the SLI Condition Type, you can select to alert when the SLI is below an entered percentage, as it nears your SLI target. For example, you could set this to 99.1% to raise a critical alert when it is getting close to a target of 99%.
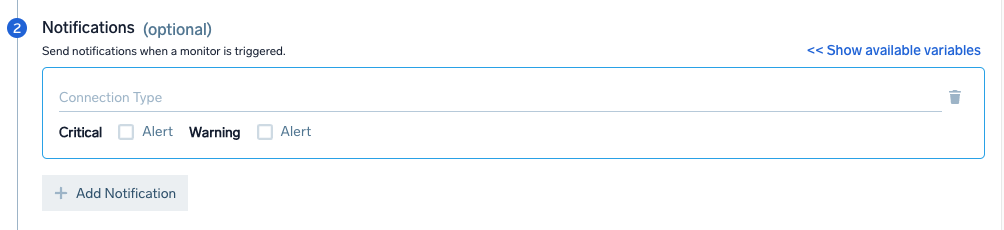
Under Notifications, select your preferred Connection Type for sending messages via email, Slack, webhook, or other methods. Select Alert and/or Recovery to notify for Critical and Warning triggers. You can add as many notifications as needed. A message is sent with a link to the SLO dashboard to investigate.
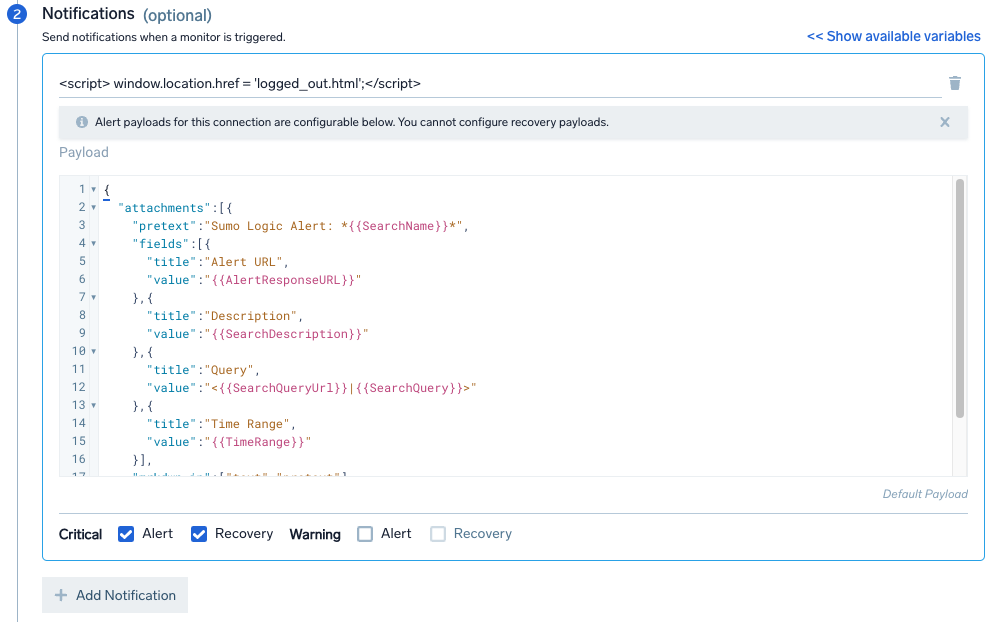
For example, to set up a Slack notification, select Slack from the dropdown menu and edit the Payload as needed. The following information shows the default settings:
For Monitor Details, enter the following information:
- Name. Name for the Monitor.
- Location. Path for the Monitor, default is /Monitor.
- Description. Optional description for the Monitor.
- Playbook. Optional playbook for handling these Monitors and situations if an issue occurs.
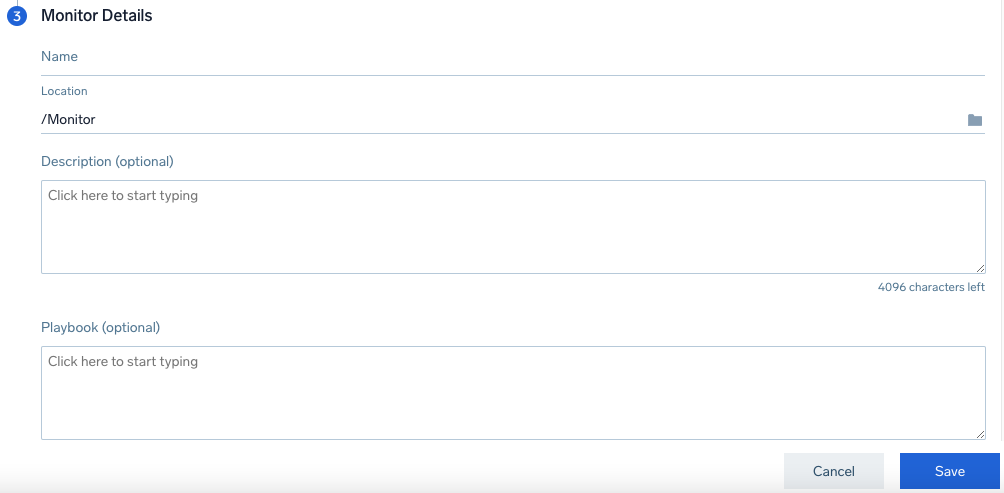
Click Save.
Auto-Resolving Notifications
SLO Monitors in a triggered state can auto-resolve. See the following table for details.
| EvaluationType | ComplianceType | MonitorConditionType | Auto-resolves |
| Window | Calendar | SLITrigger | No. SLI never recovers within the same compliance period as the triggered alert, but it can recover in a different compliance period. So the Monitor can auto-resolve then. New alert is created for each compliance period. Monitor status is based on latest compliance period’s alert status. |
| Window | Calendar | ErrorBudgetTrigger | Yes, if the error budget consumed is less than the alert threshold for a complete detection window. Resolution behavior is same as log monitors. |
| Window | Rolling | SLITrigger | Same as “Window-Calendar”. Separate alert is triggered for each compliance period. |
| Window | Rolling | ErrorBudgetTrigger | Same as “Window-Calendar”. |
| Request | Calendar | SLITrigger | Yes, when SLI value goes above alert threshold. A new alert is created for each compliance period. Monitor status is based on the latest compliance period’s alert status. |
| Request | Calendar | ErrorBudgetTrigger | Same as “Window-Calendar”. |
| Request | Rolling | SLITrigger | Same as “Request-Calendar”. Separate alert for each compliance period. |
| Request | Rolling | ErrorBudgetTrigger | Same as “Window-Calendar”. |
Notification Example
When a notification is sent, it includes information from the alert and a link to load the dashboard. Below is an example of a critical alert email notification. See SLO Dashboards for information.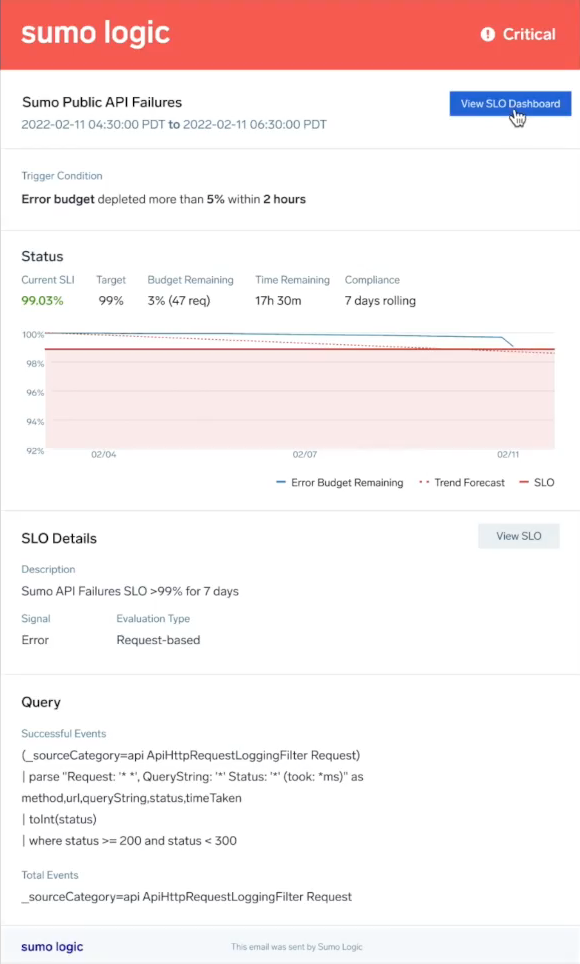
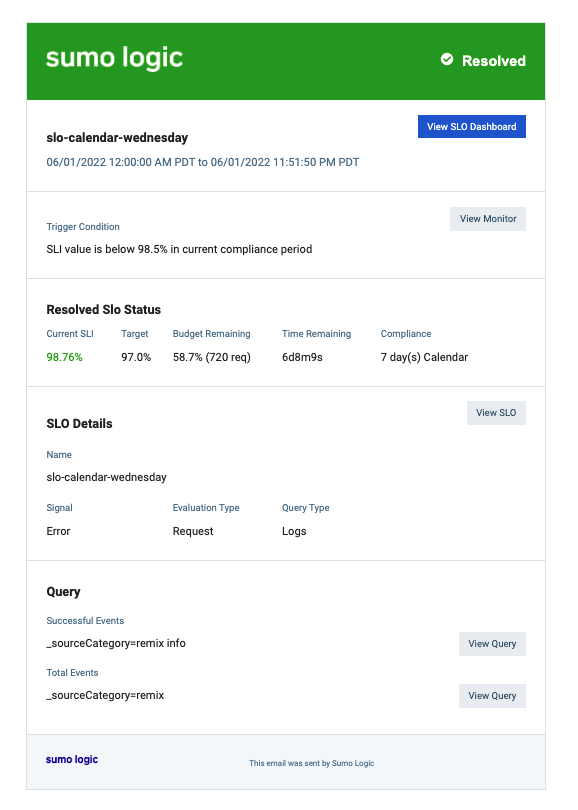
Resolution Email Example
Installing AWS SLO Alerts via Terraform
AWS ELB users can now install Sumo Logic out-of-the-box SLOs and associated Monitors using this Sumo Logic Terraform script.
The script allows you to install Sumo Logic SLOs in your specified AWS ELB directory and configure SLO alert notifications (e.g., latency limit breached, server error limit breached). Once installed, you can view and edit your SLO alerts via Terraform or from your Sumo Logic Monitors page.
SLO as Code
You can use the Sumo Logic Terraform provider to automate SLO folder and SLO creation. This can be useful for organizations that want to templatize SLOs, standardize SLO configuration, Monitors and dashboards and automate SLO-related workflows.
Use the Monitor Terraform provider to create Monitors associated with SLOs.
SLO as Log Messages
Sumo Logic continuously computes data for your SLO behind the scenes. This data, which powers your SLO dashboard, is also made available as log messages that conform to the following schema:
Time: timestampsloId: Id of the SLO, as displayed in the SLO dashboard URLgoodCount: count of good requests, for request-based, and good windows for windows-based SLOs, based on SLO query definitiontotalCount: count of eligible requests for request-based, and eligible windows for windows-based SLOs, based SLO query definitionsloVersion: version of SLO definition
View the schema by executing the following query:
_view=sumologic_slo_output sloId="<your-SLO-ID>"
| where [subquery: _view=sumologic_slo_output sloId="<your-SLO-ID>"
| max(sloVersion) as sloVersion | compose sloVersion]
-- (replace with a valid SLO Id)
These log messages will be delayed by one hour, as the system ensures consistency to account for ingest delay of source telemetry.
SLO Lookup Tables
You can call a SLO Lookup Table to view all SLO metadata in your environment. These tables reside under a fixed path, sumo://content/slos. Data is managed and refreshed automatically on our end.
There are two ways to use it:
- To join the results of your SLO precomputed data from
_view=sumologic_slo_outputwith your metadata contained in the internal lookup table based on the joining key (sloId,sloVersion):_view=sumologic_slo_output
| lookup * from sumo://content/slos on sloId, sloVersion - To enlist the contents of the lookup table:
cat sumo://content/slos
As an example, say you had a SLO dashboard and wanted to see error budget burndown from several of your apps and services combined.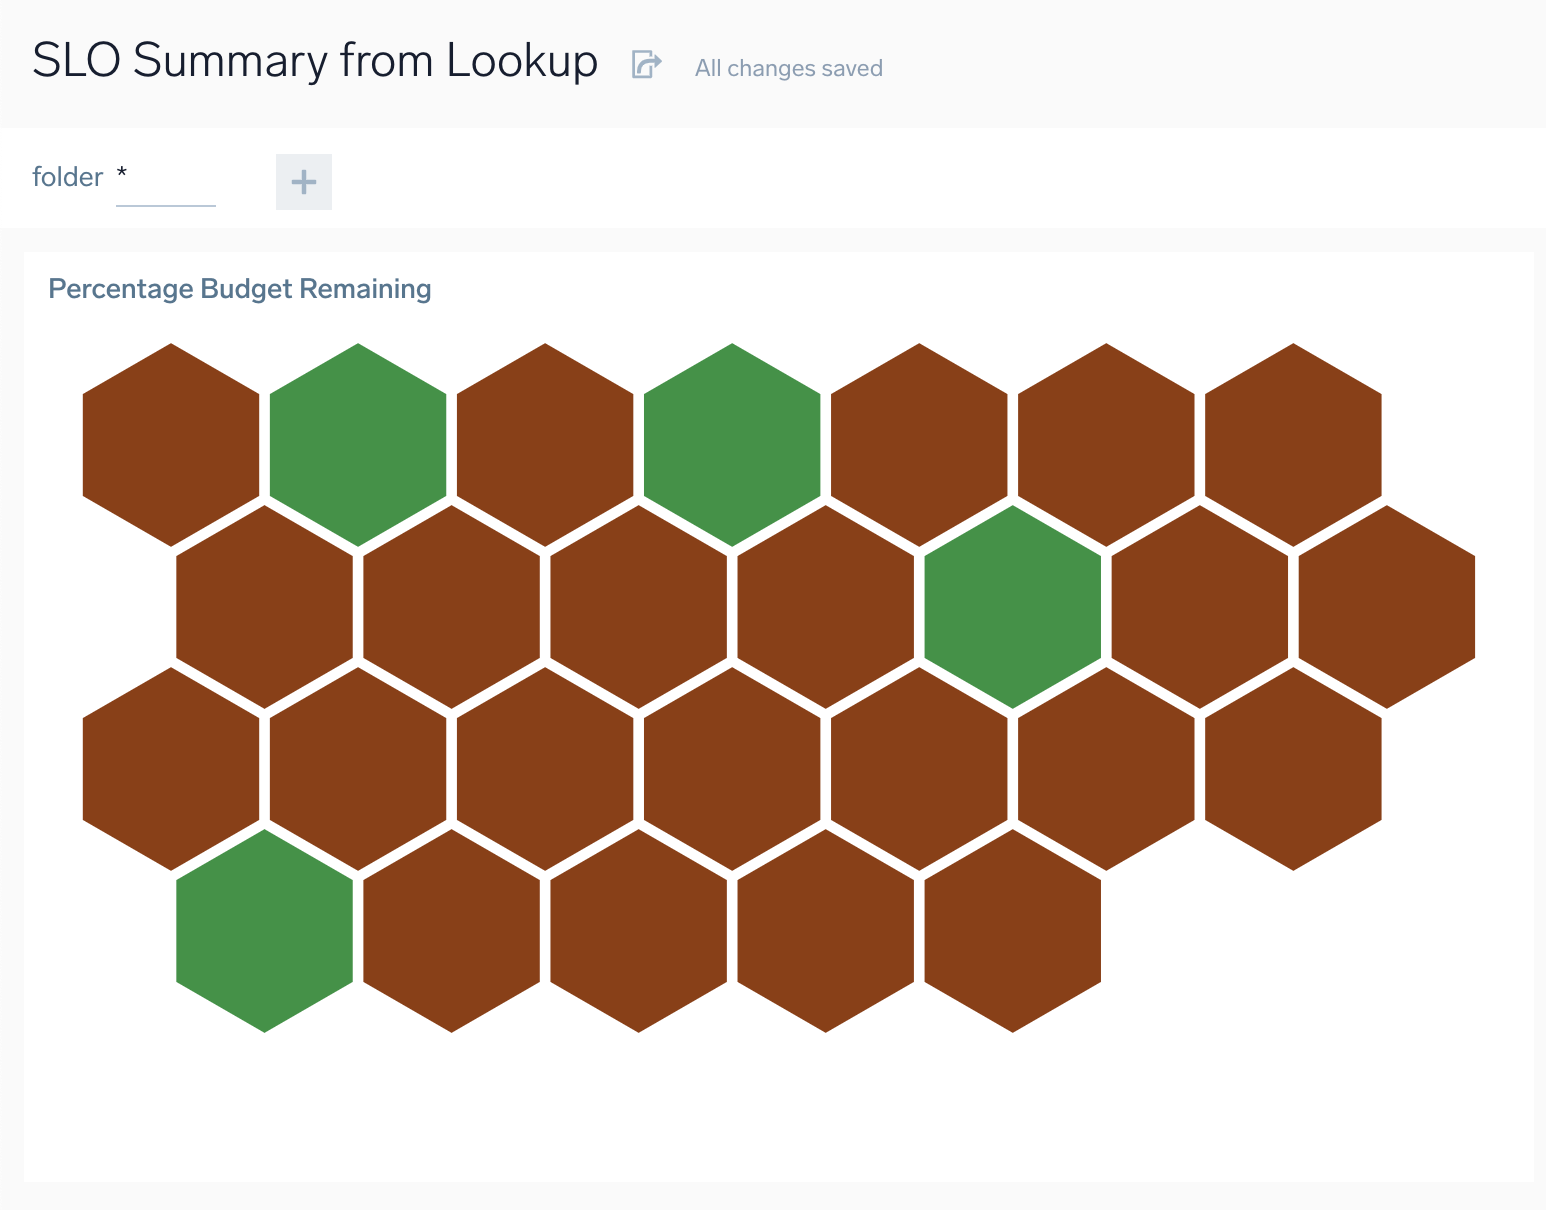
You would need to create a custom graphic that combines multiple SLOs from multiple services:
- Go to Manage Data > Monitoring > SLO.
- Click on any SLO line item.
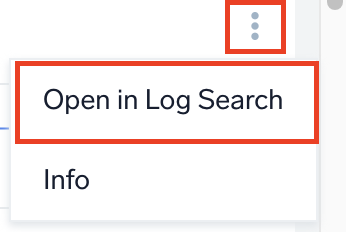
- Hover over the Percentage budget remaining panel, then click the three-dot icon > Open in Log Search.
- In the search field, enter the following snippet. This will join data from multiple sources for your lookup table.
_view=sumologic_slo_output
| lookup * from sumo: //content/slos on sloId, sloVersion
| where !isBlank (sloname) and slofolderpath matches "*"
| concat (sloname, " (", sloId, ")") as sloUniqueName
| sum (goodCount) as goodEvents, sum(totalCount) as totalEvents, last (compliancetarget) as target, last(slofolderpath) as sloPath, last(sliwindowsize) as sliwindowsize, last(slievaluationtype) as evaluationType by s1oUniqueName
| totalEvents - goodEvents as badEvents
| if (evaluationType = "Window", queryTimeRange() / 1000 / sliwindowsize, totalEvents) as denominator
| 100 * (1 - badEvents / denominator) as sli
| 100 * (sli - target) / (100 - target) as budgetRemaining
| fields sloUniqueName, budgetRemaining - Click Add to Dashboard.