RabbitMQ - OpenTelemetry Collector
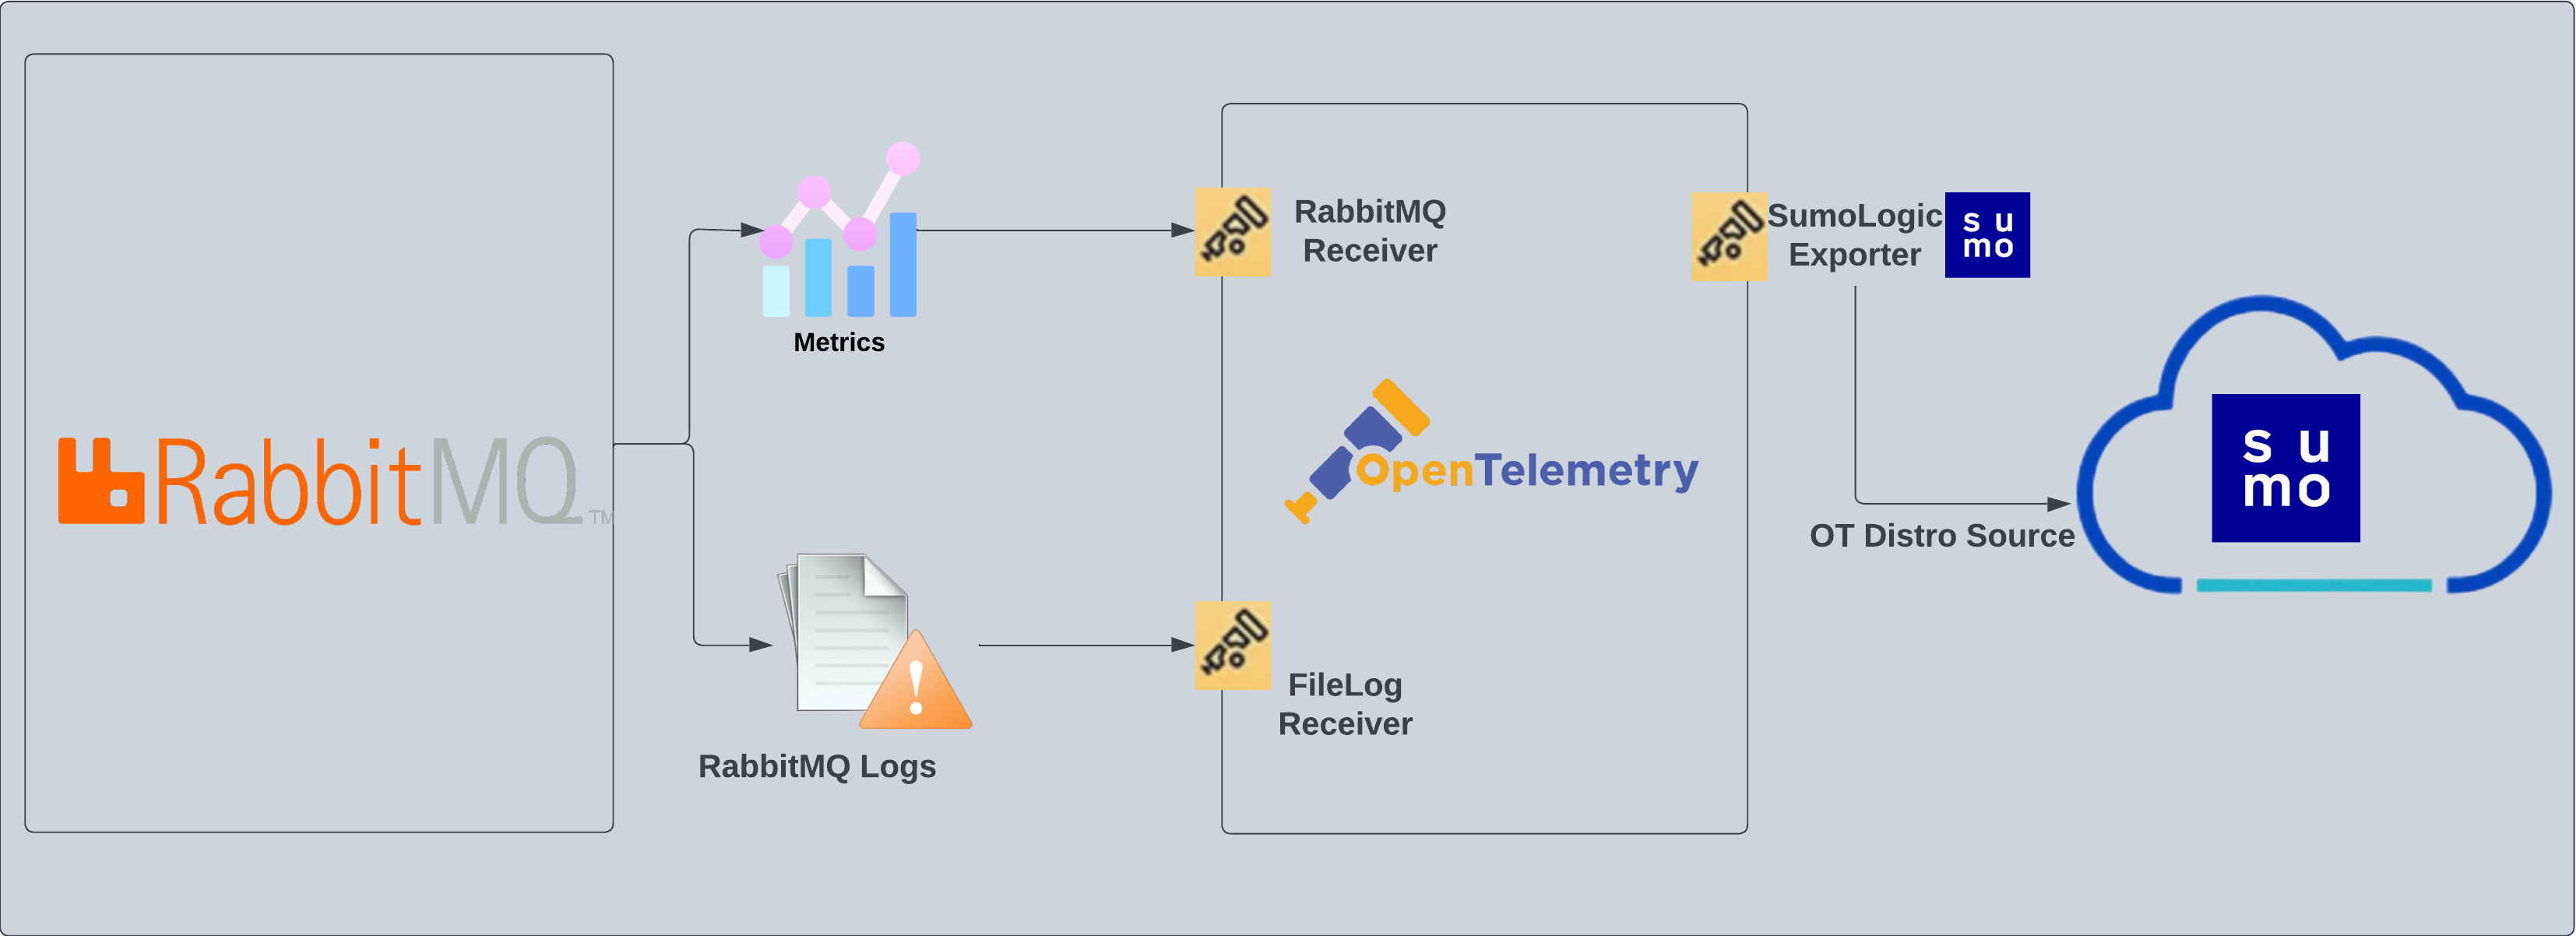
The RabbitMQ app is a unified log app. Preconfigured dashboards provide insight into error logs. RabbitMQ logs are sent to Sumo Logic through OpenTelemetry filelog receiver.
Fields creation in Sumo Logic for RabbitMQ
Following are the Fields which will be created as part of RabbitMQ App install if not already present.
messaging.cluster.name. User configured. Specify the user-friendly cluster name which RabbitMQ belongs to.sumo.datasource. Has fixed value of rabbitmq.
Prerequisites
This section provides instructions for configuring log collection for RabbitMQ running on a non-Kubernetes environment for the Sumo Logic App for RabbitMQ. By default, RabbitMQ logs are stored in a log file.
Follow the instructions to set up log collection:
- Configure logging in RabbitMQ. RabbitMQ supports logging via the following methods: local text log files, syslog and stdout. RabbitMQ logs have six levels of verbosity: debug, info, warning, error, critical, none. For details please visit this page. For the dashboards to work properly, log level needs to be set to debug. Default log level is info. All logging settings are located in RabbitMQ.conf.
- Configure RabbitMQ to write log lines to a local file. By default, RabbitMQ logs are stored in
/var/log/rabbitmq/rabbit@<hostname>.log. The default directory for log files is listed in theRabbitMQ.conffile. To configure the log output destination to a log file, use one of the following settings, either in the configuration file. Edit or create/etc/rabbitmq/rabbitmq.conffile config:log.dir = /var/log/rabbitmq
log.file = rabbitmq.log
log.file.level = debug
Once the logs are configured to be written to a local file, follow the below steps to configure collection in Sumo.
Collection configuration and App installation
As part of data collection setup and app installation, you can select the App from App Catalog and click on Install App. Follow the steps below.
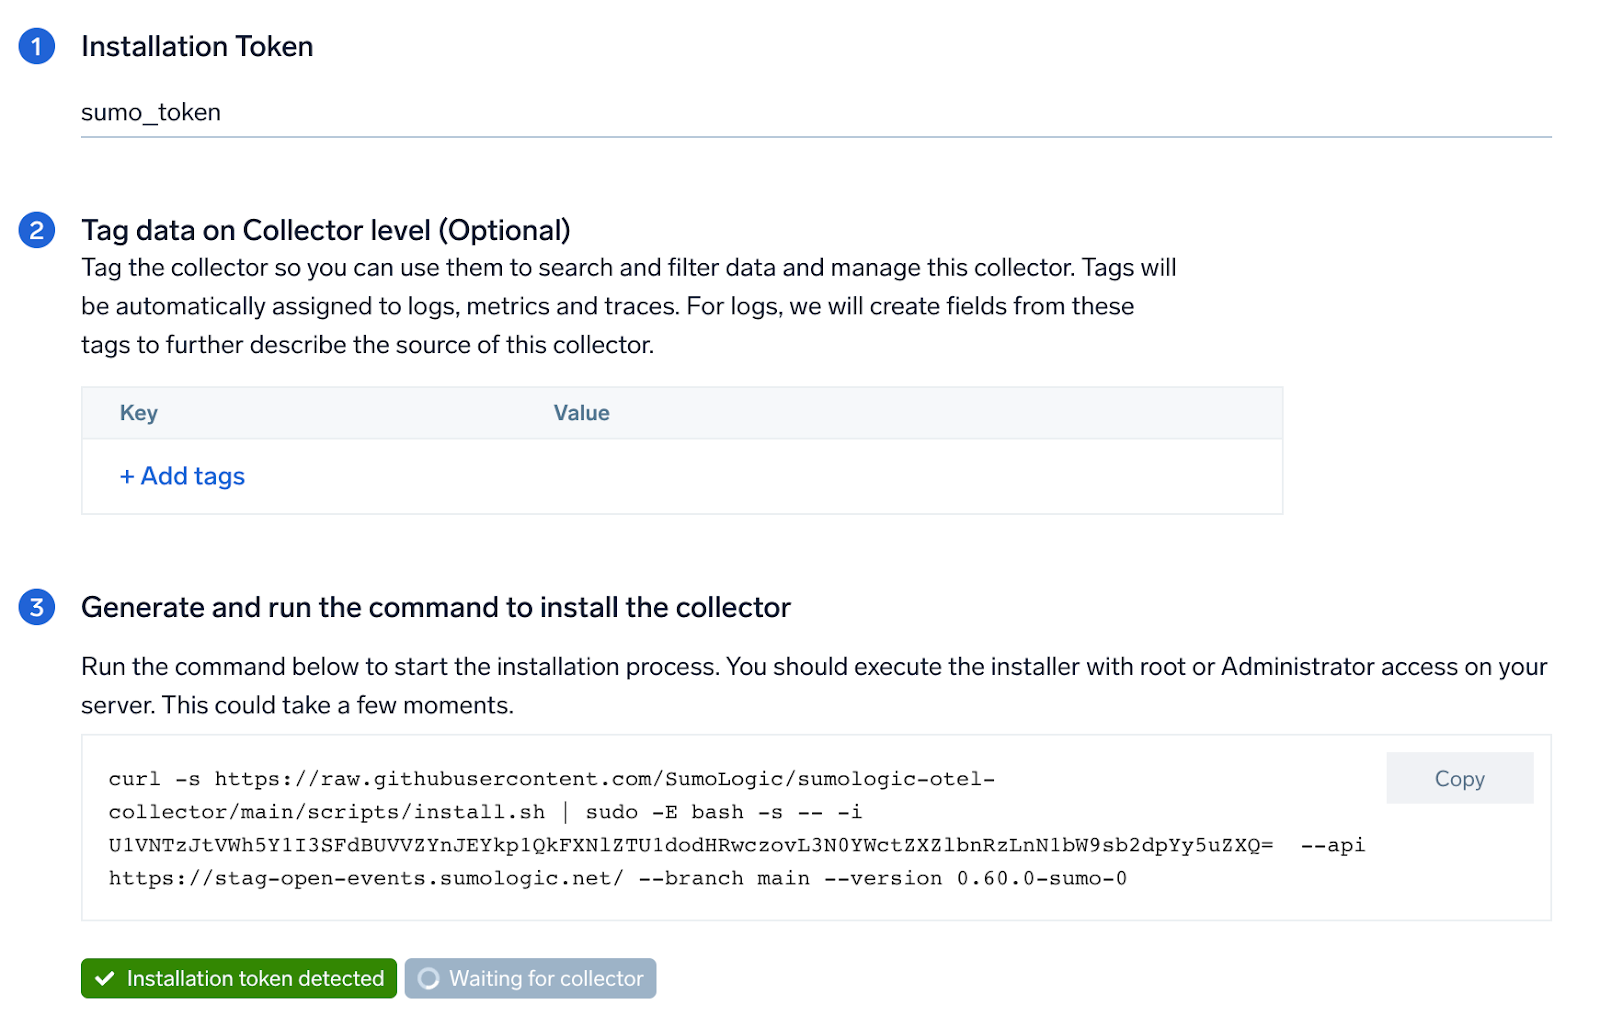
Step 1: Set up Collector
If you want to use an existing OpenTelemetry Collector, you can skip this step by selecting the Use an existing Collector option.
To create a new Collector:
- Select the Add a new Collector option.
- Select the platform where you want to install the Sumo Logic OpenTelemetry Collector.
This will generate a command that you can execute in the machine environment you need to monitor. Once executed, it will install the Sumo Logic OpenTelemetry Collector.
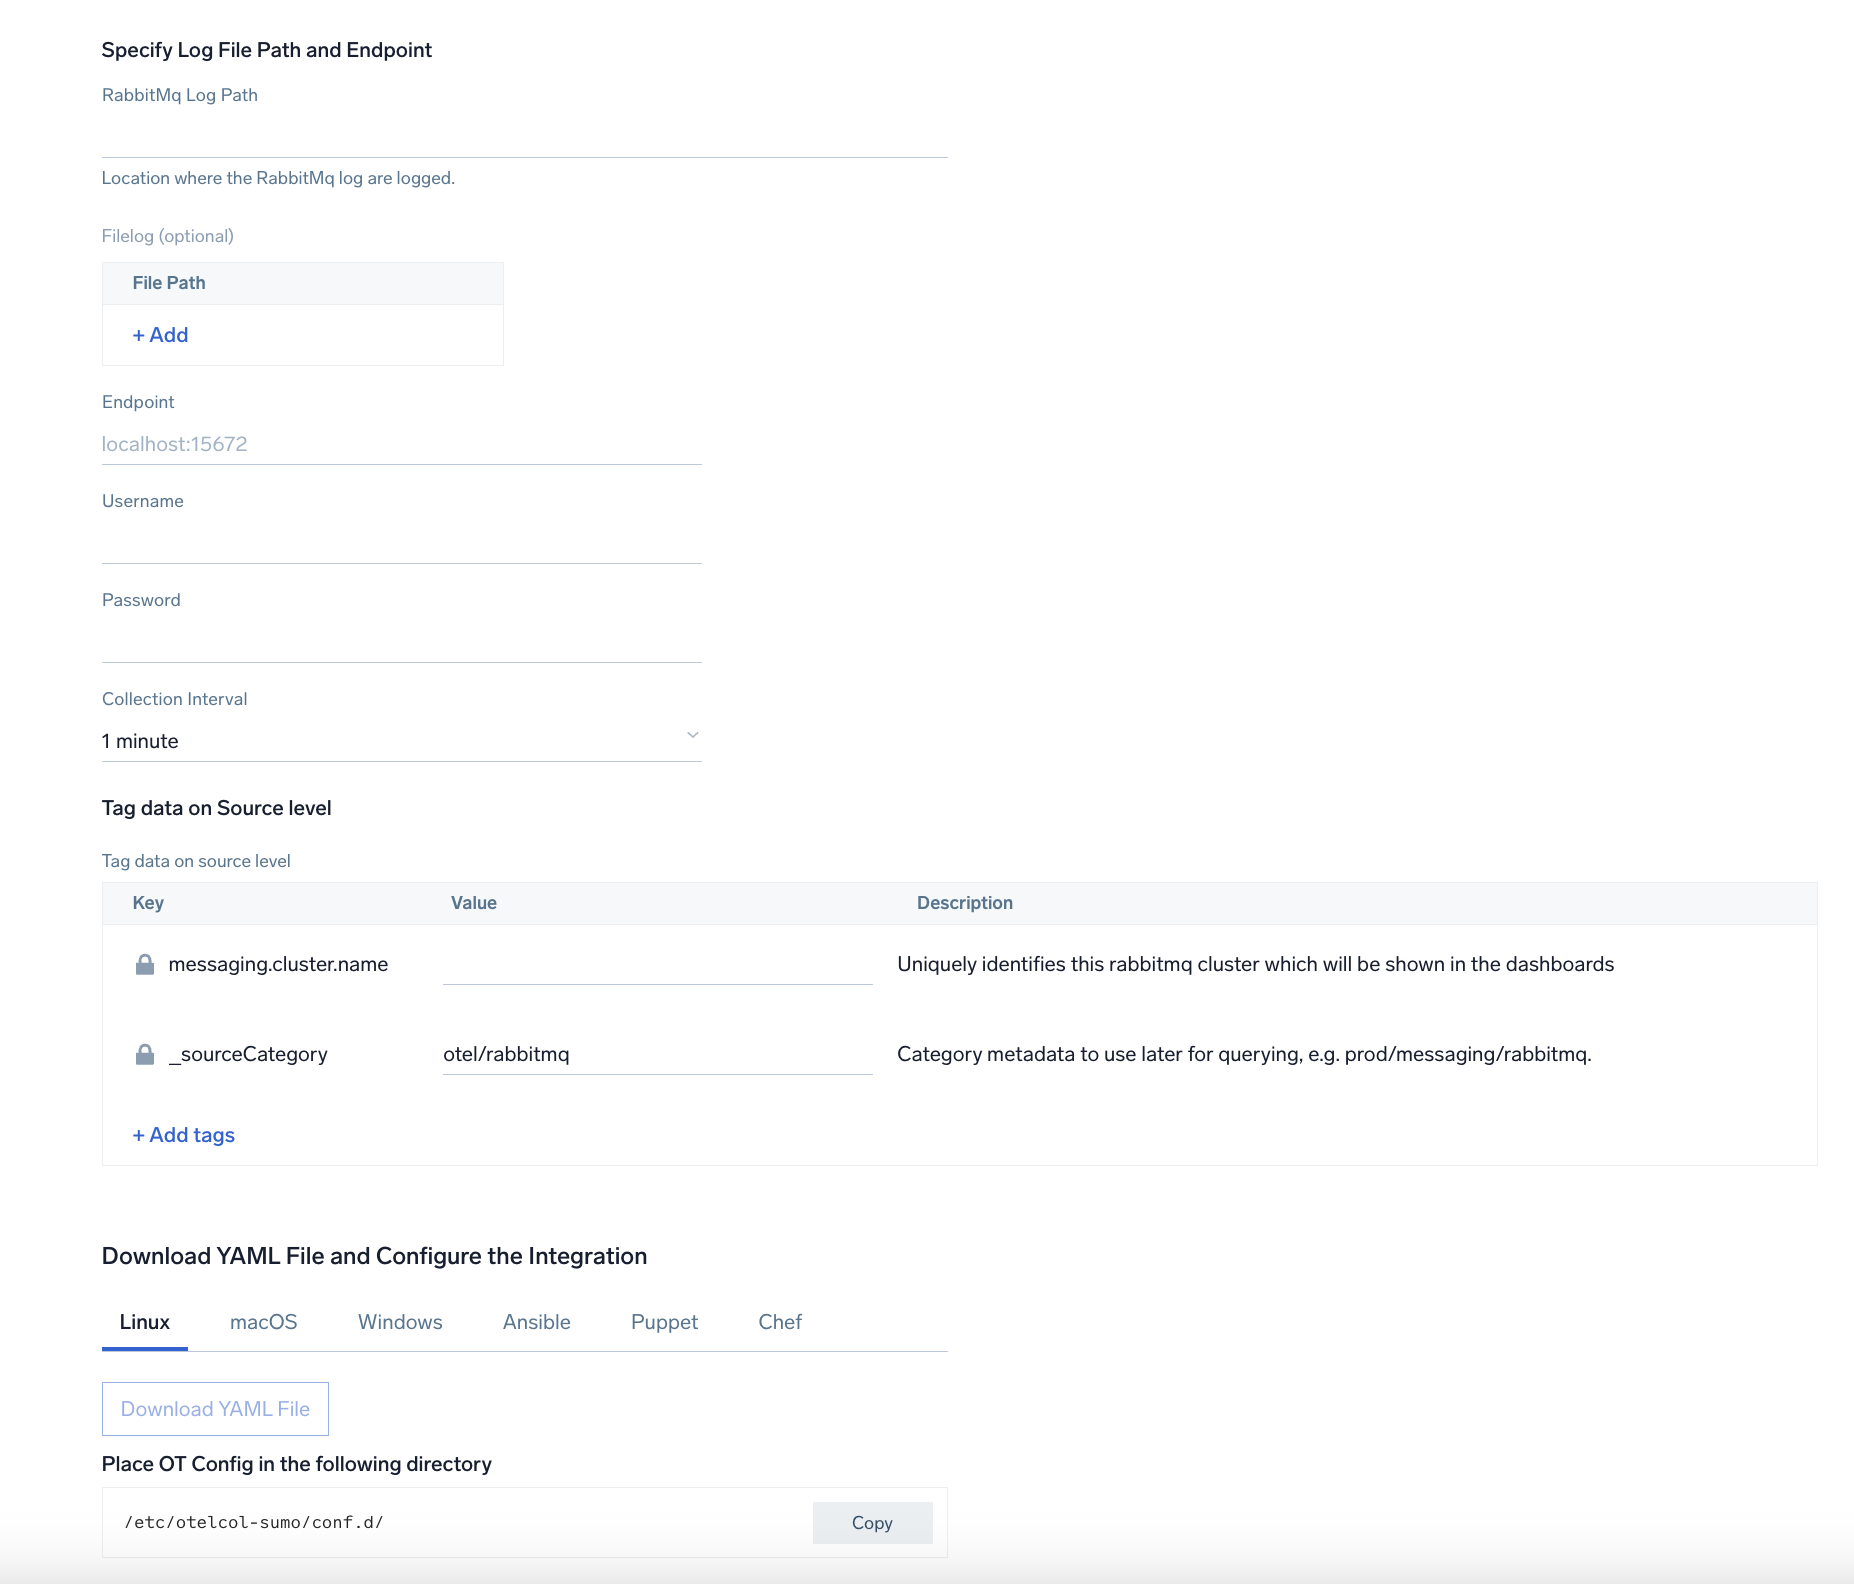
Step 2: Configure integration
In this step, we will be configuring the yaml file required for RabbitMQ Collection. Path of the log file configured to capture RabbitMQ logs is needed to be given here.
The files are typically located in /var/log/rabbitmq/rabbit@<hostname>.log. You can add any custom fields which you want to tag along with the data ingested in sumo. Click on the Download YAML File button to get the yaml file.
Step 3: Send logs to Sumo
Once you have downloaded the yaml file as described in the previous step, follow the below steps based on your platform.
- Linux
- Windows
- macOS
- Copy the yaml file to
/etc/otelcol-sumo/conf.d/folder in the RabbitMQ instance which needs to be monitored. - Restart the collector using:
sudo systemctl restart otelcol-sumo
- Copy the yaml file to
C:\ProgramData\Sumo Logic\OpenTelemetry Collector\config\conf.dfolder in the machine which needs to be monitored. - Restart the collector using:
Restart-Service -Name OtelcolSumo
- Copy the yaml file to /etc/otelcol-sumo/conf.d/ folder in the RabbitMq instance which needs to be monitored.
- Restart the otelcol-sumo process using the below command
otelcol-sumo --config /etc/otelcol-sumo/sumologic.yaml --config "glob:/etc/otelcol-sumo/conf.d/*.yaml"
After successfully executing the above command, Sumo Logic will start receiving data from your host machine.
Click Next. This will install the app (dashboards and monitors) to your Sumo Logic Org.
Dashboard panels will start to fill automatically. It's important to note that each panel fills with data matching the time range query and received since the panel was created. Results won't immediately be available, but within 20 minutes, you'll see full graphs and maps.
Sample Log Messages
Here's a sample log message you'd find in Non-Kubernetes environments.
2023-01-16 05:53:44.858 [info] <0.44.0> Application cowboy exited with reason: stopped
Sample Queries
This sample Query is from the RabbitMQ - Logs dashboard > Events by Severity panel.
 %"sumo.datasource"="rabbitmq" %"messaging.cluster.name"=* host.name=*
| json "log" as _rawlog nodrop
| if(isEmpty(_rawlog),_raw,_rawlog) as _raw
| parse "* * [*]" as date,time,severity | count by severity
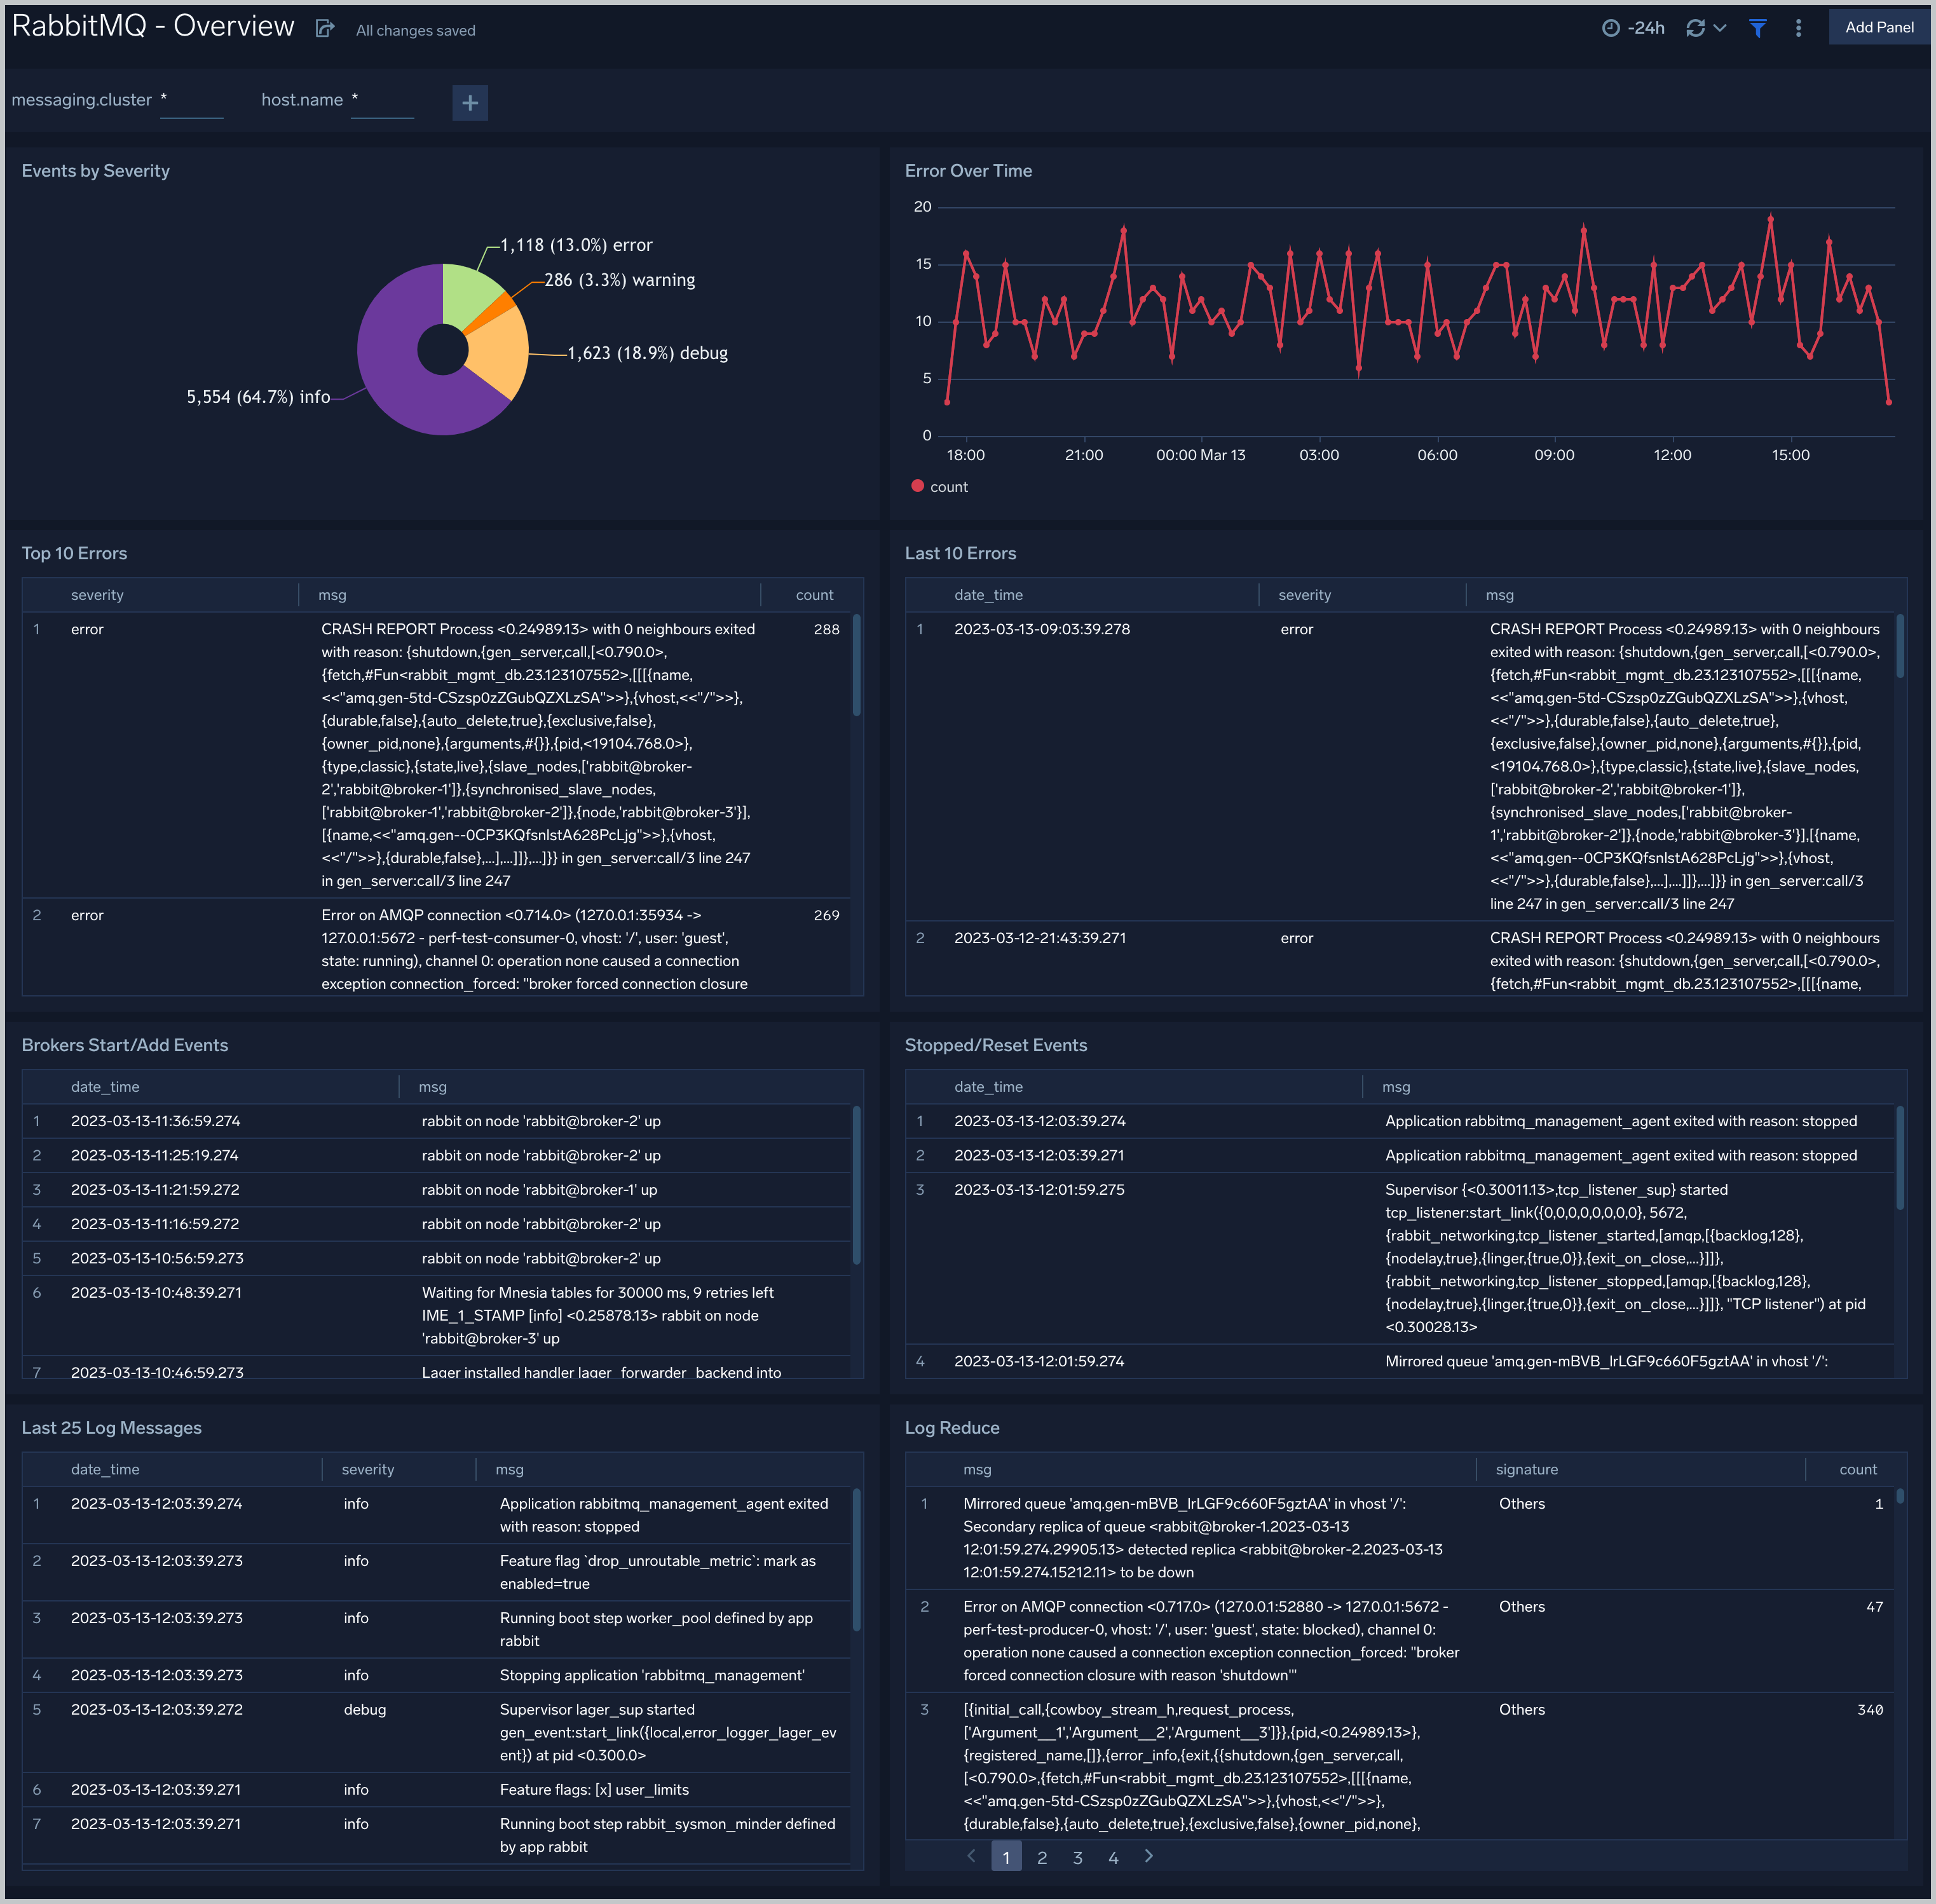
Viewing RabbitMQ Dashboards
Overview
The RabbitMQ - Overview dashboard gives you an at-a-glance view of Error messages, error by severity, top and last 10 errors, Broker and Event Start/Add log messages.