Docker ULM

The Sumo Logic App for Docker ULM is a unified logs and metrics app that allows you to monitor your Docker deployment. The preconfigured dashboards present information about container state and resource usage, including CPU, memory, block I/O, and network. This app has been tested with Docker v8.03.1-ce and Docker API v1.37.
Log and Metric Types
Sumo’s Docker Logs source and Docker Stats source use the Docker Engine API to gather the following data from Docker:
- Docker container logs. Sumo’s Docker Logs source collects container logs. For information about the API Sumo uses to collect logs, see the https://docs.docker.com/engine/api/v1.37/#operation/ContainerLogs in Docker help.
- Docker engine events. Sumo’s Docker Log source collect Docker events. For information about Docker events, see https://docs.docker.com/engine/api/v1.37/#operation/SystemPing in Docker help.
- Docker container stats. Sumo’s Docker Stats source collects stats. For information about Docker stats, see https://docs.docker.com/engine/api/v1.37/#operation/ContainerStats in Docker help.
By default, you can monitor up to 40 Docker containers on a Docker host. If you want to monitor more than 40 containers on a given host you can configure a larger number in collector.properties, as described in the next section. We don’t support monitoring more than 100 containers on a Docker host.
Collecting Logs and Metrics for Docker ULM
Docker is a lightweight open platform that provides a way to package applications in containers for a software development environment.
Windows operating systems are not supported.
You can add the following types of Docker Sources to an Installed Collector on Linux:
- Docker Logs. Collects stdout/stderr logs from processes that are running within Docker containers.
- Docker Stats. Collects metrics about Docker containers.
There are alternative methods for collecting Docker logs and metrics. See Docker Collection Methods for more information.
Docker Source Recommendations
- We recommend running the Sumo collector on the same host where you run Docker. You can deploy the collector as a Docker container. For more information, see https://hub.docker.com/r/sumologic/collector/.
- The Sumo Logic Collector uses the Docker Remote API to collect Docker logs. This requires that the log driver configured on the container uses either the
json-fileorjournaldoption, as described in https://docs.docker.com/engine/admin/logging/overview/. - If you're using Kubernetes, we recommend using an open source Sumo Logic Kubernetes Collection Helm Chart. To learn more, see Kubernetes Observability.
- The Docker Log Source uses timestamps from logs to track collection. You need to ensure your log format has a well-defined timestamp and the Source is configured to detect it properly. If there are issues with timestamp detection and the Docker container is restarted, the Source will reingest all log data since there are no timestamps to track.
- Docker truncates logs at 16kb and Sumo Logic does not stitch them back together.
Add a Docker Logs Source
- In the Sumo web app, select Manage Data > Collection > Collection.
- Navigate to the collector you installed on the Docker host, and select Add > Add Source.
- Select Docker Logs. The Docker Logs page appears.
- Configure the source fields:
- Name. (Required).
- Description. (Optional).
- URI. Enter the URI of the Docker daemon.
- If your collector runs on the same host as the Docker containers it will monitor, enter the non-networked Unix socket:
unix:///var/run/docker.sock - If your collector runs on a different machine than the Docker host, you can determine its URI from a Docker environment variable. Run the
docker-machinecommand to find the Docker environment variables. The command's syntax is$ docker-machine env machine-name. For example,$ docker-machine env default \
export DOCKER_TLS_VERIFY="1" \
export DOCKER_HOST="tcp://192.168.99.100:2376" \
export DOCKER_CERT_PATH="/Users/sumo/.docker/machine/machines/default" \
export DOCKER_MACHINE_NAME="default" \
# Run this command to configure your shell: \
# eval "$(docker-machine env default)" \ - Take the value of the
DOCKER_HOSTvariable, change "tcp" to "https", and enter that value as the URI. For example,https://192.168.99.100:2376.
- If your collector runs on the same host as the Docker containers it will monitor, enter the non-networked Unix socket:
- Cert Path. (Required for remote access only) Enter the path to the certificate files on the local machine where the collector runs. In the example above, the cert path is:
/Users/sumo/.docker/machine/machines/default. - Event Logs. Check this box to collect Docker events as well as standard Docker logs.
- Collect From and Container Filters. If you want to collect from all containers, click the All Containers radio button. If you want to collect from selected containers, click the Specified Container Filters radio button, and specify filter expressions in the Container Filters field. For information about how to define container filters, see more about defining container filters below.
- By default, you can collect from up to 40 containers. To increase the limit, stop the Collector service, edit the
collector.propertiesfile (in theconfigsubdirectory of the collector installation directory), and add thedocker.maxPerContainerConnectionsproperty. The maximum supported value is 100. Then start the Collector service. See collector.properties for details on modifying this configuration file.
- By default, you can collect from up to 40 containers. To increase the limit, stop the Collector service, edit the
- Source Host. Enter the hostname or IP address of the source host. If not specified, it’s assumed that the host is the machine where Docker is running. The hostname can be a maximum of 128 characters. If desired, you can use Docker variables to construct the Source Host value. For more information, see Configure sourceCategory and sourceHost using variables.
- Source Category. Enter a string used to tag the output collected from this Source with searchable metadata. For example, typing web_apps tags all the logs from this Source in the sourceCategory field, so running a search on
_sourceCategory=web_appswould return logs from this Source. For more information, see Metadata Naming Conventions and our Best Practices: Good Source Category, Bad Source Category. If desired, you can use Docker variables to construct the Source Category value. For more information, see Configure sourceCategory and sourceHost using variables. - Fields. Click the +Add Field link to add custom log metadata Fields. Define the fields you want to associate, each field needs a name (key) and value.
 A green circle with a check mark is shown when the field exists and is enabled in the Fields table schema.
 An orange triangle with an exclamation point is shown when the field doesn't exist, or is disabled, in the Fields table schema. In this case, an option to automatically add or enable the nonexistent fields to the Fields table schema is provided. If a field is sent to Sumo that does not exist in the Fields schema or is disabled it is ignored, known as dropped.
- Configure the Advanced options.
- Enable Timestamp Parsing. This option is checked by default and required. See the Notes section above for details.
- Time Zone. Default is “Use time zone from log file”.
- Timestamp Format. Default is “Automatically detect the format”.
- Encoding. Default is “UTF-8”.
- Enable Multiline Processing. TheDetect messages spanning multiple lines option is checked by default. See Collecting Multiline Logs for details on multiline processing and its options.
- Infer Boundaries. This option is checked by default.
- Boundary Regex. If multiple processing is enabled, and Infer Boundaries is disabled, enter a regular expression for message boundaries.
- Configure processing rules. For more information, see** **Processing Rules.
Add a Docker Stats Source
- In Sumo select Manage Data > Collection > Collection.
- Navigate to the collector you installed on the Docker host, and select Add > Add Source.
- Select Docker Stats. The following Docker Stats page appears. There are two possible content types available, select Metrics to collect data as metrics, or select Logs (JSON) to collect data as JSON logs. To collect metrics for the Docker ULM App, select Metrics as the Content Type.
- Configure the source fields:
- Name. (Required)
- Description. (Optional)
- URI. Enter the URI of the Docker daemon.
- If your collector runs on the same host as the Docker containers it will monitor, enter the non-networked Unix socket:
unix:///var/run/docker.sock - If your collector runs on a different machine than the Docker host, you can determine its URI from a Docker environment variable. Run the
docker-machinecommand to find the Docker environment variables. The command's syntax is$ docker-machine env machine-name. For example,$ docker-machine env default \
export DOCKER_TLS_VERIFY="1" \
export DOCKER_HOST="tcp://192.168.99.100:2376" \
export DOCKER_CERT_PATH="/Users/sumo/.docker/machine/machines/default" \
export DOCKER_MACHINE_NAME="default" \
# Run this command to configure your shell:
# eval "$(docker-machine env default)" - Take the value of the
DOCKER_HOSTvariable, change "tcp" to "https", and enter that value as the URI. For example,https://192.168.99.100:2376.
- If your collector runs on the same host as the Docker containers it will monitor, enter the non-networked Unix socket:
- Cert Path. (Required for remote access only) Enter the path to the certificate files on the local machine where the collector runs. In the example above, the cert path is: /Users/sumo/.docker/machine/machines/default
- Collect From and Container Filters. If you want to collect from all containers, click the All Containers radio button. If you want to collect from selected containers, click the Specified Container Filters radio button, and specify filter expressions in the Container Filters field. For information about how to define container filters, see more about defining container filters below.
- By default, you can collect from up to 40 containers. To increase the limit, stop the Collector service, edit the
collector.propertiesfile (in theconfigsubdirectory of the collector installation directory), and add thedocker.maxPerContainerConnectionsproperty. The maximum supported value is 100. Then start the Collector service. See collector.properties for details on modifying this configuration file.
- By default, you can collect from up to 40 containers. To increase the limit, stop the Collector service, edit the
- Source Host. Enter the hostname or IP address of the source host. If not specified, it’s assumed that the host is the machine where Docker is running. The hostname can be a maximum of 128 characters. If desired, you can use Docker variables to construct the Source Host value. For more information, see Configure sourceCategory and sourceHost using variables.
- Source Category. Enter a string used to tag the output collected from this Source with searchable metadata. For example, typing
web_appstags all the logs from this Source in the sourceCategory field, so running a search on_sourceCategory=web_appswould return logs from this Source. For more information, see Metadata Naming Conventions and our Best Practices: Good Source Category, Bad Source Category. If desired, you can use Docker variables to construct the Source Host value. For more information, see Configure sourceCategory and sourceHost using variables. - Fields. Click the +Add Field link to add custom metric metadata. Define the fields you want to associate, providing a name (key) and value for each.
- Scan Interval. This option sets how often the source is scanned. Setting a shorter frequency increases message volume, and can cause your deployment to incur additional charges. The minimum acceptable scan interval is 1 second.
- Metrics (Available if content type selected is Metrics). Select the Docker metrics you want to be ingested, see Docker metrics definitions for details.
Docker Metrics definitions
| Metrics Name | Unit | Description |
| CPU | ||
| cpu_percentage | Percent | Percentage of CPU used |
| online_cpus | Count | Number of CPUs online (only available on API v1.27 or higher) |
| system_cpu_usage | Nanoseconds | Host’s cumulative CPU usage |
| cpu_usage.percpu_usage | Nanoseconds | Respective usage for every CPU (scalable with cpu=[0..x]) |
| cpu_usage.total_usage | Nanoseconds on Linux 100's of nanoseconds on Windows | Total CPU time consumed |
| cpu_usage.usage_in_kernelmode | Nanoseconds | CPU usage in the kernel mode |
| cpu_usage.usage_in_usermode | Nanoseconds | CPU usage in the user mode |
| throttling_data.periods | Count | Number of enforcement intervals that have elapsed |
| throttling_data.throttled_periods | Count | Number of enforcement intervals that have been throttled |
| throttling_data.throttled_time | Nanoseconds | Total CPU time has been throttled |
| Memory | ||
| failcnt | Count | Times of memory usage hit the limits |
| limit | Bytes | Memory limit set on the container (or on the host if it's not set on container) |
| max_usage | Bytes | Maximum of memory usage |
| memory_percentage | Percent | Percentage of memory used |
| usage | Bytes | Current memory usage |
| stats.active_anon | Bytes | The anonymous memory that has been identified as active by the kernel |
| stats.active_file | Bytes | The file cache memory that has been identified as active by the kernel |
| stats.cache | Bytes | The memory used by the processes of this cgroup that can be associated precisely with a block on a block device |
| stats.hierarchical_memory_limit | Bytes | The hierarchical memory limit |
| stats.inactive_anon | Bytes | he anonymous memory that has been identified as inactive by the kernel |
| stats.inactive_file | Bytes | The file cache memory that has been identified as inactive by the kernel |
| stats.mapped_file | Bytes | The cache memory mapped by the processes in the cgroup |
| stats.pgfault | Count | The number of times that a process of the cgroup triggered a 'page fault' |
| stats.pgmajfault | Count | The number of times that a process of the cgroup triggered a “major fault” |
| stats.pgpgin | Count | The number of times that the system has paged in from disk |
| stats.pgpgout | Count | The number of times that the system has paged out to disk |
| stats.rss | Bytes | The memory that does not correspond to anything on disk: stacks, heaps, or anonymous memory maps |
| stats.rss_huge | Bytes | The anonymous memory transparent hugepages |
| stats.unevictable | Bytes | The memory that cannot be reclaimed |
| stats.writeback | Bytes | File anonymous cache that are queued for syncing to disk |
| stats.total_active_anon | Bytes | The anonymous memory that has been identified has respectively active by the kernel (includes sub-cgroups) |
| stats.total_active_file | Bytes | The file cache memory that has been identified has respectively active by the kernel (includes sub-cgroups) |
| stats.total_cache | Bytes | The memory used by the processes of this cgroup that can be associated precisely with a block on a block device (includes sub-cgroups) |
| stats.total_inactive_anon | Bytes | The anonymous memory that has been identified has respectively inactive by the kernel (includes sub-cgroups) |
| stats.total_inactive_file | Bytes | The file cache memory that has been identified has respectively inactive by the kernel (includes sub-cgroups) |
| stats.total_mapped_file | Bytes | The cache memory mapped by the processes in the control group (includes sub-cgroups) |
| stats.total_pgfault | Count | The number of times that a process of the cgroup triggered a 'page fault' (includes sub-cgroups) |
| stats.total_pgmajfault | Count | The number of times that a process of the cgroup triggered a “major fault” (includes sub-cgroups) |
| stats.total_pgpgin | Count | The number of times that the system has paged in from disk (includes sub-cgroups) |
| stats.total_pgpgout | Count | The number of times that the system has paged out to disk (includes sub-cgroups) |
| stats.total_rss | Bytes | The memory that doesn’t correspond to anything on disk: stacks, heaps, and anonymous memory maps (includes sub-cgroups) |
| stats.total_rss_huge | Bytes | The anonymous memory transparent hugepages (includes sub-cgroups) |
| stats.total_unevictable | Bytes | The memory that cannot be reclaimed (includes sub-cgroups) |
| stats.total_writeback | Bytes | File anonymous cache that are queued for syncing to disk (includes sub-cgroups) |
| Network - Scalable on API v1.21 or higher, with dimension "interface" | ||
| rx_bytes | Bytes | Data volume (received) |
| rx_dropped | Count | Number of dropped packets (received) |
| rx_errors | Count | Number of error packets (received) |
| rx_packets | Count | Number of total packets (received) |
| tx_bytes | Bytes | Data volume (transmitted) |
| tx_dropped | Count | Number of dropped packets (transmitted) |
| tx_errors | Count | Number of error packets (transmitted) |
| tx_packets | Count | Number of total packets (transmitted) |
| BlockIO - Scalable with "major" and "minor" id of devices | ||
| io_merged_recursive | Count | Number of bios/requests merged into requests belonging to all the descendant cgroups |
| io_queue_recursive | Count | Number of requests queued up at any given instant from all the descendant cgroups |
| io_service_bytes_recursive | Bytes | Number of bytes transferred to/from the disk from all the descendant cgroups |
| io_service_time_recursive | Milliseconds | Amount of time between request dispatch and request completion from all the descendant cgroups |
| io_serviced_recursive | Count | Total number of block I/O requests serviced in that container |
| io_time_recursive | Milliseconds | Disk time allocated to all devices from all the descendant cgroups |
| io_wait_time_recursive | Milliseconds | Amount of time the IOs for this cgroup spent waiting in the scheduler queues for service from all the descendant cgroups |
| sectors_recursive | Count | Number of sectors transferred to/from disk bys from all the descendant cgroups |
| PIDs | ||
| current | Count | Number of PIDs (Not available on Windows) |
Defining container filters
In the Container Filter field, you can enter a comma-separated list of one or more of the following types of filters:
- A specific container name, for example,
my-container - A wildcard filter, for example,
my-container-* - An exclusion filter, which begins with an exclamation mark, for example,
!master-containeror!prod-*
For example, this filter list below will cause the source to collect from all containers whose names start with “prod-”, except those that match “prod-*-mysql”. It will also collect from containers with names that match “master-*-app-*”, and from the “sumologic-collector” container.
prod-*, !prod-*-mysql, master-*-app-*, sumologic-collector
If your filter list contains only exclusions, the source will collect all containers except from those that match your exclusion filters. The below example will cause the source to exclude containers whose names begin with “container123” and “prod-”.
!container123*, !prod-*
Configure sourceCategory and sourceHost using variables
In collector version 19.216-22 and later, when you configure the sourceCategory and sourceHost for a Docker Log Source or a Docker Stats Source, you can specify the value using variables available from Docker and its host.
You build templates for sourceCategory and sourceHost specifying component variables in this form:
{{NAMESPACE.VAR_NAME}}
Where:
NAMESPACEis a namespace that indicates the variable type.VAR_NAMEis the variable name. These are case-sensitive.
The table below defines the types of variables you can use.
Docker engine event log data doesn't support the tagging with metadata.
| Namespace/VAR_TYPE | Description | VAR_NAME |
container | Container metadata fields provided by Docker for use in the --log-opt tag option.These are automatically added to data points. For more information, see Log tags for logging driver in Docker help. | ID The first 12 characters of the container ID.
|
label | User-defined labels, supplied with the --label flag when starting a Docker container.This is automatically added to data points. | The name of the variable. Dot characters ( |
env | User-defined container environment variables that are set with --env|-e flags when starting a container. | The name of the variable. Dot characters ( |
For example:
{{container.ID}}
You can use multiple variables, for example:
{{container.ID}}-{{label.label_name}}-{{env.var_name}}
You can incorporate text in the metadata expression, for example:
ID{{container.ID}}-AnyTextYouWant{{label.label_name}}
The example above uses a hyphen - character to separate variable components. Separator characters are not required. Curly brackets and spaces are not allowed. Underscores and hyphens are recommended.
If a user-defined variable doesn’t exist, that portion of the metadata field will be blank.
Installing the Docker ULM App
Now that you have set up collection of Docker logs and metrics, install the Sumo Logic App for Docker ULM to use the pre-configured searches and dashboards.
To install the app
Locate and install the app you need from the App Catalog. If you want to see a preview of the dashboards included with the app before installing, click Preview Dashboards.
- From the App Catalog, search for and select the app.
- To install the app, click Add to Library.
- App Name. You can retain the existing name, or enter a name of your choice for the app.
- Docker Log Source. Select the source category that you configured for the Docker Logs source.
- Docker Metrics Source. Select the source category that you configured for the Docker Stats source.
- Advanced. Select the Location in Library (the default is the Personal folder in the library), or click New Folder to add a new folder.
- Click Add to Library.
Once an app is installed, it will appear in your Personal folder, or other folder that you specified. From here, you can share it with your organization. See Welcome to the New Library for information on working with the library .
Panels will start to fill automatically. It's important to note that each panel slowly fills with data matching the time range query and received since the panel was created. Results won't immediately be available, but with a bit of time, you'll see full graphs and maps.
Viewing the Docker ULM Dashboards
This section describes the dashboards in the Sumo Logic App for Docker ULM.
Overview
See an overview of Docker activity, including the number of Docker hosts; the number of containers started, paused, stopped, and killed; event information; and the top containers by CPU usage, bytes sent, bytes received, and memory usage over the last 24 hours.
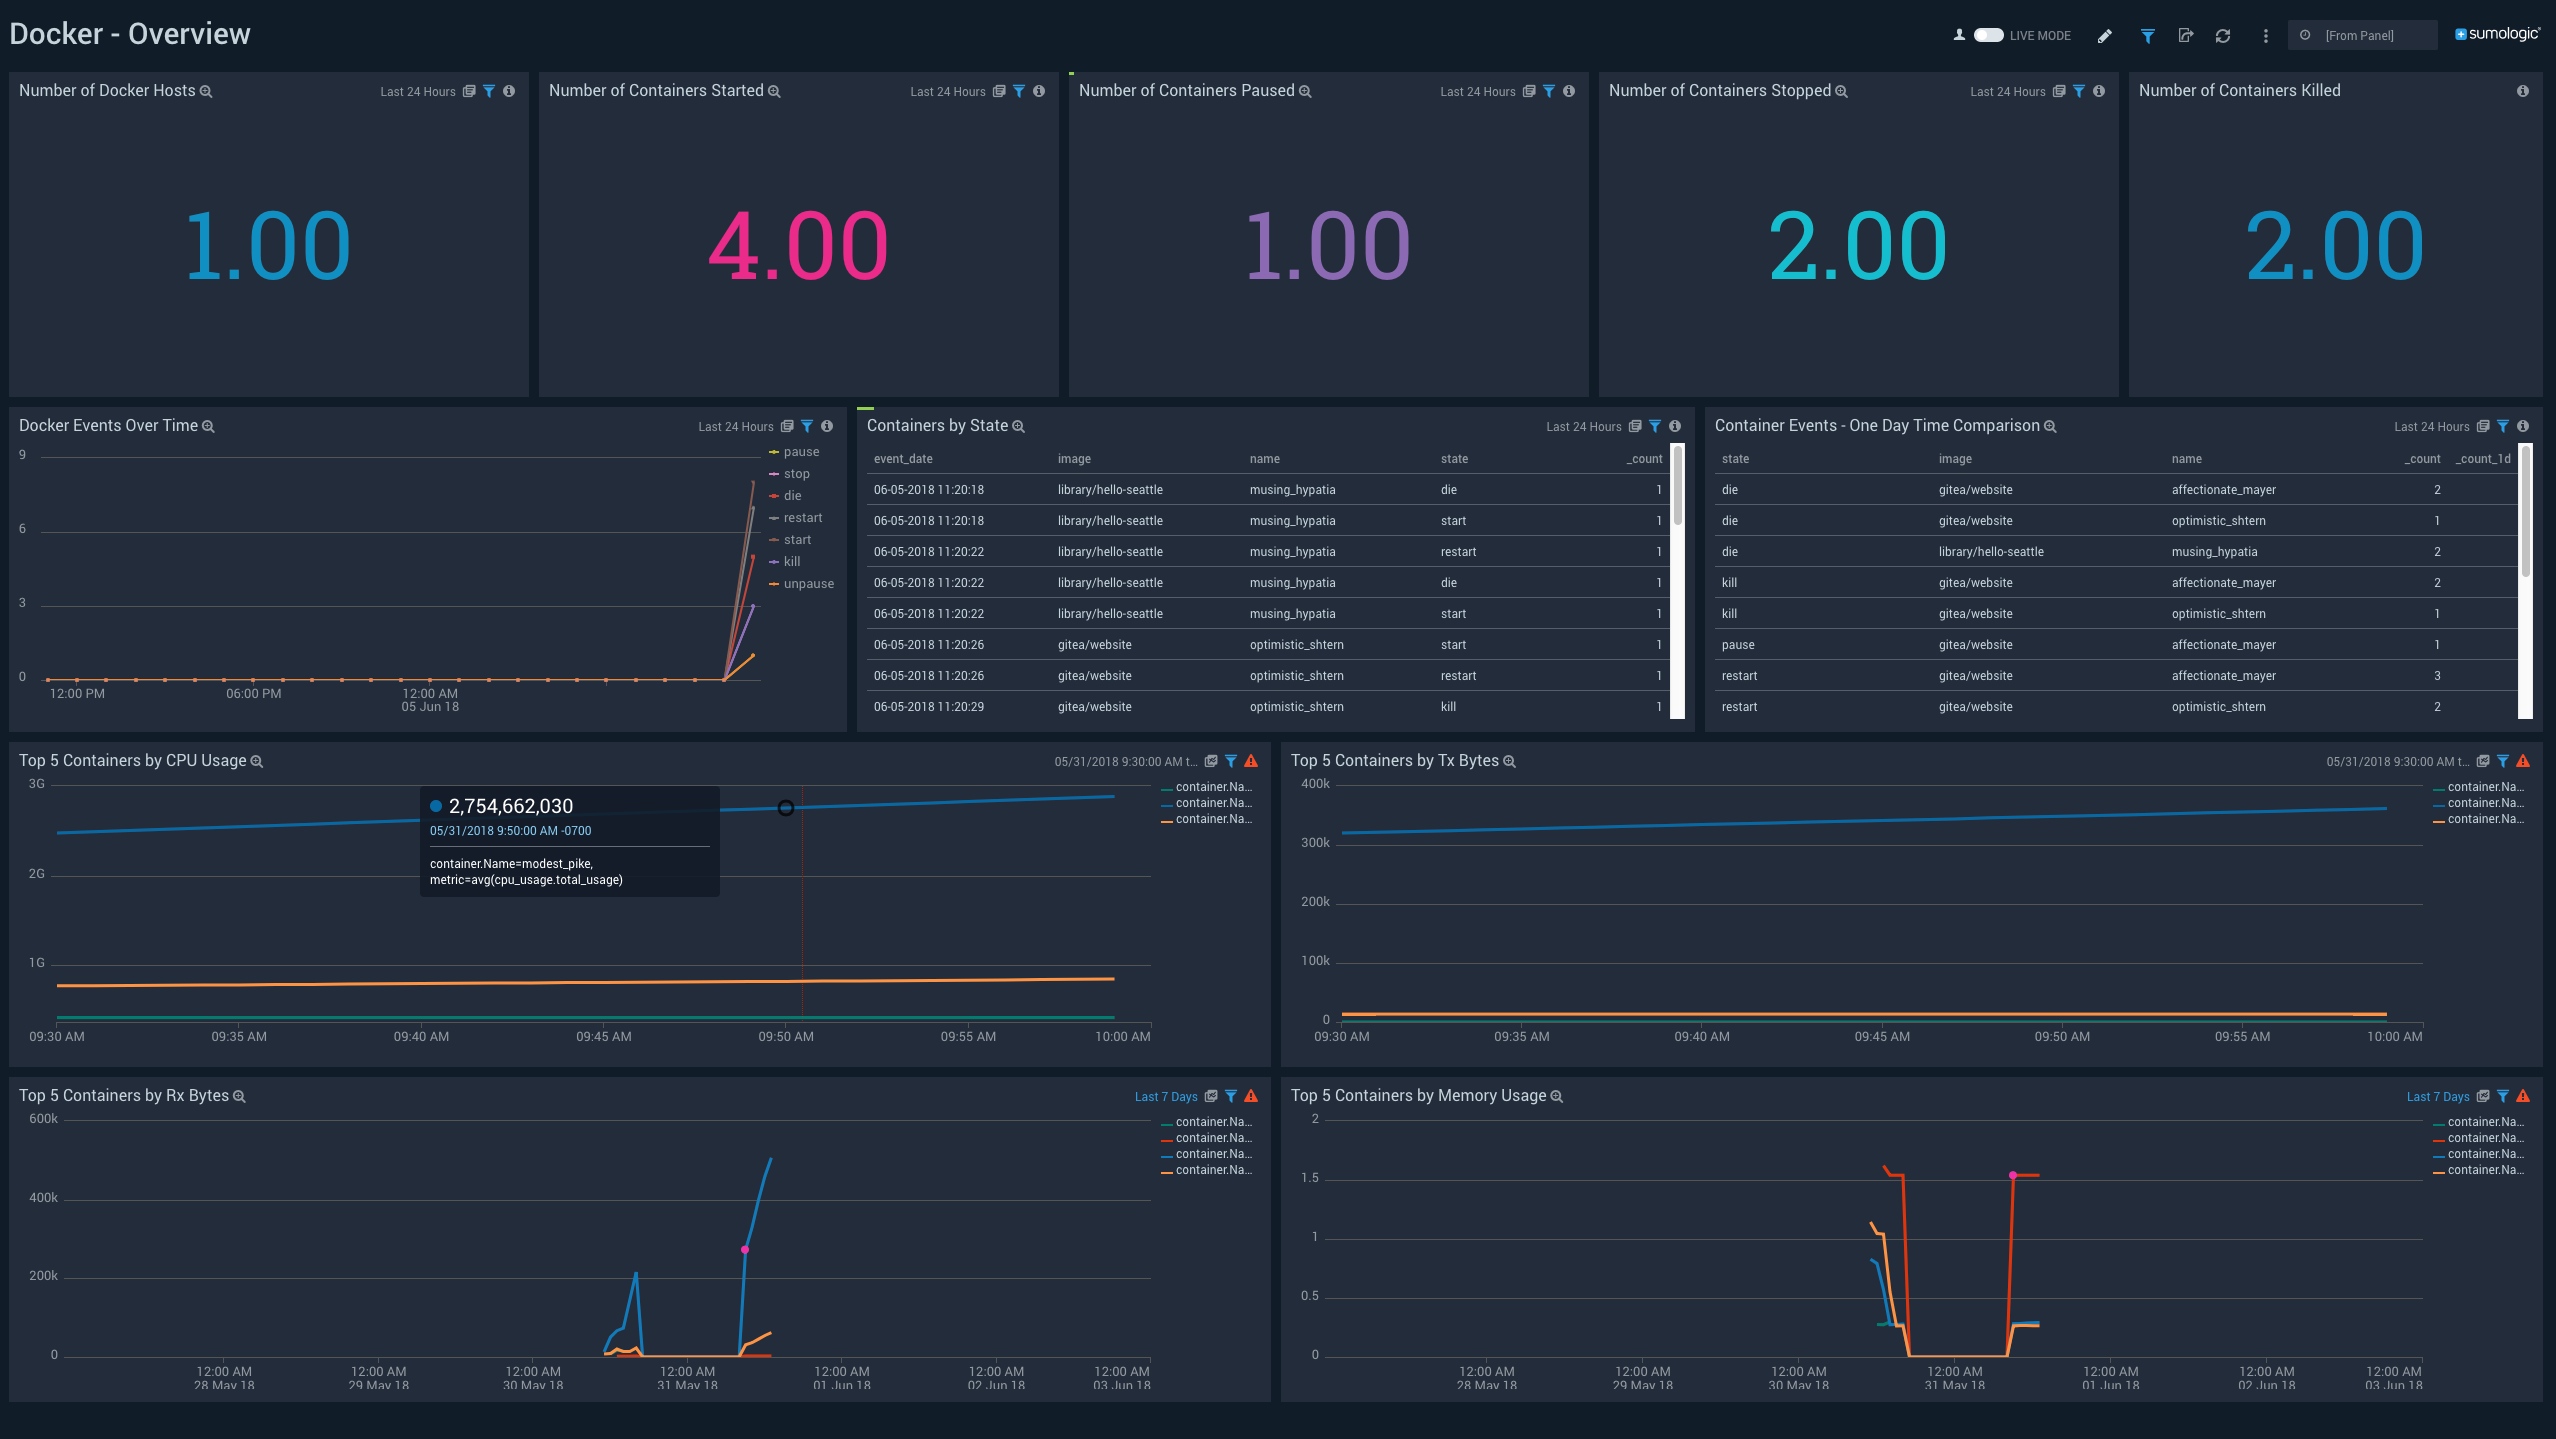
Number of Docker Hosts. Number of Docker hosts monitored over the last 24 hours.
Number of Containers Started.Number of containers started over the last 24 hours
Number of Containers Paused. Number of containers paused over the last 24 hours
Number of Containers Stopped. Number of containers stopped over the last 24 hours
Number of Containers Killed. Number of containers killed over the last 24 hours
Docker Events Over Time. A line chart that shows the count of specific Docker container events (such as pause, stop, die, restart, start, kill, unpause, and so on) per time slice over the last 24 hours.
Containers by State. A table that lists, for container events that occurred during the last 24 hours, the time the event occurred, the container image, the container name, and the event type.
Container Events - One Day Time Comparison. A table that compares the count of a particular event (such as pause, stop, die, restart, start, kill, unpause, and so on) for a image/container combination over the time range (24 hours by default), compared with 24 hours previous to the time range.
Top 5 Containers by CPU Usage. A line chart that shows the CPU usage by the five containers that have used the most CPU over the last 24 hours.
Top 5 Containers by Tx Bytes. A line chart that shows the bytes transmitted by top five containers that have transmitted the most bytes over the last 24 hours.
Top 5 Containers by Rx Bytes. A line chart that shows the bytes received by the five containers that have received the most bytes over the last 24 hours.
Top 5 Containers by Memory Usage. A line chart that shows the memory usage by the top five containers that used the most memory over the last 24 hours.
Block IO
See the number of block I/O requests serviced by each container, and the number of bytes transferred to and from disk by each container over the last three hours.
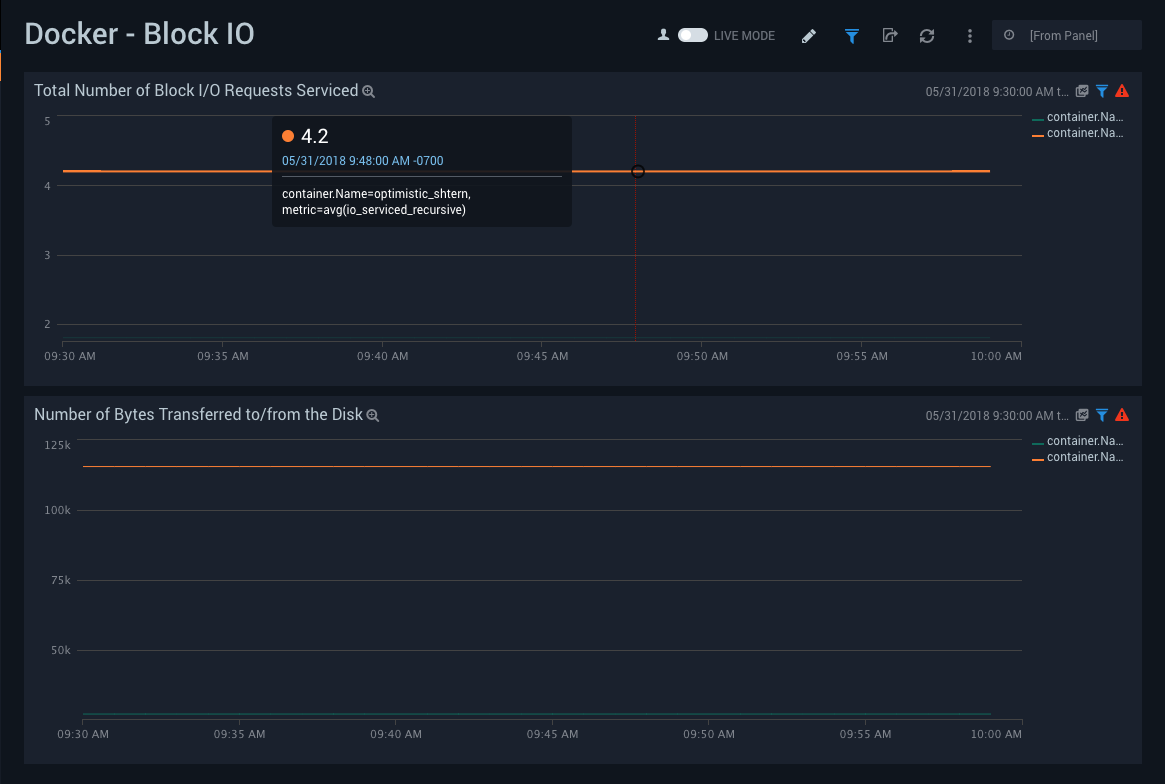
Total Number of Block I/O Requests Serviced. A line chart that shows the number of block I/O requests serviced by each container over the last three hours.
Number of Bytes Transferred to/from the Disk. A line chart that shows the number of bytes written to and read by each container over the last three hours.
CPU Usage
See information about CPU usage and container throttling over the last three hours.
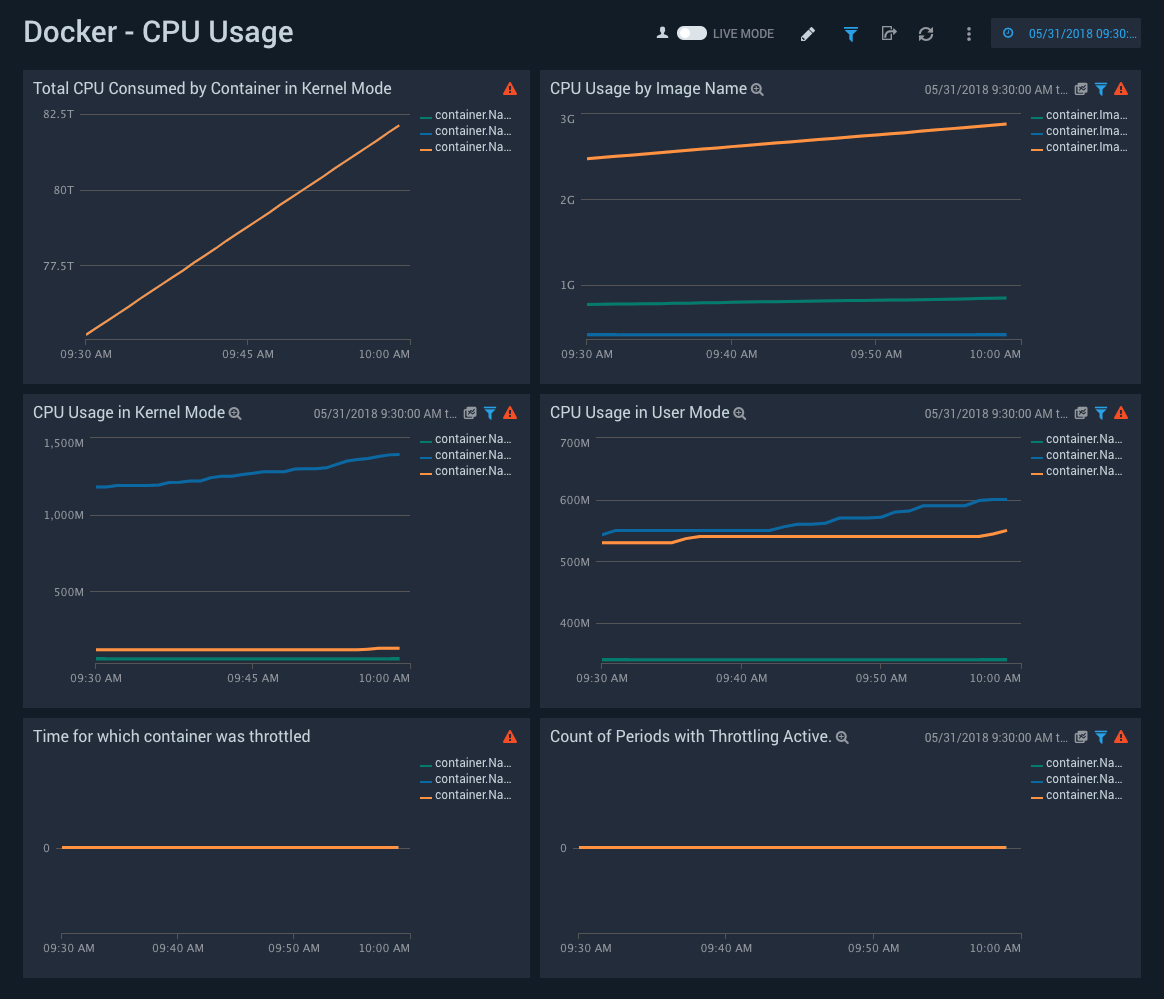
Total CPU Consumed by Container in Kernel Mode. A line chart that shows the CPU consumed in kernel mode by each container over the last three hours.
CPU Usage by Image Name. A line chart that shows the CPU consumed by container image name per timeslice over the last three hours.
CPU Usage in Kernel Mode. A line chart that shows the CPU consumed in kernel mode by each container per timeslice over the last three hours.
CPU Usage in User Mode. A line chart that shows the CPU consumed in user mode by each container per timeslice over the last three hours.
Time for which container was throttled. A line chart that shows the duration for which each container's CPU was throttled over the last three hours.
Count of Periods with Throttling Active. A line chart that shows how many times each container's CPU was throttled over the last three hours.
Memory Usage
See information about container memory limits, memory usage, and page faults over the last three hours.
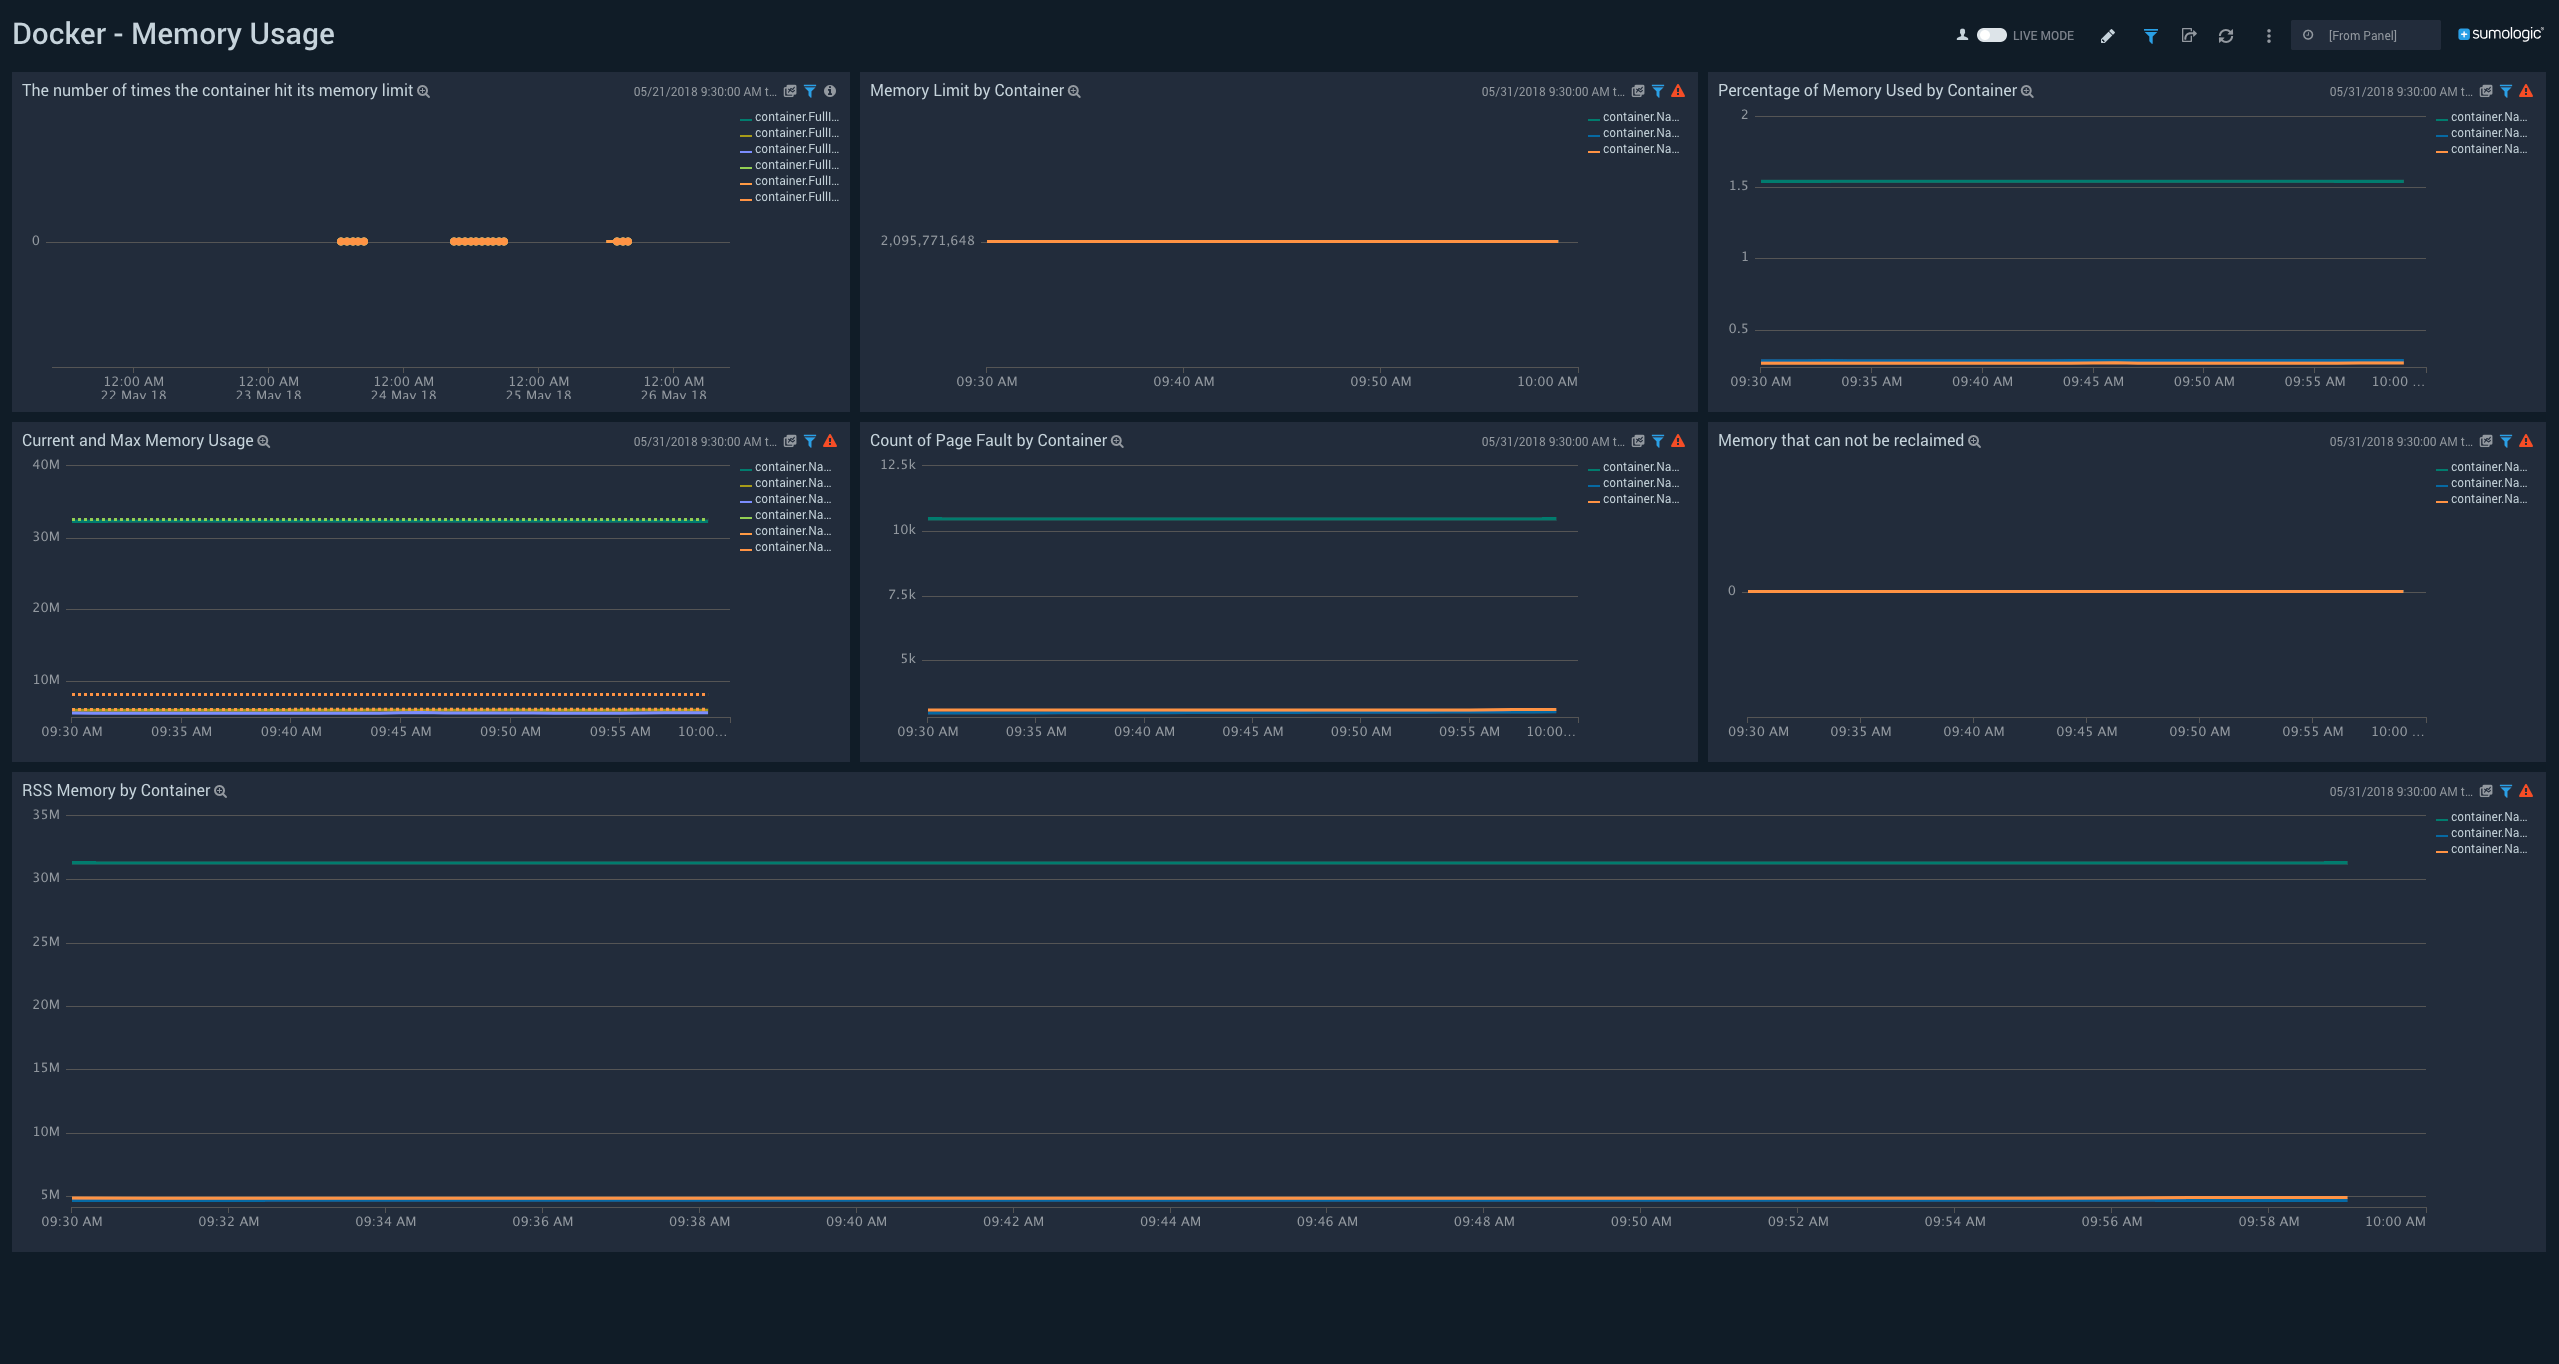
Number of Times Container Hit Memory Limit. A line chart that shows the number of times that each container reached its memory limit over the last three hours.
Memory Limit by Container. A line chart that shows the memory limit for each container over the last three hours.
Percentage of Memory Used by Container. A line chart that shows the percentage of memory used by each container over the last three hours.
Current and Max Memory Usage. A line chart that shows the current and maximum memory used by each container over the last three hours.
Count of Page Faults by Container. A line chart that shows the number of page faults for each container over the last three hours.
Memory that Cannot be Reclaimed. A line chart that shows the amount of memory that cannot be reclaimed for each container over the last three hours.
RSS Memory by Container. A line chart that shows the amount of RSS memory for each container over the last three hours.
Network Usage
See information about network usage over the last three hours.
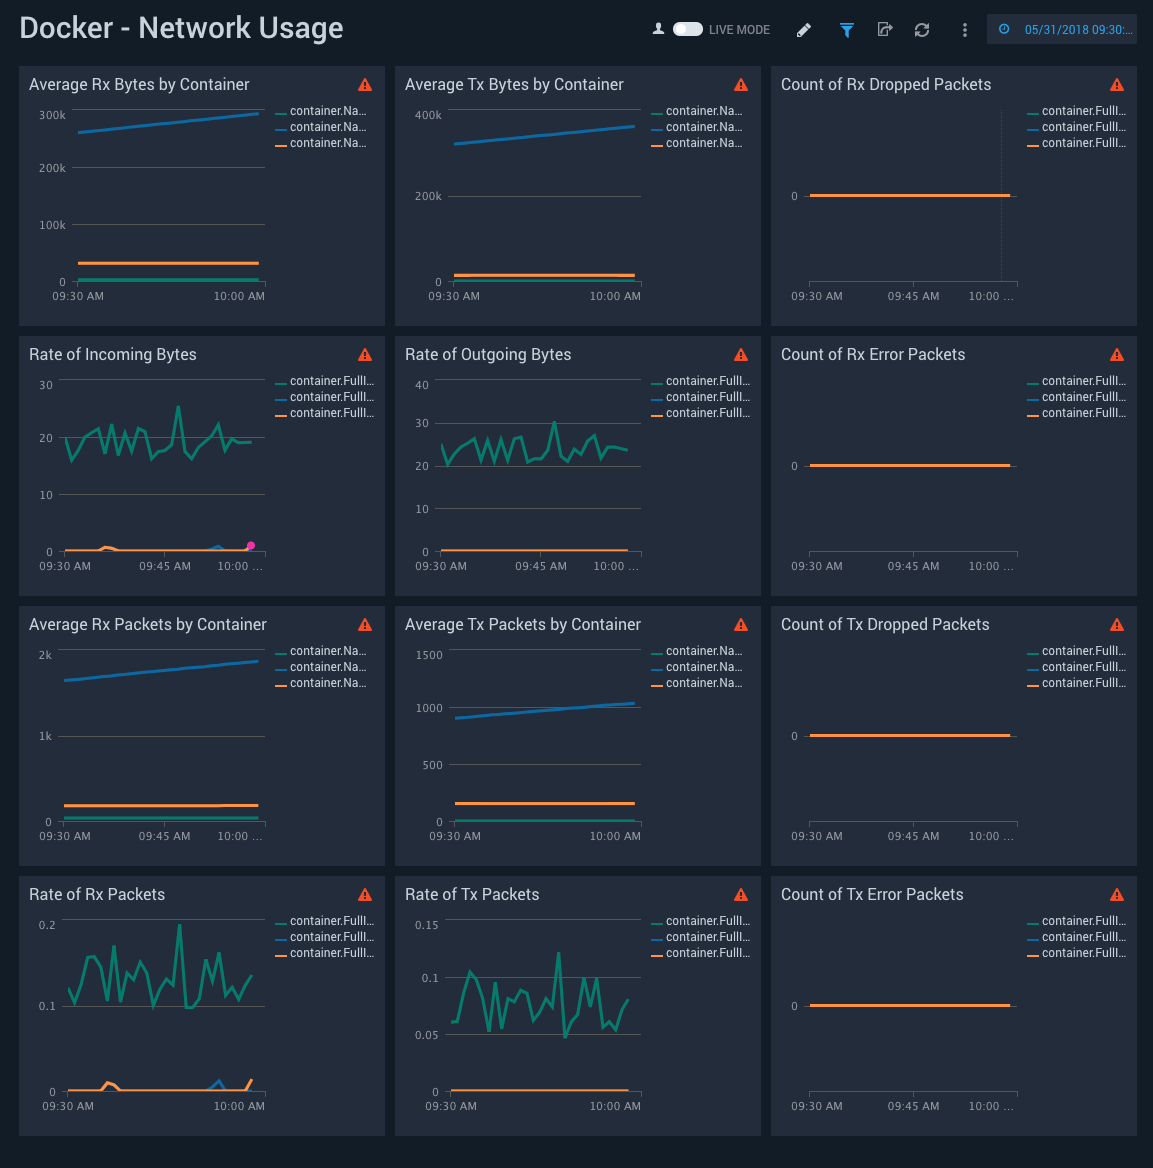
Average Rx Bytes by Container. A line chart that shows the average number of bytes received per timeslice by each container over the last three hours.
Average Tx Bytes by Container. A line chart that shows the average number of bytes transmitted per timeslice by each container over the last three hours.
Count of Rx Dropped Packets. A line chart that shows the count of received packets dropped by each container per timeslice over the last three hours.
Rate of Incoming Bytes. A line chart that shows the rate at which bytes were received per timeslice by each container over the last three hours.
Rate of Outgoing Bytes. A line chart that shows the rate at which bytes were transmitted per timeslice by each container over the last three hours.
Count of Rx Error Packets. A line chart that shows the count of error packets received per timeslice by each container over the last three hours.
Average Rx Packets by Container. A line chart that shows the average packets received per timeslice by each container over the last three hours.
Average Tx Packets by Container. A line chart that shows the average packets transmitted per timeslice by each container over the last three hours.
Count of Tx Dropped Packets. A line chart that shows the count of packets dropped during transmission per timeslice by each container over the last three hours.
Rate of Rx Packets. A line chart that shows the rate at which packets were received per timeslice by each container over the last three hours.
Rate of Tx Packets. A line chart that shows the rate at which packets were transmitted per timeslice by each container over the last three hours.
Count of Tx Error Packets. A line chart that shows the count of error packets transmitted per timeslice by each container over the last three hours.