Kubernetes
The Sumo Logic Kubernetes App provides visibility into the worker nodes that comprise a cluster, as well as application logs of the worker nodes. The App is a single-pane-of-glass through which you can monitor and troubleshoot container health, replication, load balancing, pod state and hardware resource allocation. It utilizes Falco events to monitor and detect anomalous container, application, host, and network activity.
In conjunction with the Kubernetes App, the AKS Control Plane, GKE Control Plane, EKS Control Plane, or Kubernetes Control Plane Apps provide visibility into the control plane, including the APIserver, scheduler, and controller manager.
Kubernetes is a system that automates the deployment, management, scaling, networking, and availability of container-based applications. Kubernetes container-orchestration allows you to easily deploy and manage multi-container applications at scale.
For an end-to-end solution for deploying, managing, monitoring, and administering your Kubernetes environment, see the Kubernetes Solution pages.
Supported versions
The Sumo Logic Kubernetes App is compatible with the Sumo Logic Kubernetes Collection Helm Chart. A list of supported platforms can be found here.
Log and Metric Types
The Sumo Logic App for Kubernetes uses logs and metrics.
Log Sources
- Application Logs
Metrics Sources
- Node-exporter Metrics - System-level statistics about bare-metal nodes or virtual machine and generates metrics.
- Kube-state-metrics - Metrics about the state of Kubernetes logical objects, including node status, node capacity (CPU and memory), number of desired/available/unavailable/updated replicas per deployment, pod status (e.g., waiting, running, ready), and containers.
For more information, see this page. Metrics are collected using Prometheus with Sumo Logic Distribution for OpenTelemetry Collector used for metadata enrichment.
Sample Log Message
{"timestamp":1561534865020,"log":"E0626 07:41:05.020255       1
manager.go:101] Error in scraping containers from kubelet:192.168.190.54:10255:
failed to get all container stats from Kubelet URL \"http://192.168.190.54:10255/stats/container/\":
Post http://192.168.190.54:10255/stats/container/: dial tcp 192.168.190.54:10255:
getsockopt: connection refused"}
Sample Query
 cluster = * and namespace = * and pod = * and container = *
| json field=_raw "log" as message
| fields - message | count container | top 10 container by _count
Collecting Metrics and Logs for the Kubernetes App
This section contains instructions for collecting logs and metrics for the Sumo App for Kubernetes.
Set the following fields in the Sumo Logic UI prior to configuring collection. This ensures that your logs are tagged with relevant metadata, which is required by the app dashboards and Explore.
clustercontainerdeploymenthostnamespacenodepodservice
For information on setting up fields, see the Fields help page.
Reference the Deployment Guide in our sumologic-kubernetes-collection GitHub repository for detailed instructions on how to collect Kubernetes logs, metrics, and events; enrich them with deployment, pod, and service level metadata; and send them to Sumo Logic.
The Deployment Guide has information on advanced configurations, best practices, performance, troubleshooting, and upgrading for our latest and previous versions of supported software.
Installing the Kubernetes App
Now that you have set up the collection for Kubernetes App, install the Sumo Logic App for Kubernetes to use the pre-configured Kubernetes dashboards that provide visibility into your Kubernetes environment.
To install the app, do the following:
- Locate and install the app from the App Catalog. If you want to see a preview of the dashboards included with the app before installing, click Preview Dashboards.
- From the App Catalog, search for Kubernetes and select the app.
- Click Add to Library.
- Complete the following fields:
- App Name. You can retain the existing name, or enter a name of your choice for the app.
- Data Source. For each the sources listed, enter a Custom Data Filter or Source Category, as follows:
- For Falco Log Source, leave Source Category selected, and enter the source category according to configuration for
sumologic.logs.container.sourceCategoryin values.yaml. - For Events Log Source, leave Source Category selected, and for the source category, enter events or one that matches the source categories in your environment.
- For Falco Log Source, leave Source Category selected, and enter the source category according to configuration for
- Advanced. Select the location in the Library (the default is the Personal folder in the Library), or click New Folder to add a new folder.
- Click Add to Library.
Installing Kubernetes Monitors
Sumo Logic has provided out-of-the-box alerts available through Sumo Logic monitors to help you quickly determine if the Kubernetes cluster is available and performing as expected. These alerts are built based on metrics datasets and have preset thresholds based on industry best practices and recommendations.
- To install these alerts, you need to have the Manage Monitors role capability.
- Alerts can be installed by either importing them a JSON or a Terraform script.
For details on the individual alerts, see Kubernetes Alerts.
Method A: Importing a JSON file
- Download the JSON file describing all the monitors.
- The alerts should be restricted to specific clusters and/or namespaces to prevent the monitors hitting the cardinality limits. To limit the alerts, update the JSON file by replacing the text
$$kubernetes_data_sourcewith<Your Custom Filter>. For example:cluster=k8s-prod.01. - Go to Manage Data > Alerts > Monitors.
- Click Add:

- Click Import to import monitors from the JSON above.
The monitors are disabled by default. Once you have installed the alerts using this method, navigate to the Kubernetes folder under Monitors to configure them. See this document to enable monitors, to configure each monitor, to send notifications to teams or connections please see the instructions detailed in Step 4 of this document.
Method B: Using a Terraform script
- Generate a Sumo Logic access key and ID for a user that has the Manage Monitors role capability in Sumo Logic using these instructions. Please identify which deployment your Sumo Logic account is in, using this /docs/api/getting-started#Sumo-Logic-Endpoints-by-Deployment-and-Firewall-Security"> link.
- Download and install Terraform 0.13 or later.
- Download the Sumo Logic Terraform package for Kubernetes alerts. The alerts package is available in the Sumo Logic github repository. You can either download it through the
git clonecommand or as a zip file. - Alert Configuration. After the package has been extracted, navigate to the package directory
terraform-sumologic-sumo-logic-monitor/monitor_packages/kubernetes/.- Edit the kubernetes.auto.tfvars file and add the Sumo Logic Access Key, Access Id and Deployment from Step 1.
access_id   = "<SUMOLOGIC ACCESS ID>"
access_key  = "<SUMOLOGIC ACCESS KEY>"
environment = "<SUMOLOGIC DEPLOYMENT>" - The alerts should be restricted to specific clusters and/or namespaces to prevent the monitors hitting the cardinality limits. To limit the alerts, update the variable
kubernetes_data_sourcewith your<Your Custom Filter>. For example:cluster=k8s.prod.01. - All monitors are disabled by default on installation. If you would like to enable all the monitors, set the parameter
monitors_disabledtofalsein this file.
- Edit the kubernetes.auto.tfvars file and add the Sumo Logic Access Key, Access Id and Deployment from Step 1.
- By default, the monitors are configured in a monitor folder called “Kubernetes”, if you would like to change the name of the folder, update the monitor folder name in this file.
- If you would like the alerts to send email or connection notifications, modify the file kubernetes_notifications.auto.tfvars and populate
connection_notifications_critical,connection_notifications_warnings,connection_notifications_missingdataandemail_notifications_critical,email_notifications_warnings,email_notifications_missingdataas per below examples.
connection_notifications_critical = [
    {
      connection_type       = "PagerDuty",
      connection_id         = "<CONNECTION_ID>",
      payload_override      = "{\"service_key\": \"your_pagerduty_api_integration_key\",\"event_type\": \"trigger\",\"description\": \"Alert: Triggered {{TriggerType}} for Monitor {{Name}}\",\"client\": \"Sumo Logic\",\"client_url\": \"{{QueryUrl}}\"}",
      run_for_trigger_types = ["Critical", "ResolvedCritical"]
    },
    {
      connection_type       = "Webhook",
      connection_id         = "<CONNECTION_ID>",
      payload_override      = "",
      run_for_trigger_types = ["Critical", "ResolvedCritical"]
    }
  ]
Replace <CONNECTION_ID> with the connection id of the webhook connection. The webhook connection id can be retrieved by calling the Monitors API.
For overriding payload for different connection types, refer to this document.
email_notifications_critiical = [
    {
      connection_type       = "Email",
      recipients            = ["abc@example.com"],
      subject               = "Monitor Alert: {{TriggerType}} on {{Name}}",
      time_zone             = "PST",
      message_body          = "Triggered {{TriggerType}} Alert on {{Name}}: {{QueryURL}}",
      run_for_trigger_types = ["Critical", "ResolvedCritical"]
    }
  ]
- Install the Alerts:
- Navigate to the package directory
terraform-sumologic-sumo-logic-monitor/monitor_packages/kubernetes/and runterraform init. This will initialize Terraform and will download the required components. - Run
terraform planto view the monitors which will be created/modified by Terraform. - Run
terraform apply.
- Navigate to the package directory
- Post Installation. If you haven’t enabled alerts and/or configured notifications through the Terraform procedure outlined above, we highly recommend enabling alerts of interest and configuring each enabled alert to send notifications to other people or services. See Step 4 of this document.
There are limits to how many alerts can be enabled - see the Alerts FAQ.
Viewing Kubernetes Dashboards
Template variables provide dynamic dashboards that can rescope data on the fly. As you apply variables to troubleshoot through your dashboard, you view dynamic changes to the data for a quicker resolution to the root cause. You can use template variables to drill down and examine the data on a granular level. For more information, see Filter with template variables.
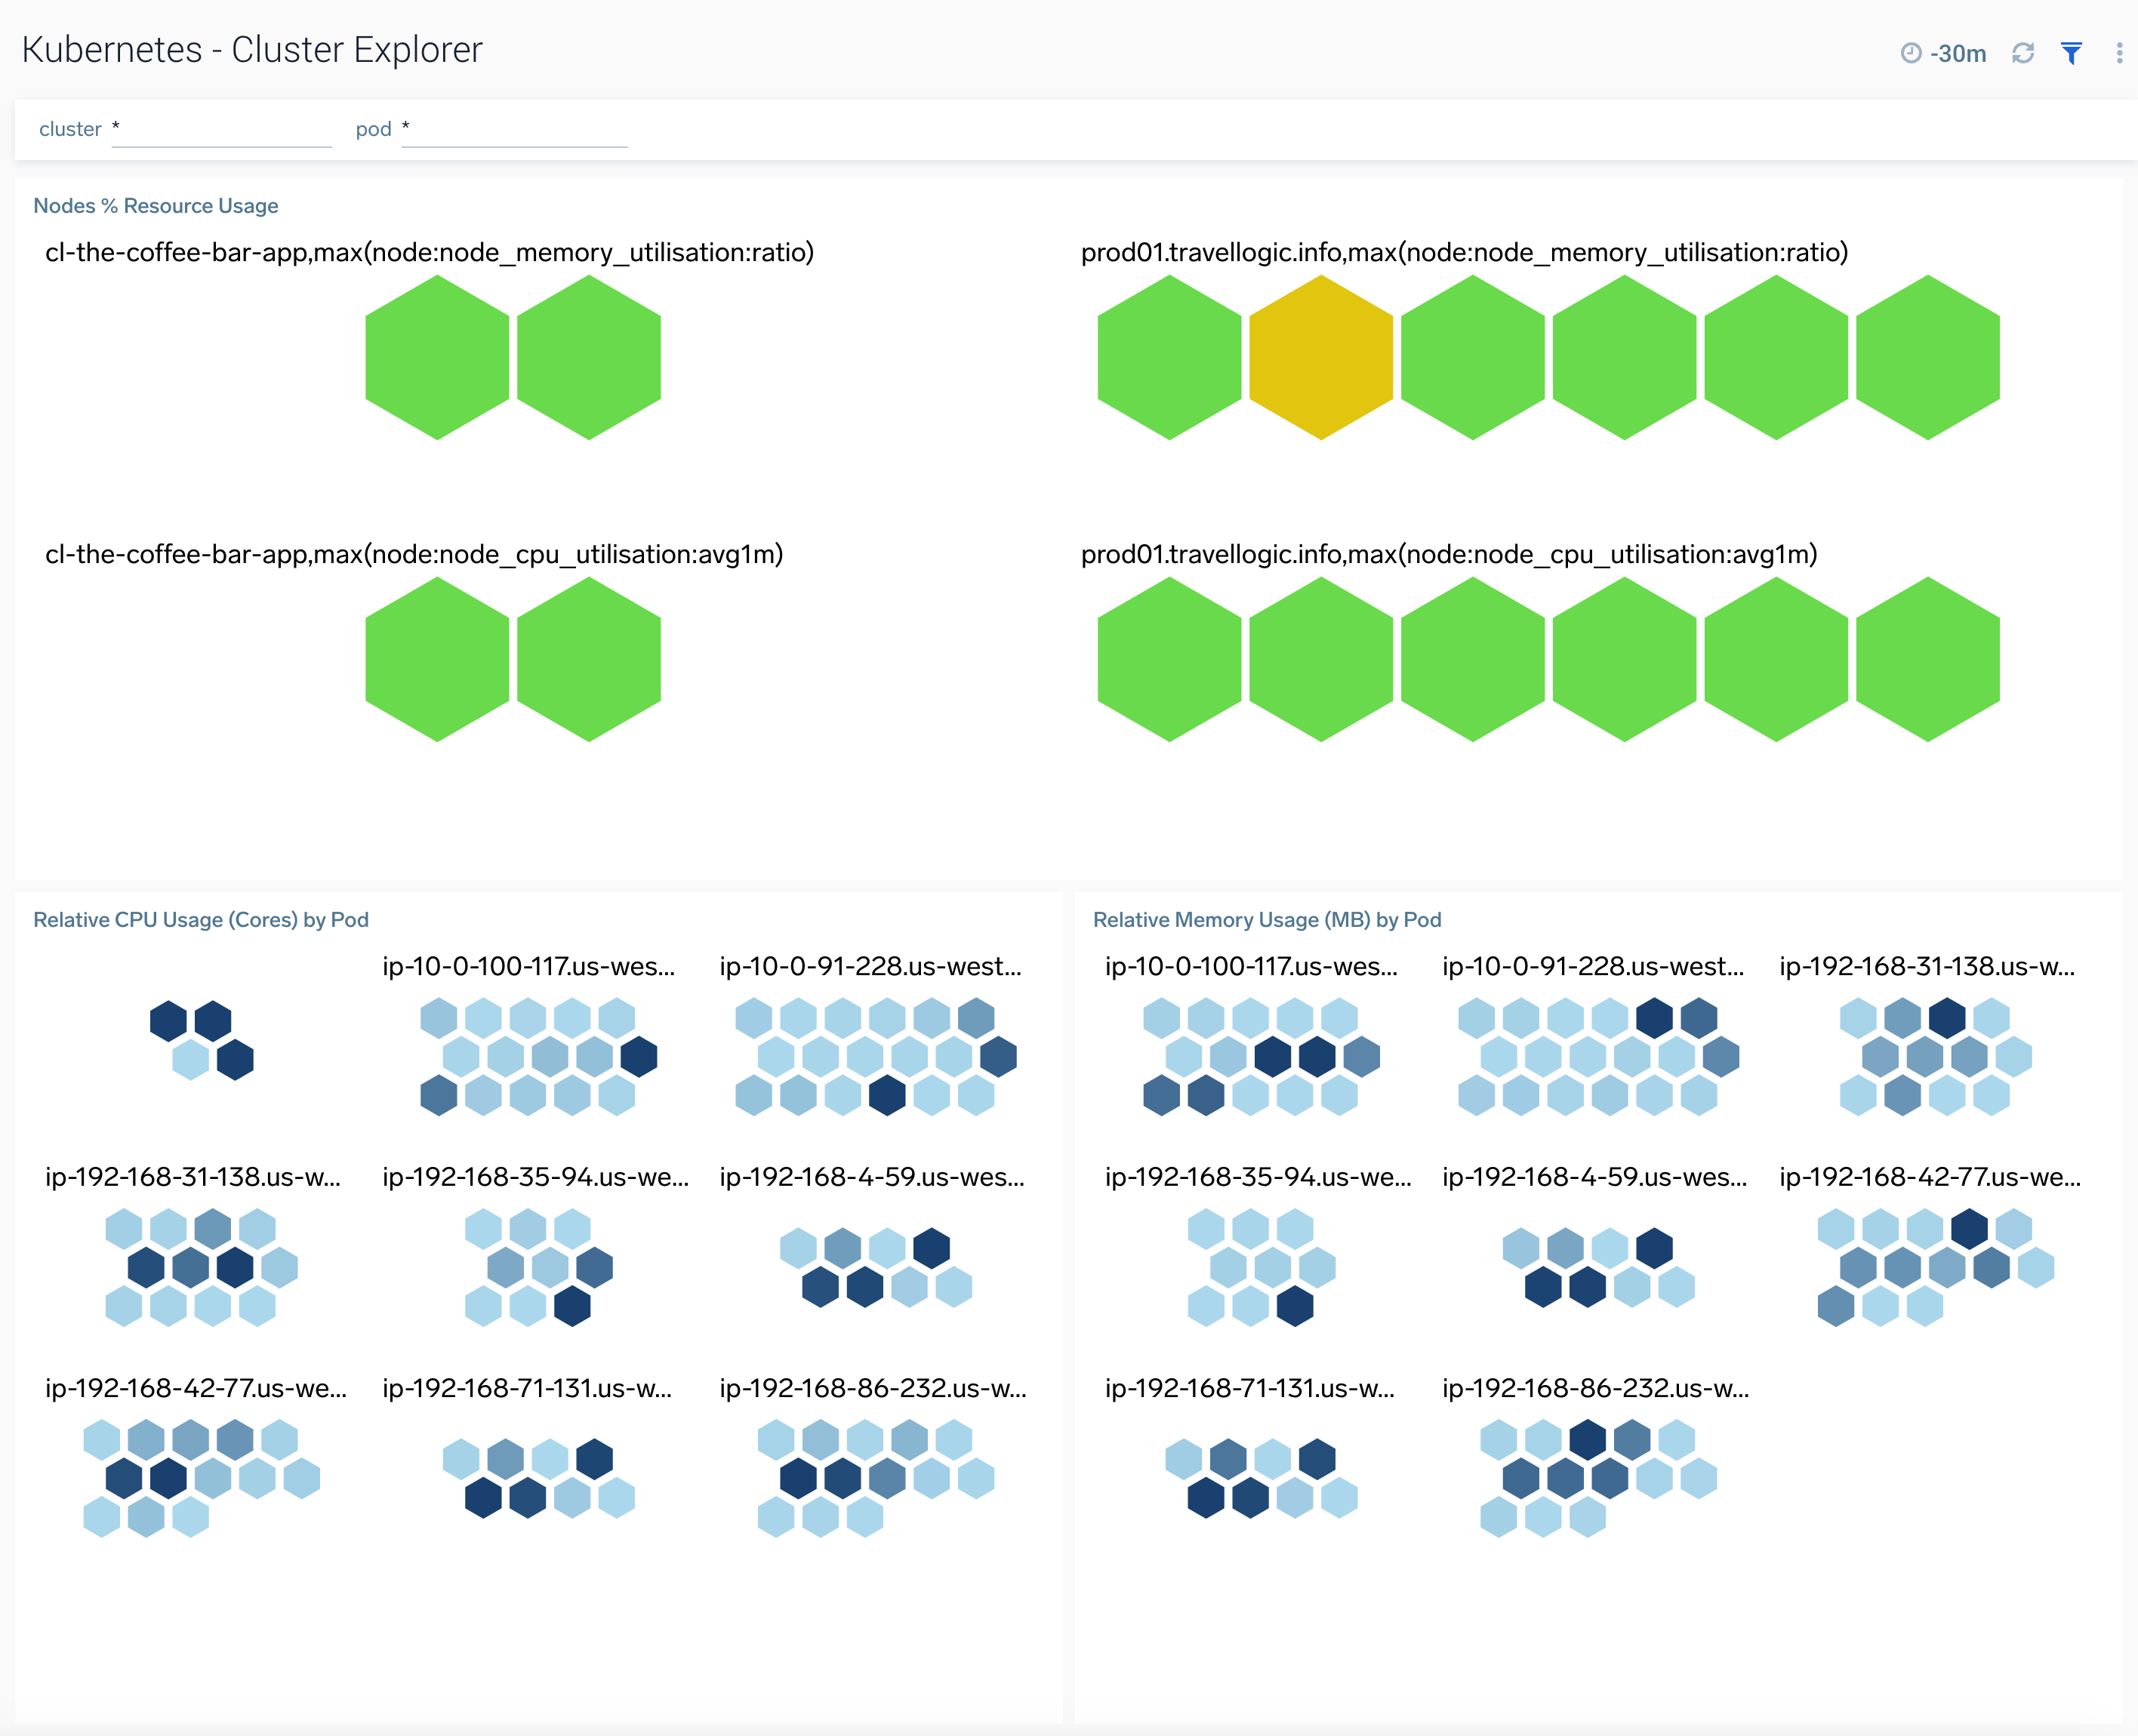
Cluster Explorer
The Kubernetes - Cluster Explorer dashboard provides a high-level view of the health of the cluster services, along with details on the utilized resources by service.
Use this dashboard to:
- Navigate the cluster topology
- Review the memory and CPU usage by cluster and service components.
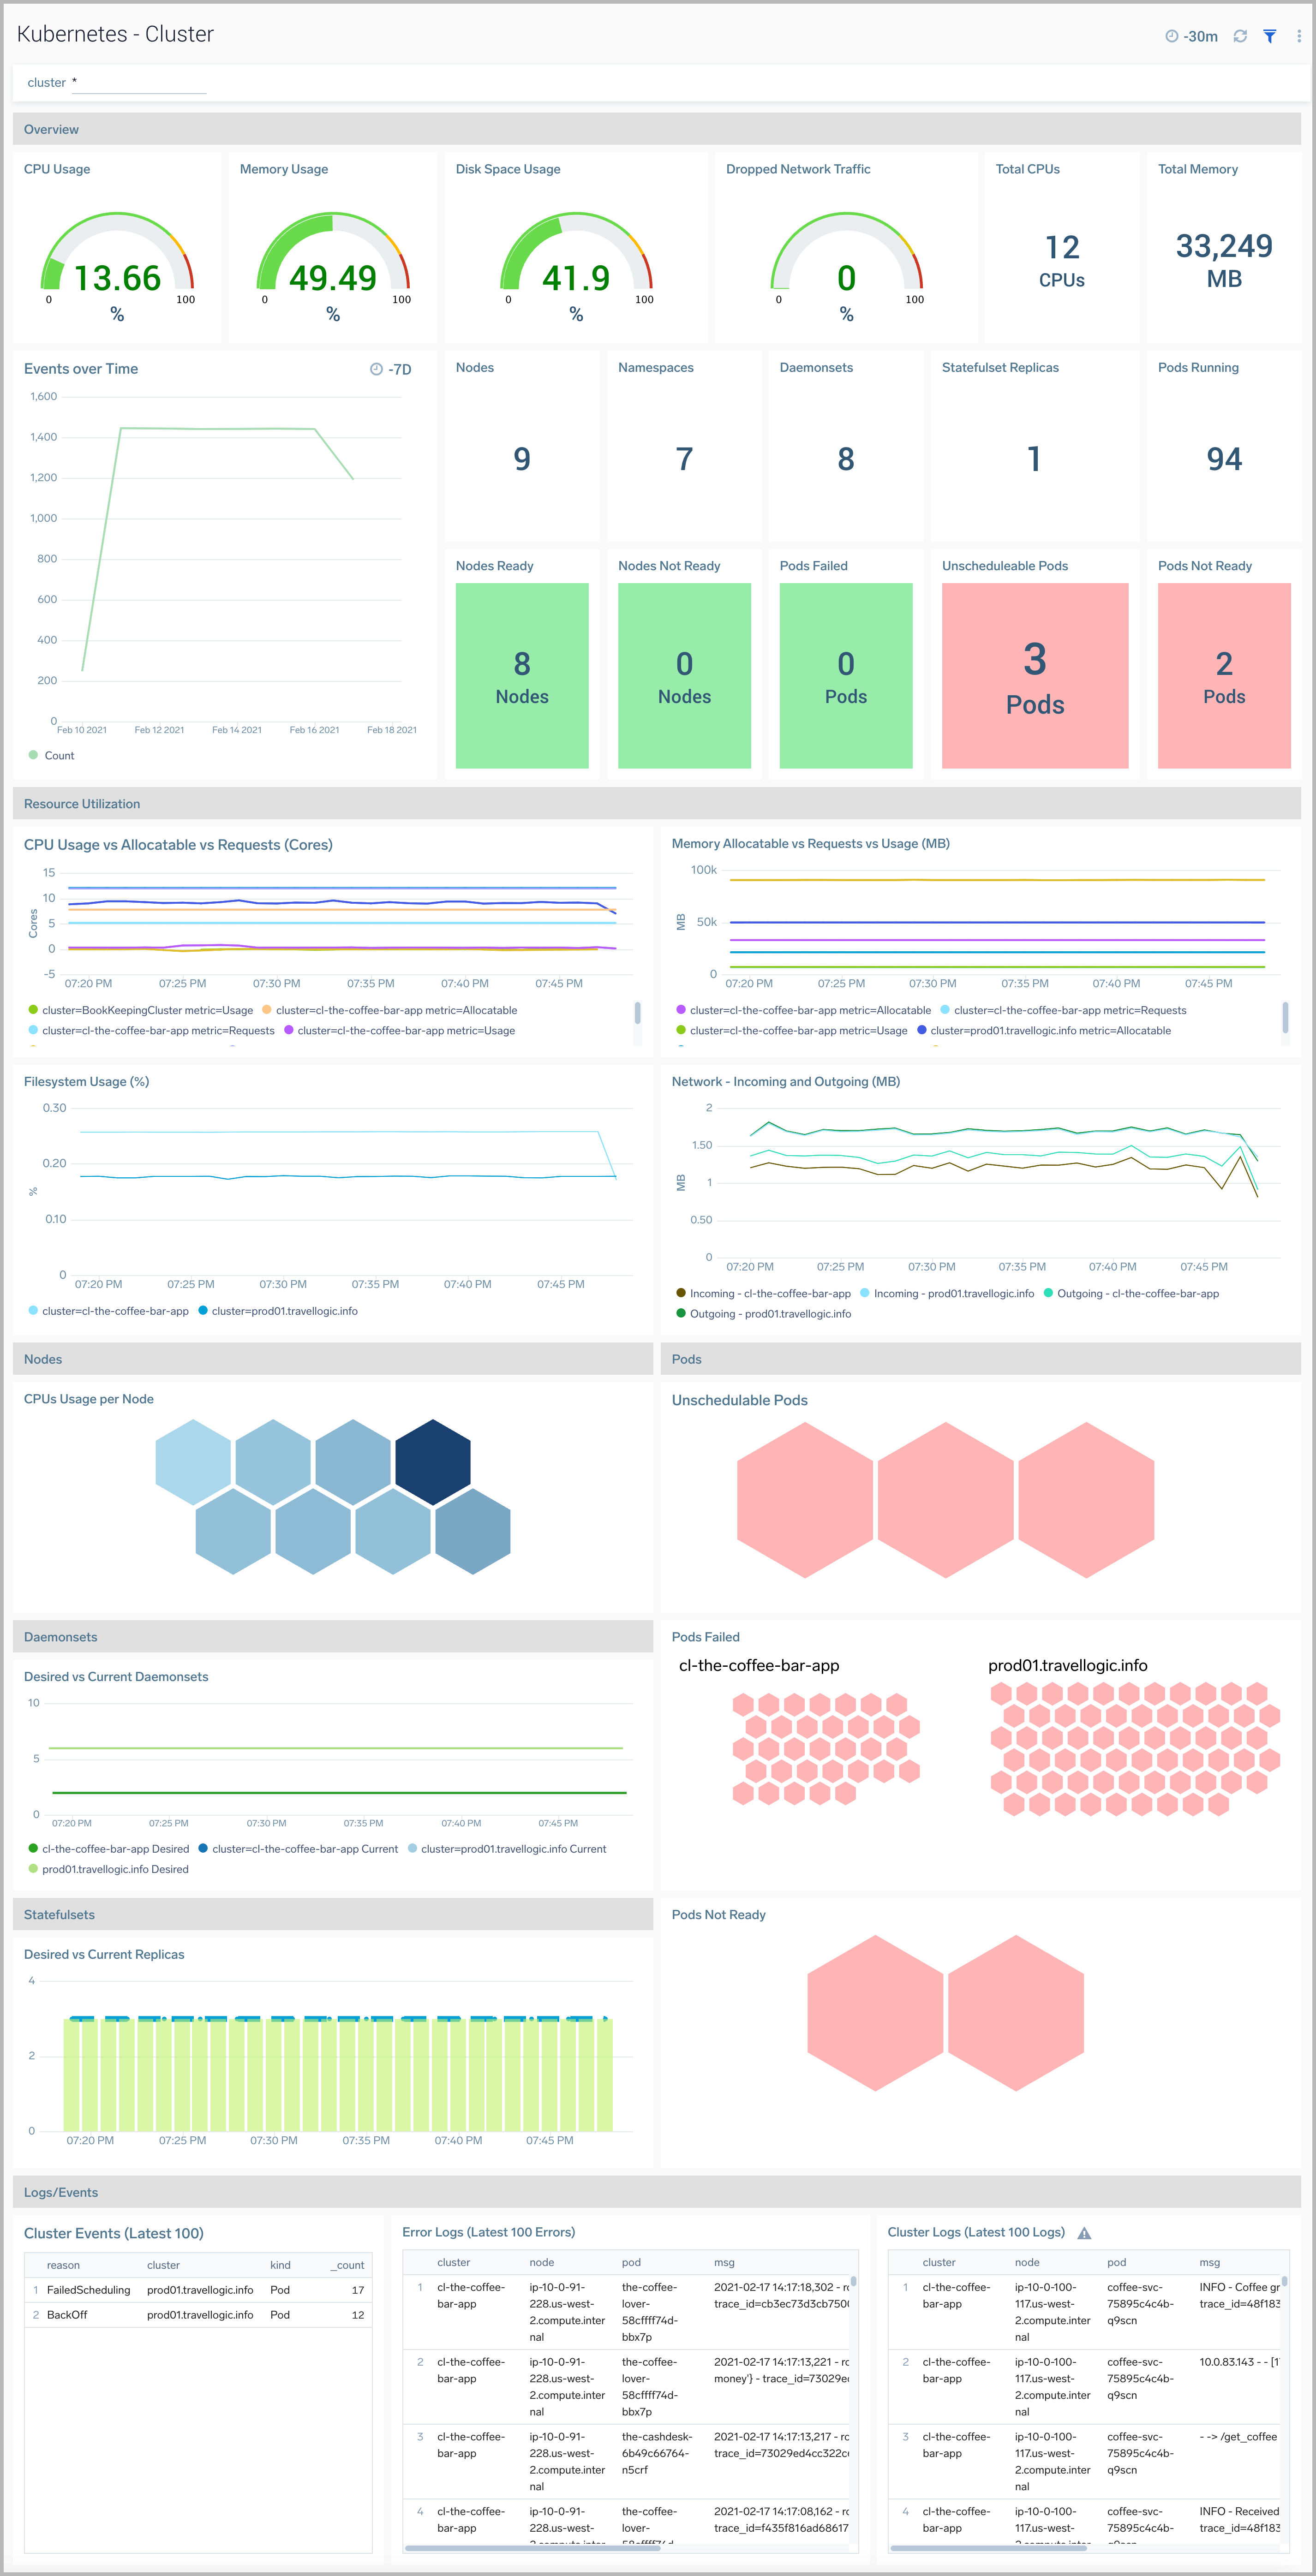
Cluster
The Kubernetes - Cluster dashboard provides detailed status of the cluster health, along with details on all the components, resources and related entities.
Use this dashboard to:
- Monitor overall cluster health.
- Get insight into the state and resource usage of cluster components and use this information to fine-tune your Kubernetes cluster.
- Get quick insights into the state of the related entities.
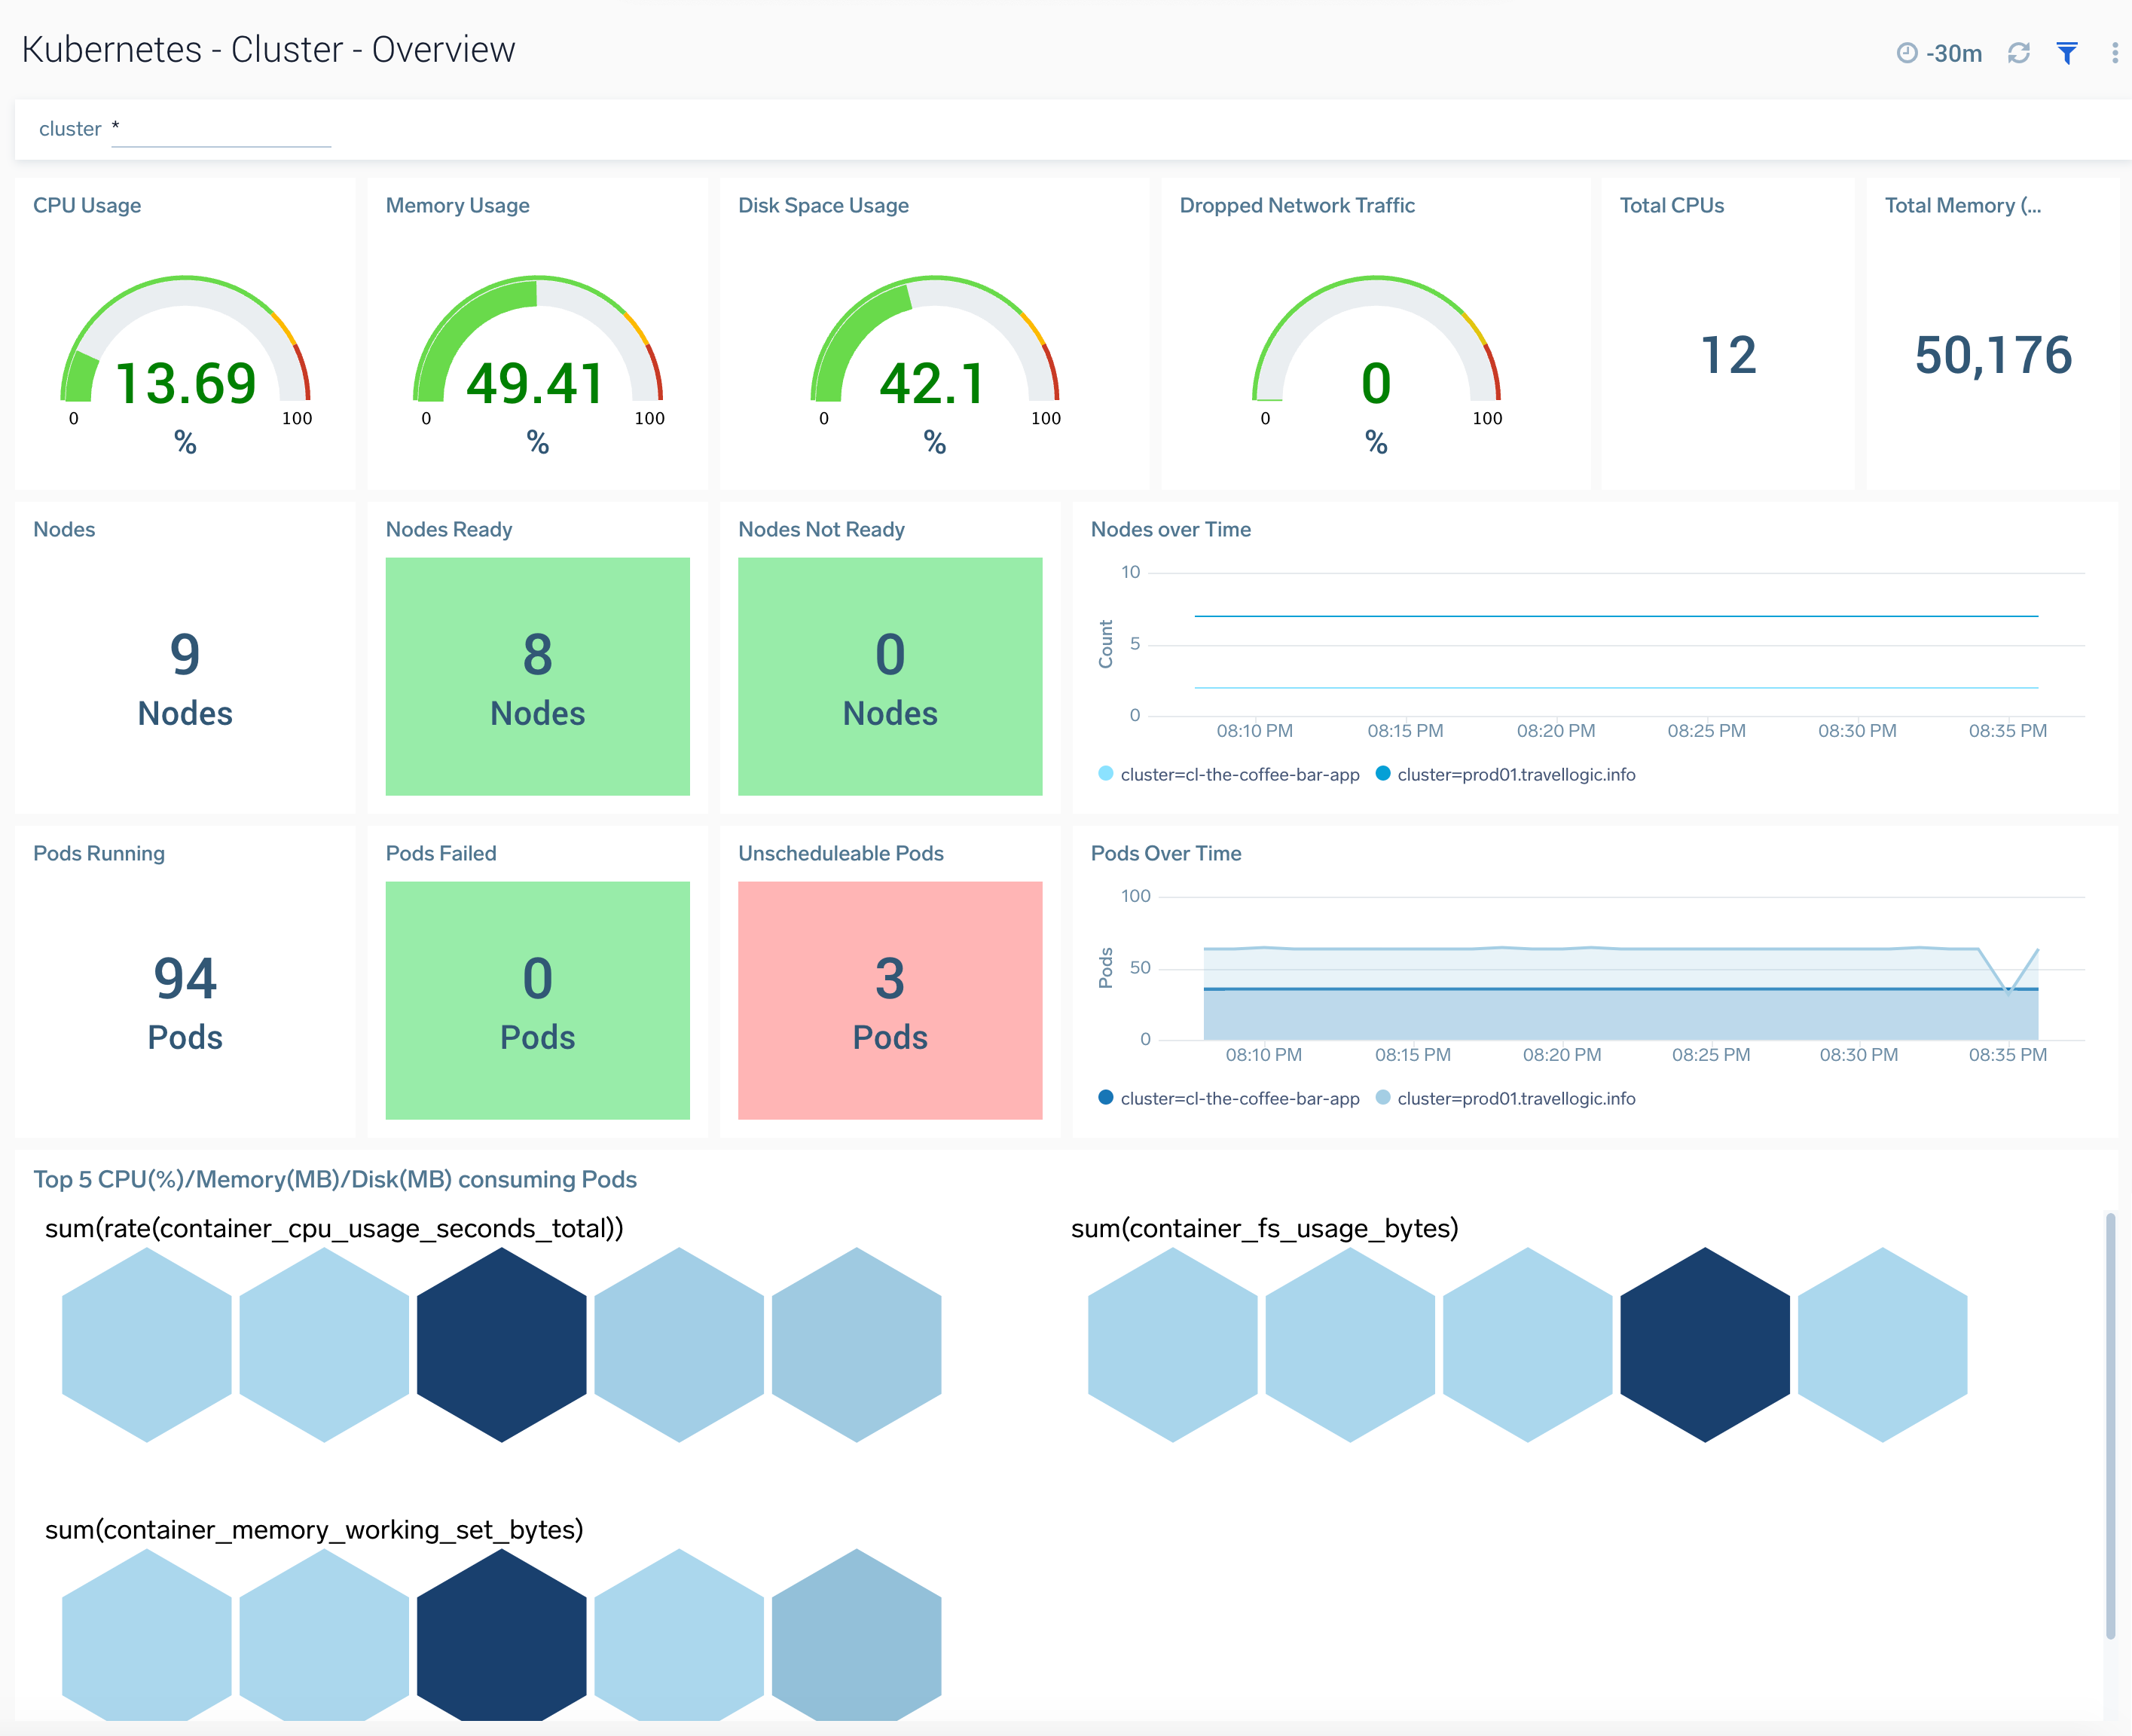
Cluster Overview
TheKubernetes - Cluster Overviewdashboard provides a high-level view of the cluster health. Use this dashboard to:
- Get quick insights into the health of the cluster.
- View top resource intensive components and use this information to fine tune your cluster.
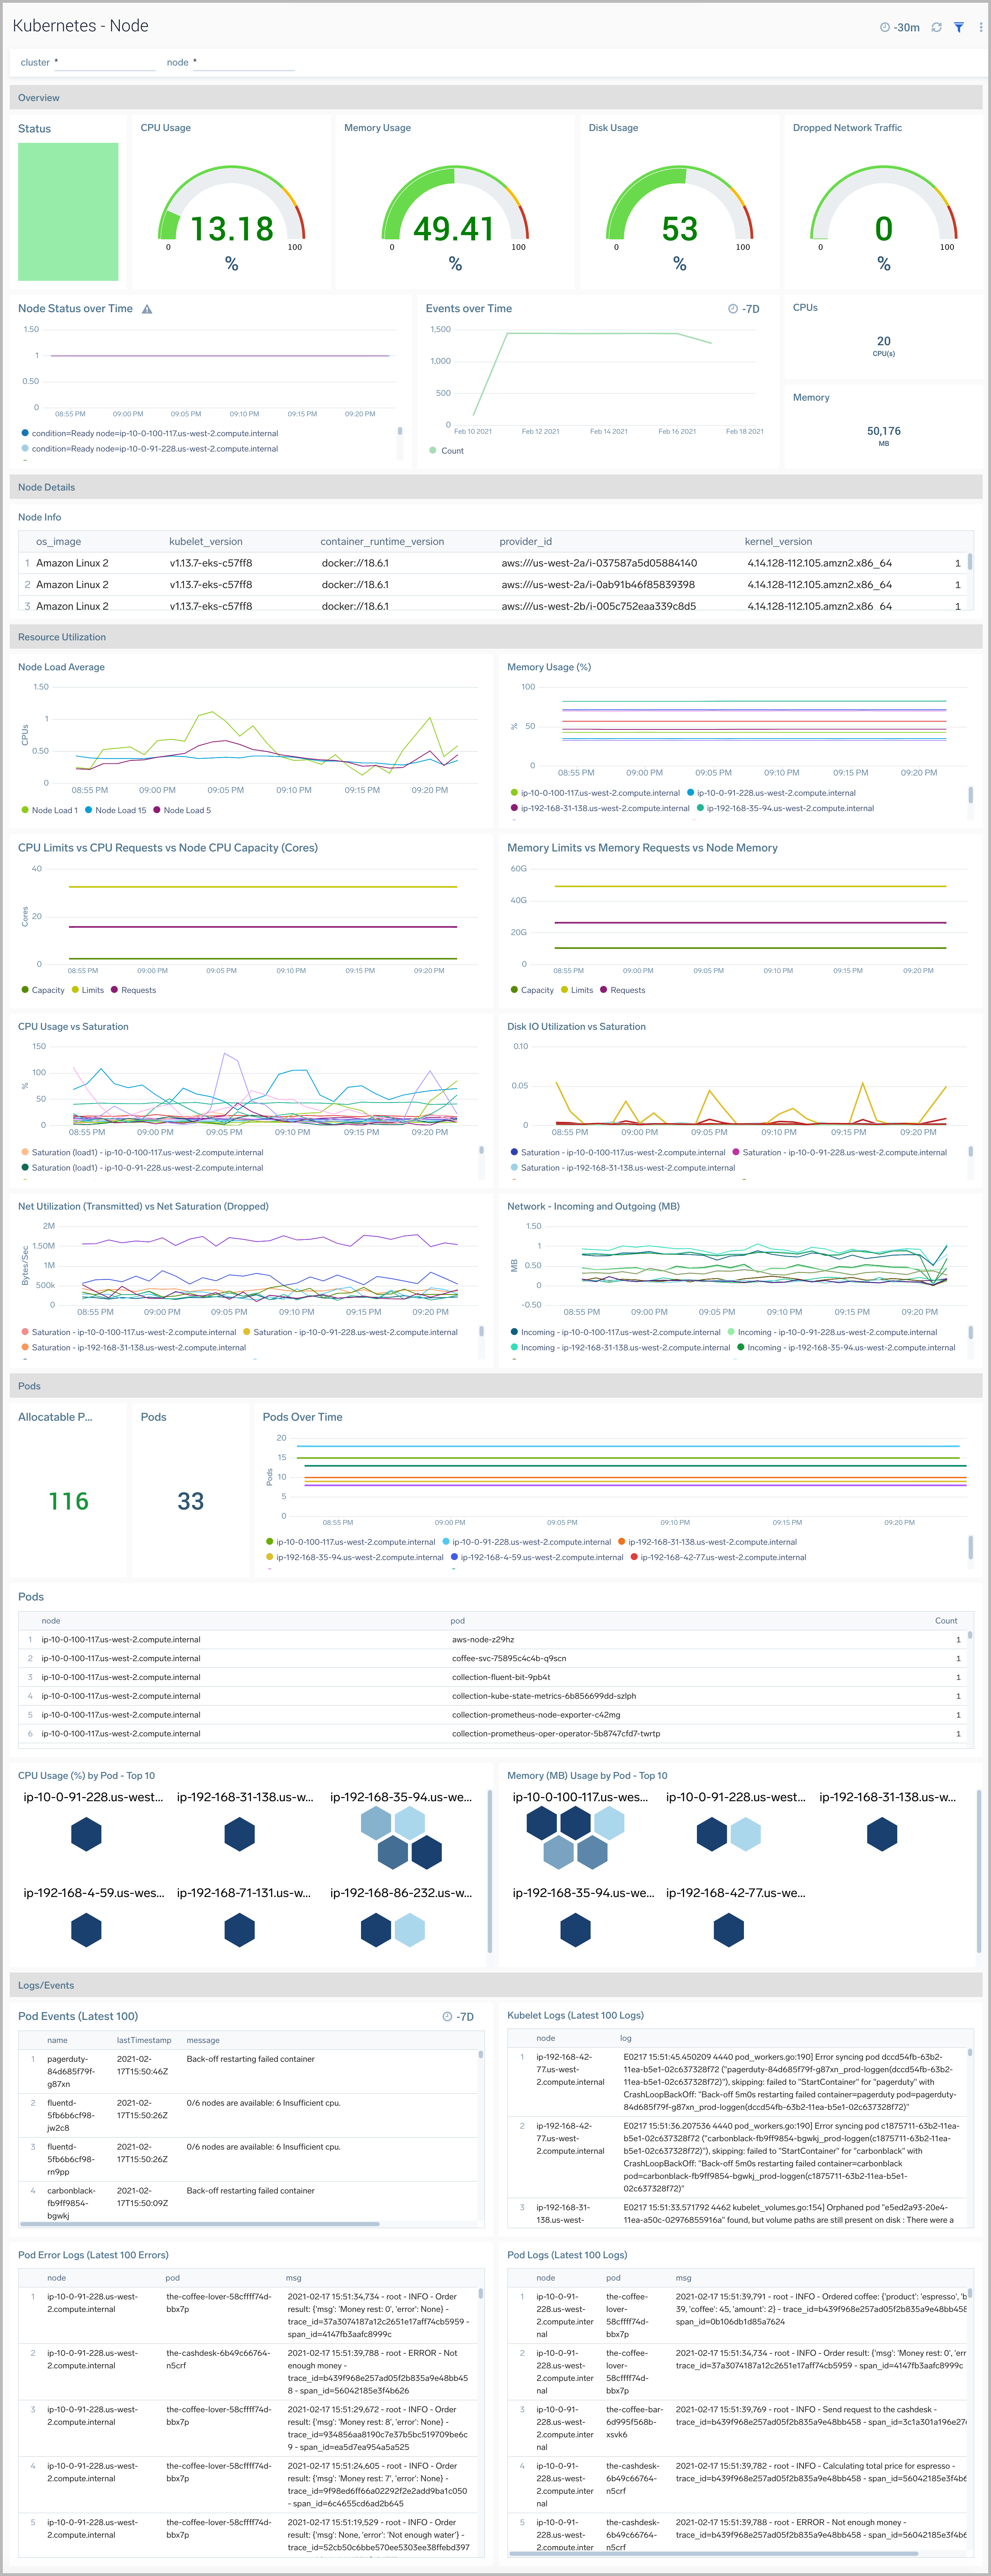
Node
The Kubernetes - Node dashboard provides detailed information on the health and performance of nodes in a Kubernetes cluster.
Use this dashboard to:
- Monitor node health.
- Get insight into how resources are being used across nodes and fine-tune node configurations accordingly.
- Investigate potential issues with nodes.
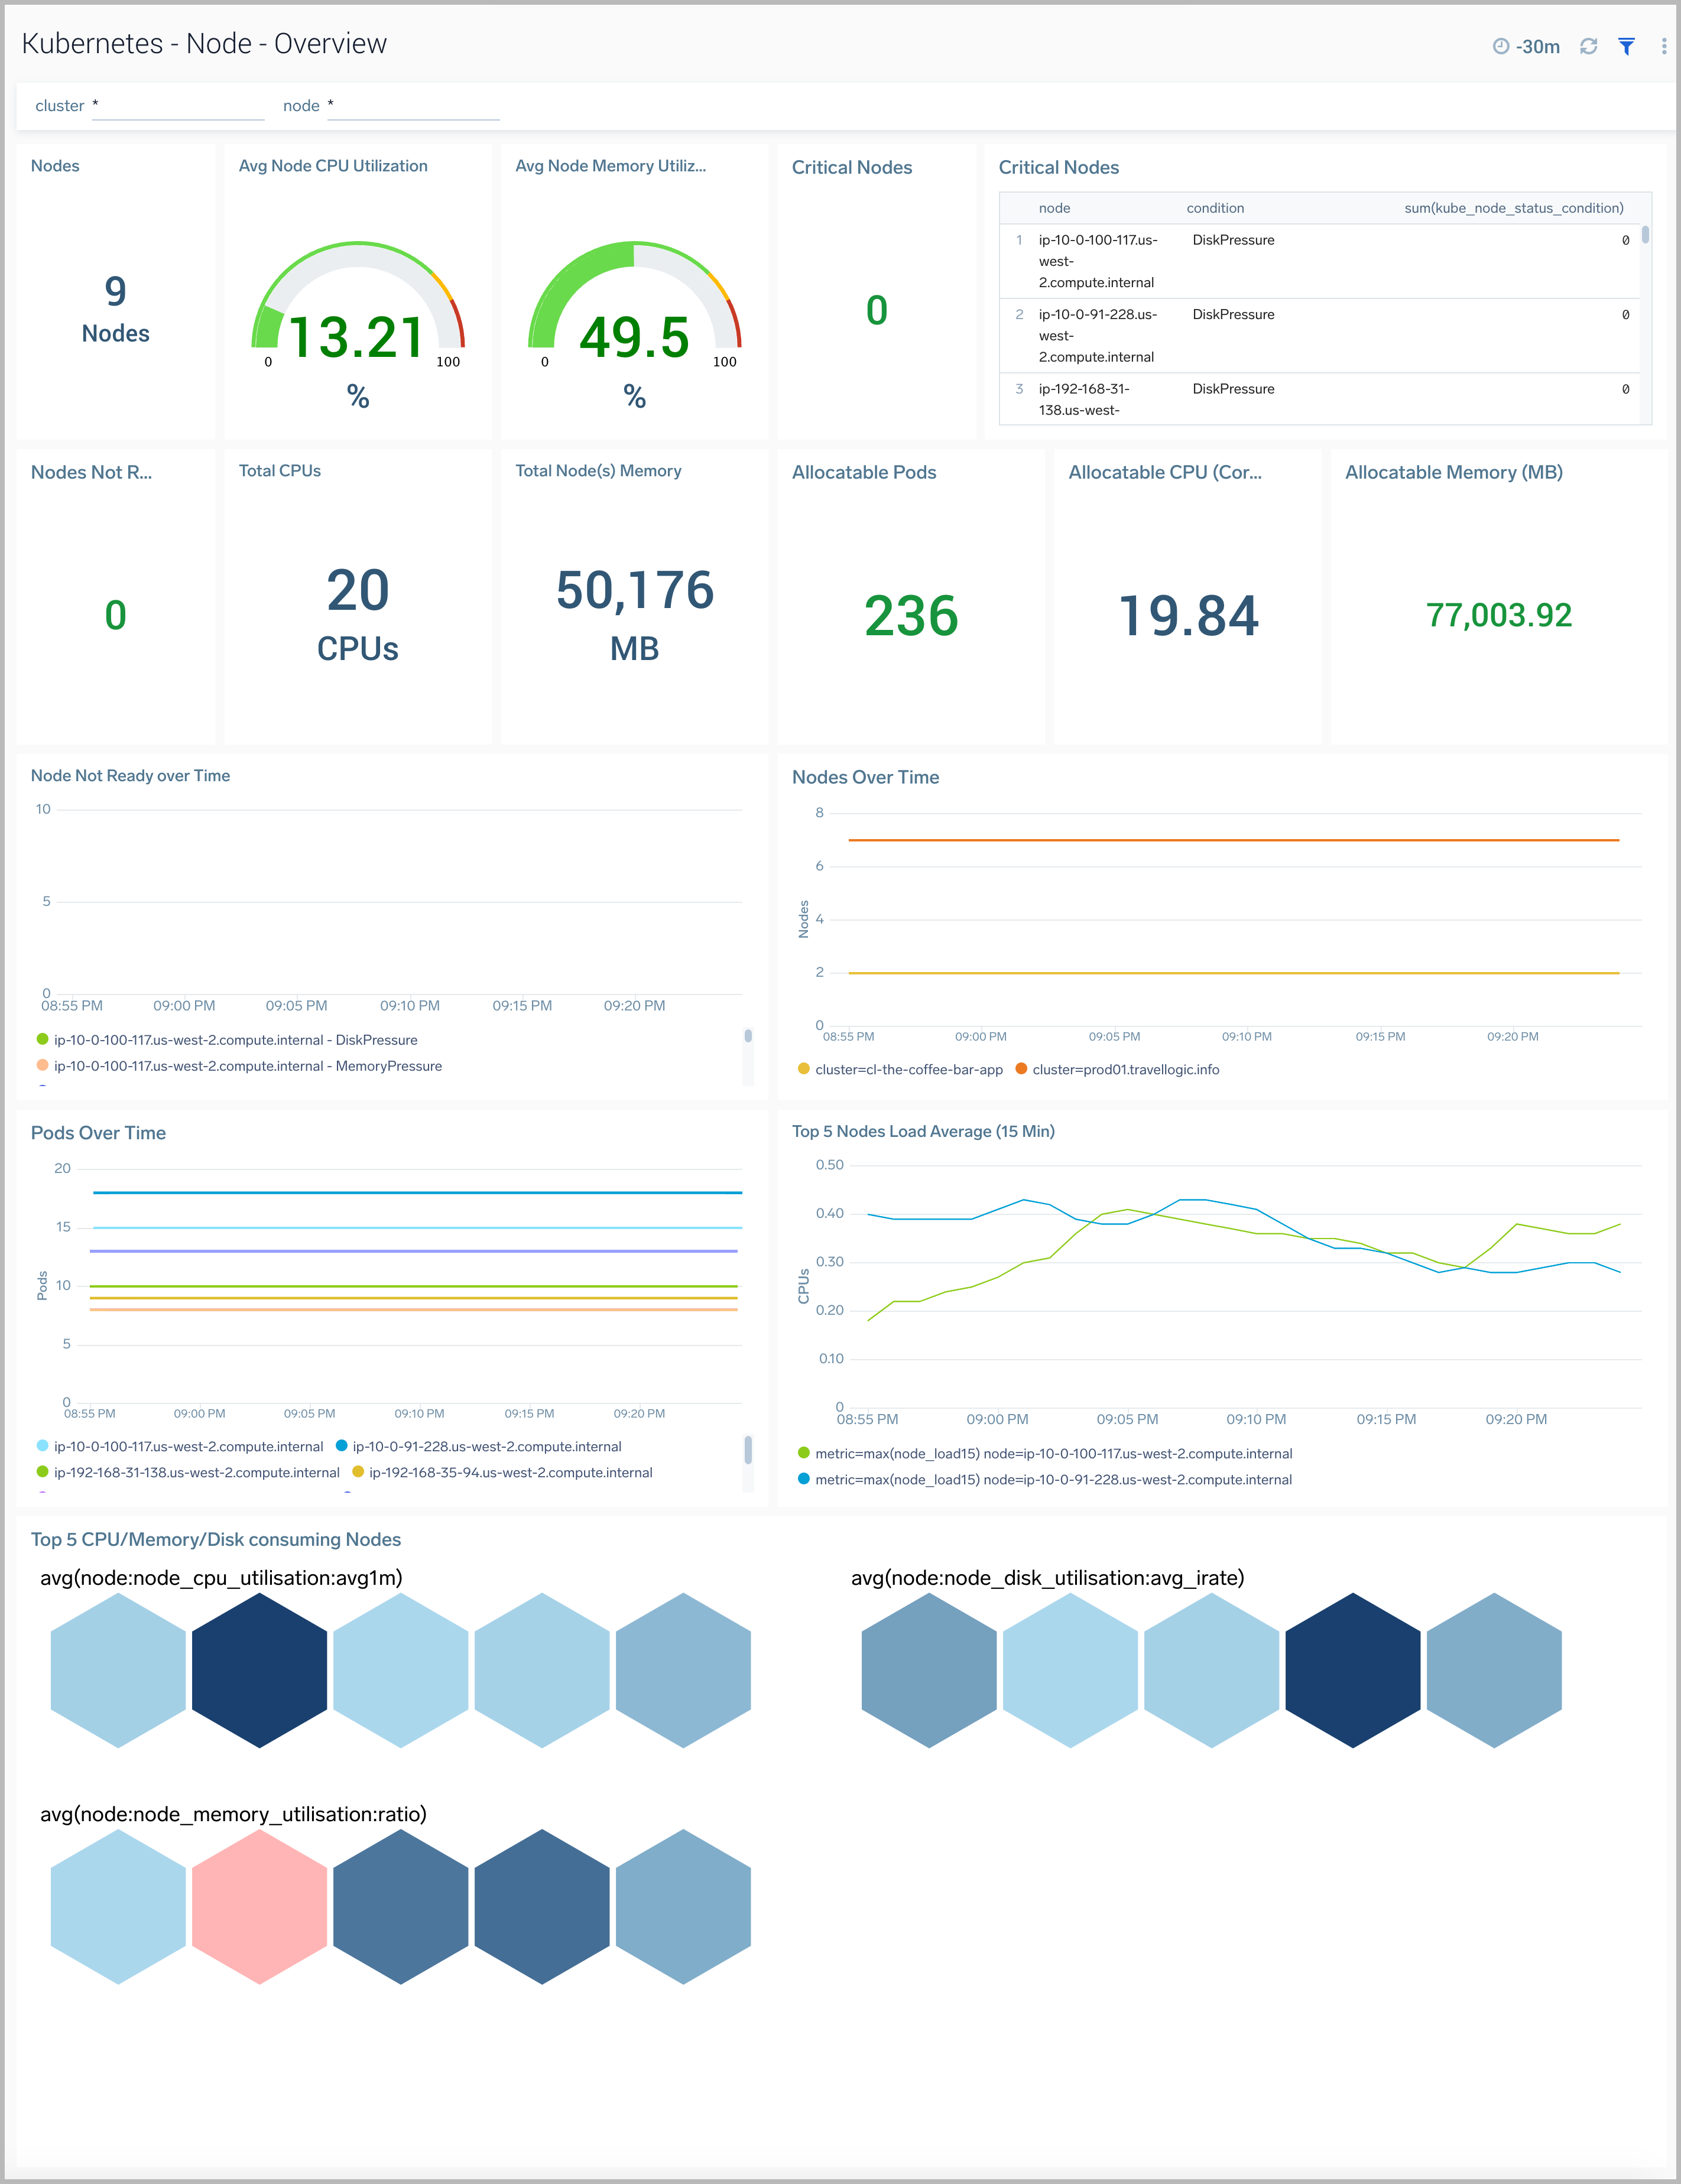
Node Overview
The Kubernetes - Node Overviewdashboard provides a high-level view of a node, along with details on all the related components and resources.
Use this dashboard to:
- Get quick insights into the health of the node.
- View top resource intensive components and use this information to fine tune your node.
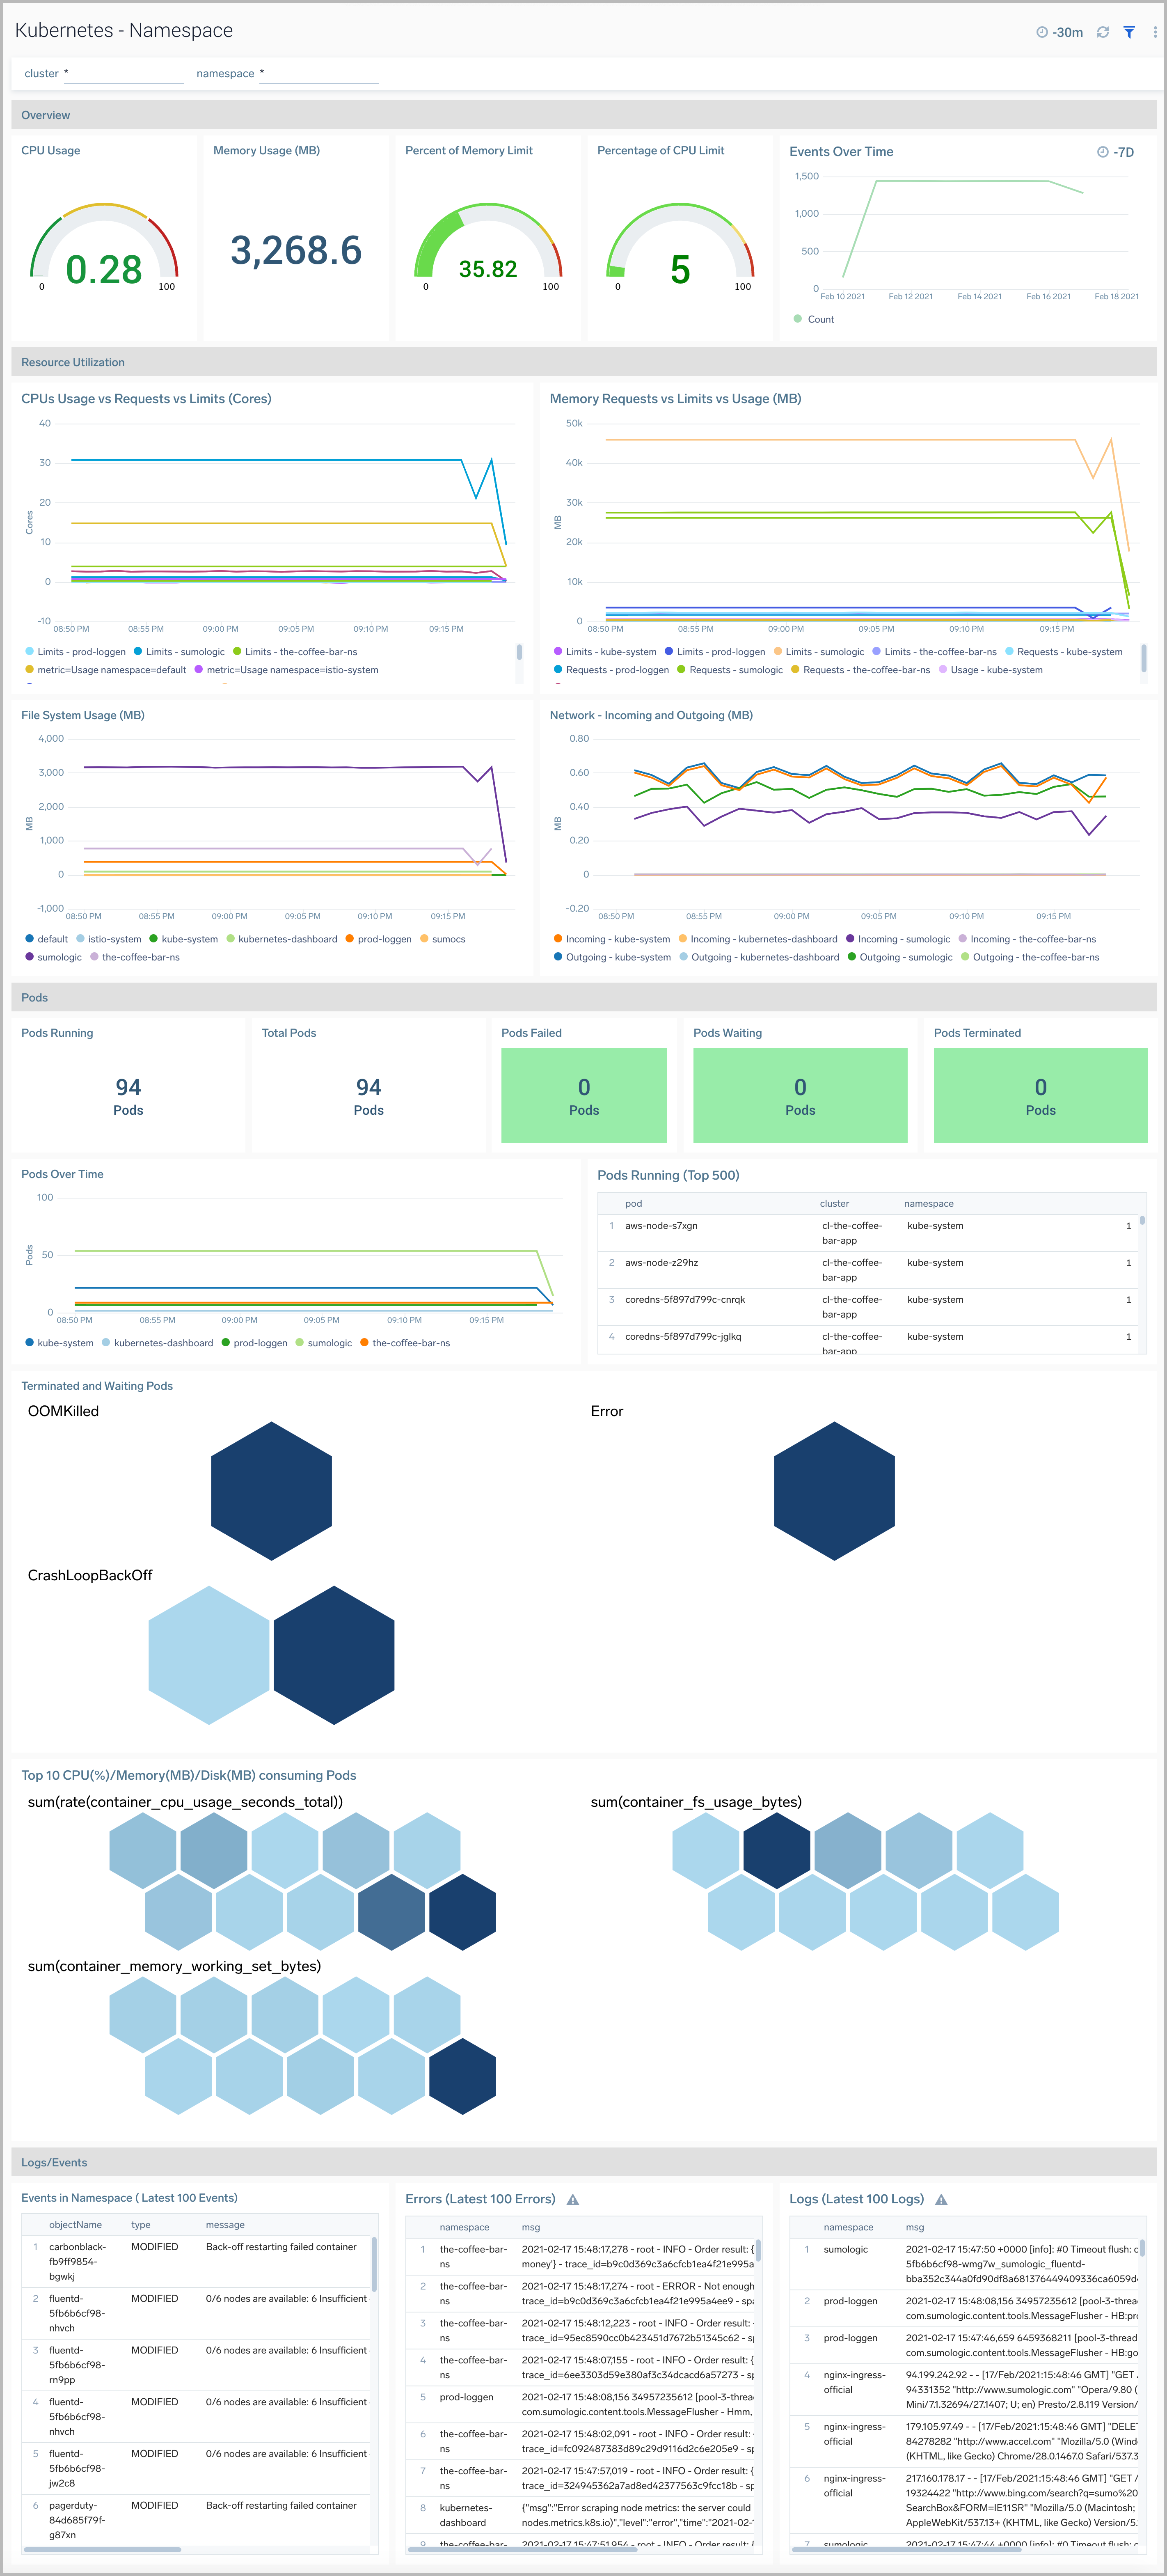
Namespace
The Kubernetes - Namespace dashboard provides insights into the health and resource utilization of a namespace.
Use this dashboard to:
- Monitor namespace health.
- Get insight into the components of a namespace and how resources are being used across namespaces and fine-tune configurations accordingly.
- Investigate potential issues.
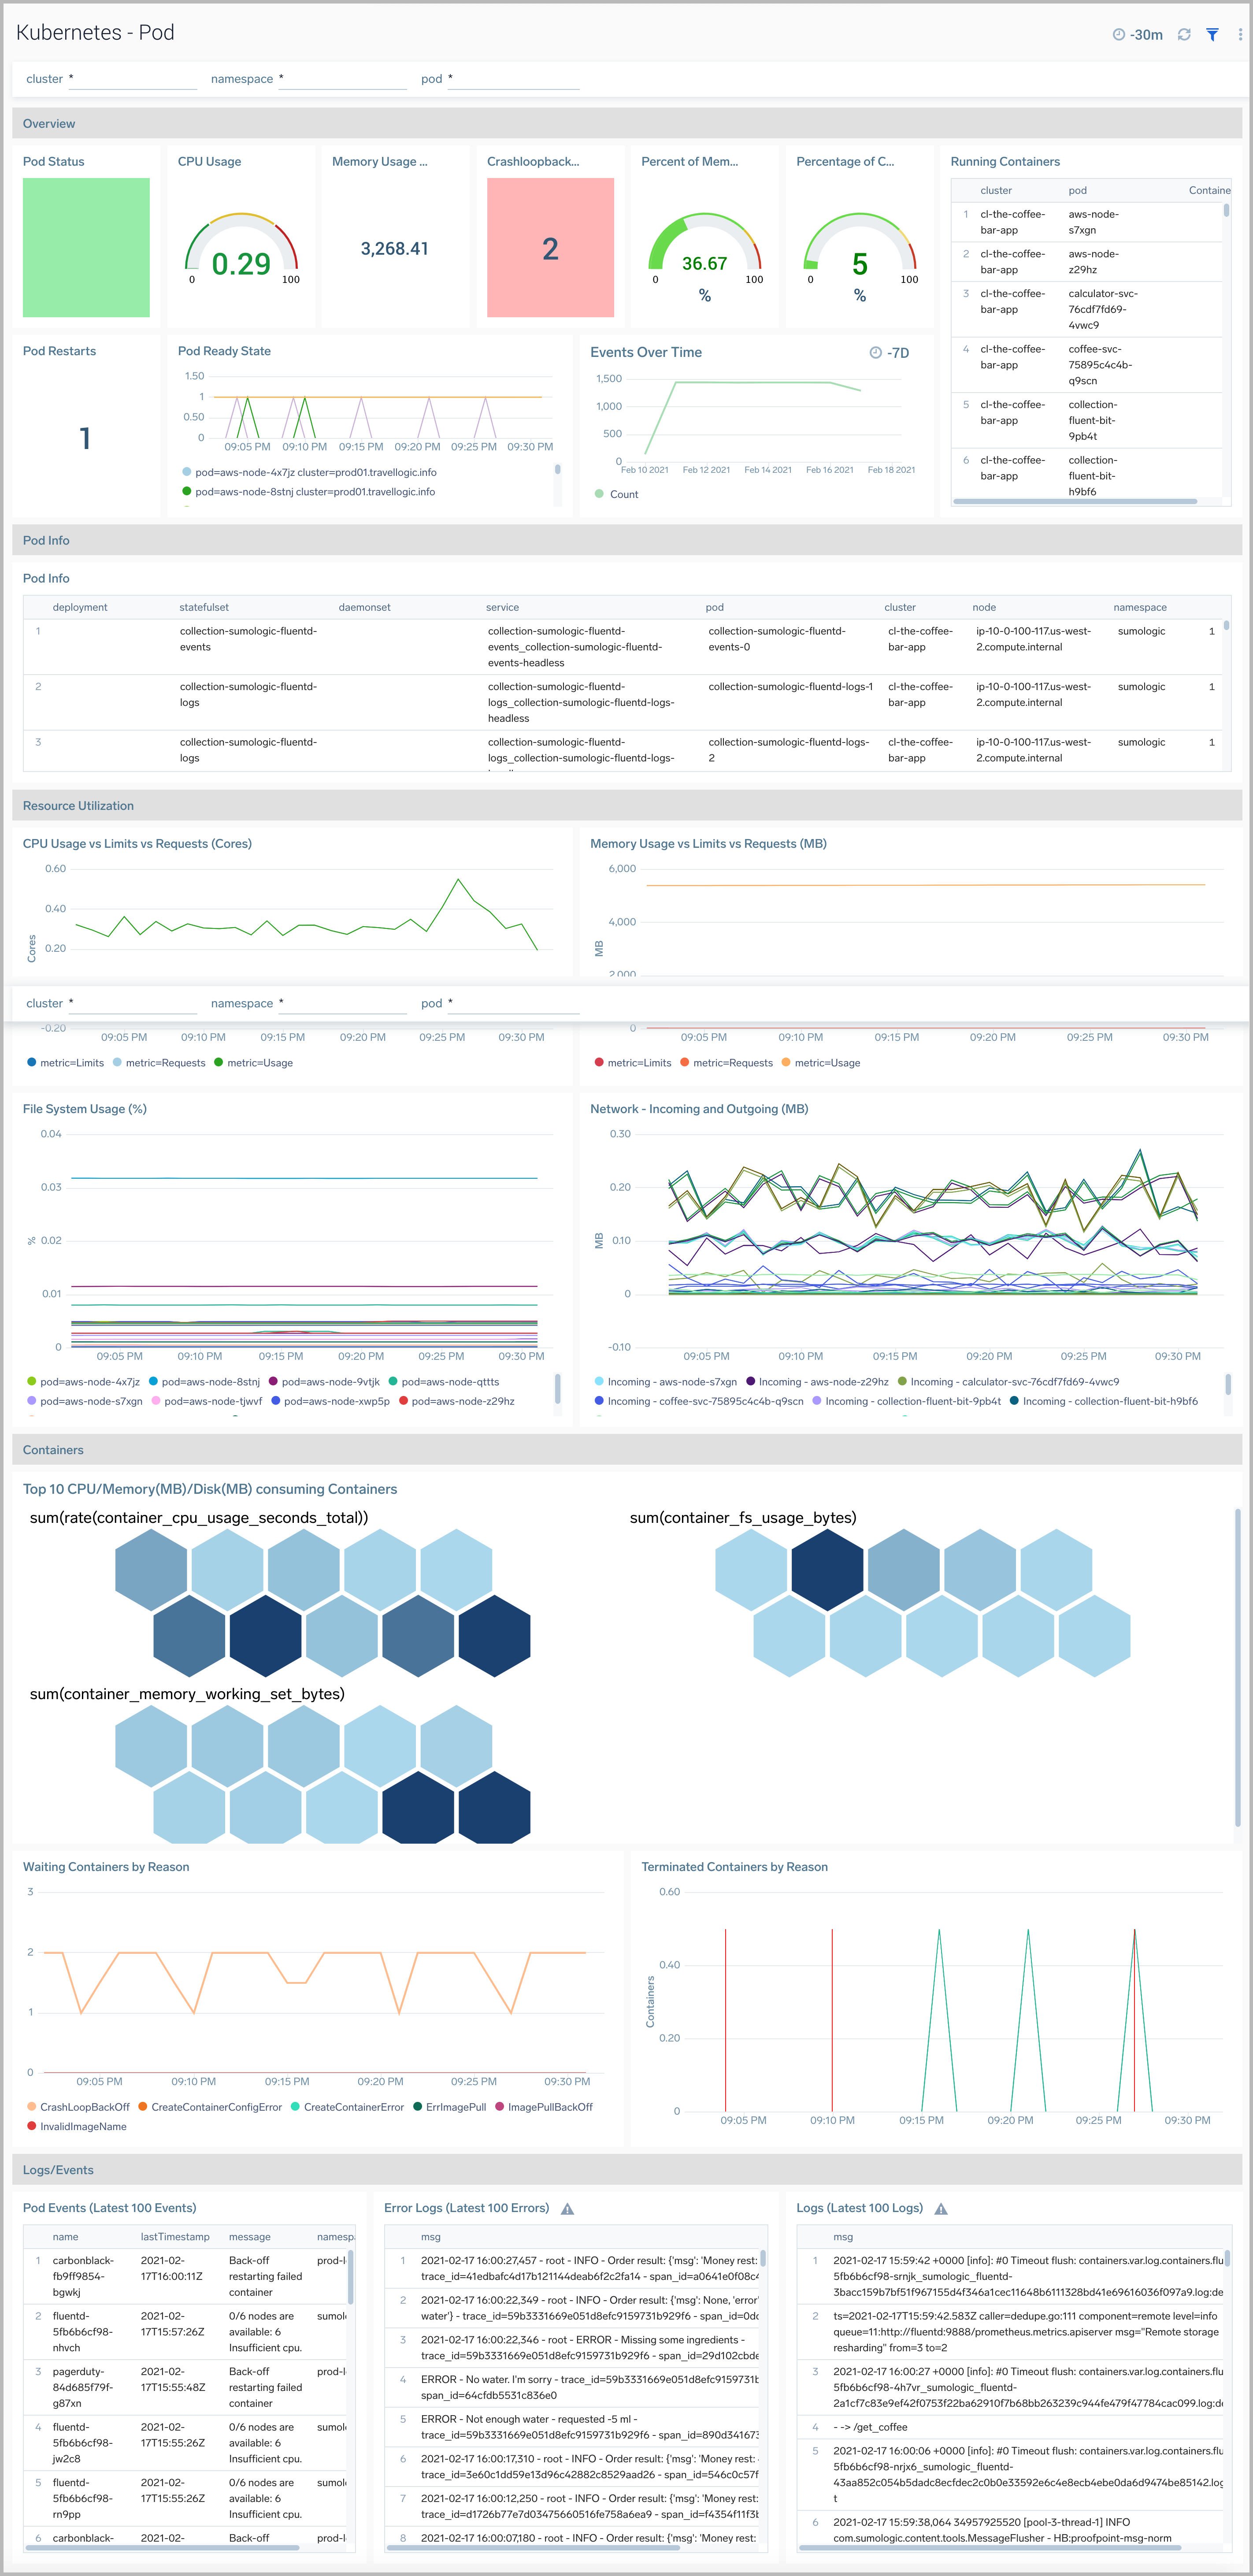
Pod
The Kubernetes - Pod dashboard provides insights into the health of and resource utilization of a Kubernetes pod.
Use this dashboard to:
- Monitor pod health.
- Get insight into the components of a pod and how resources are being used across namespaces and fine-tune configurations accordingly.
- Investigate potential issues.
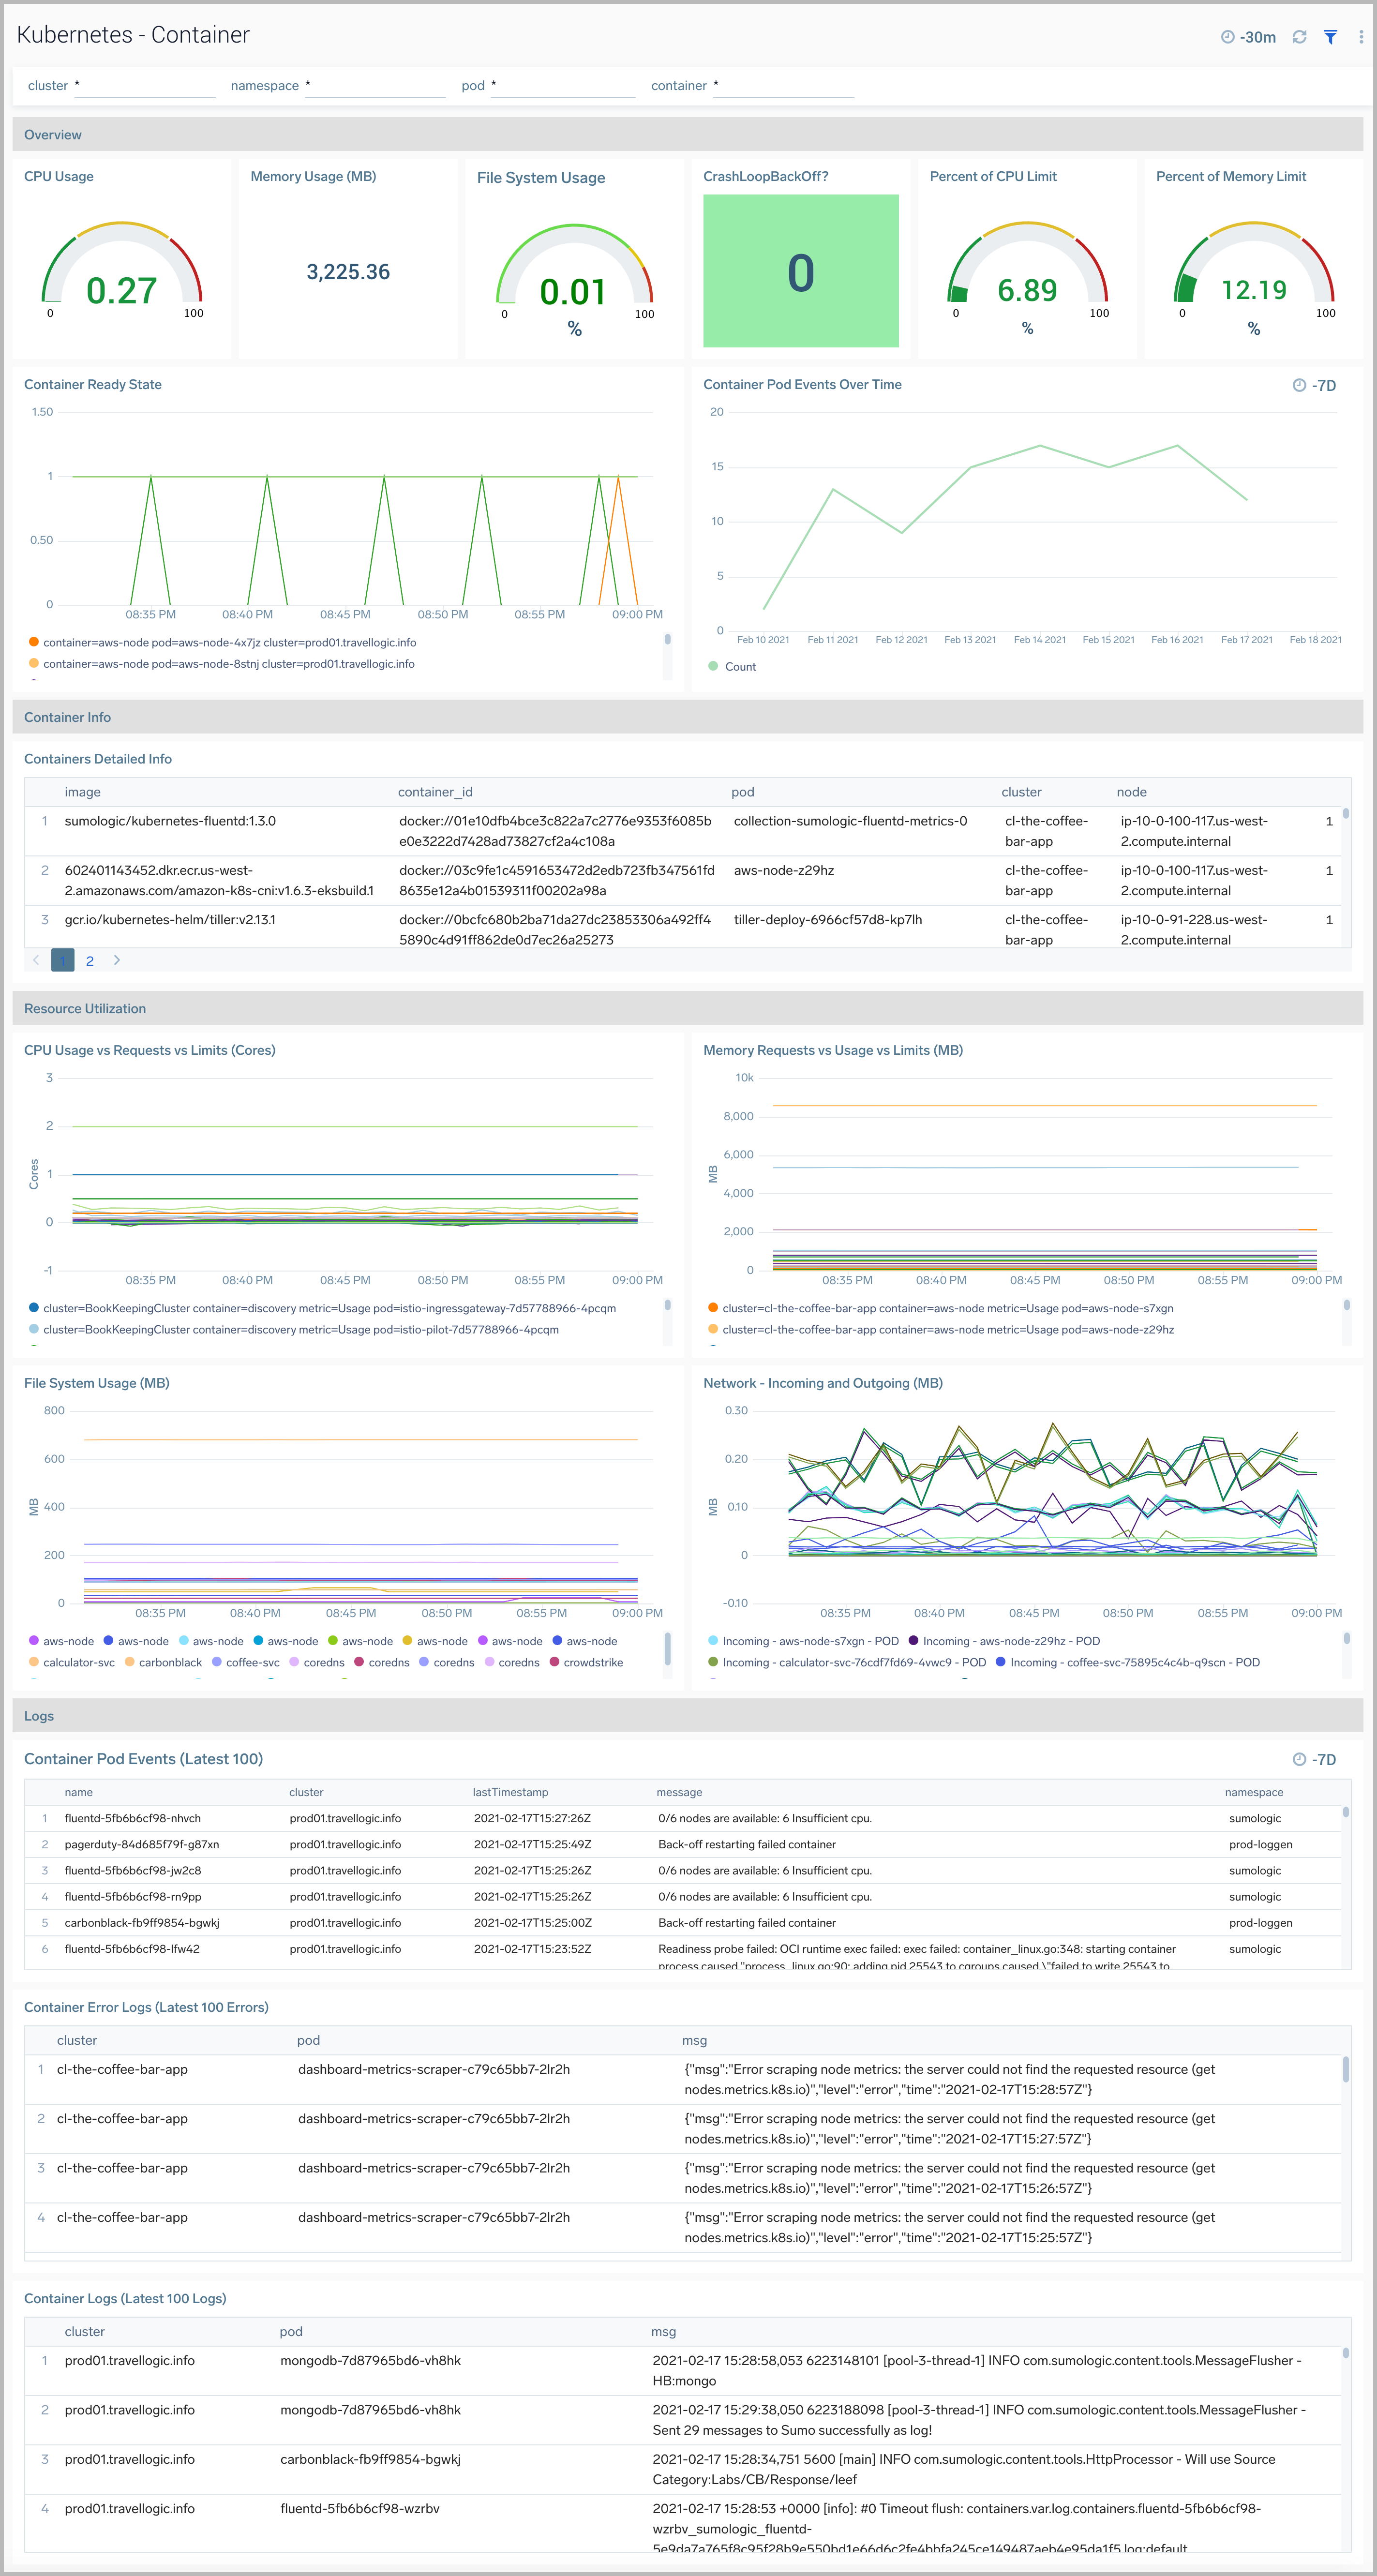
Container
The Kubernetes - Container dashboard provides insights into the health and resource utilization of a Kubernetes container.
Use this dashboard to:
- Monitor container health.
- Get insight into container resource utilization and fine-tune configurations accordingly.
- Determine if containers are stuck in CrashLoopBackOff, Terminated or Waiting states and make necessary adjustments.
- Investigate containers that are over-utilizing resources.
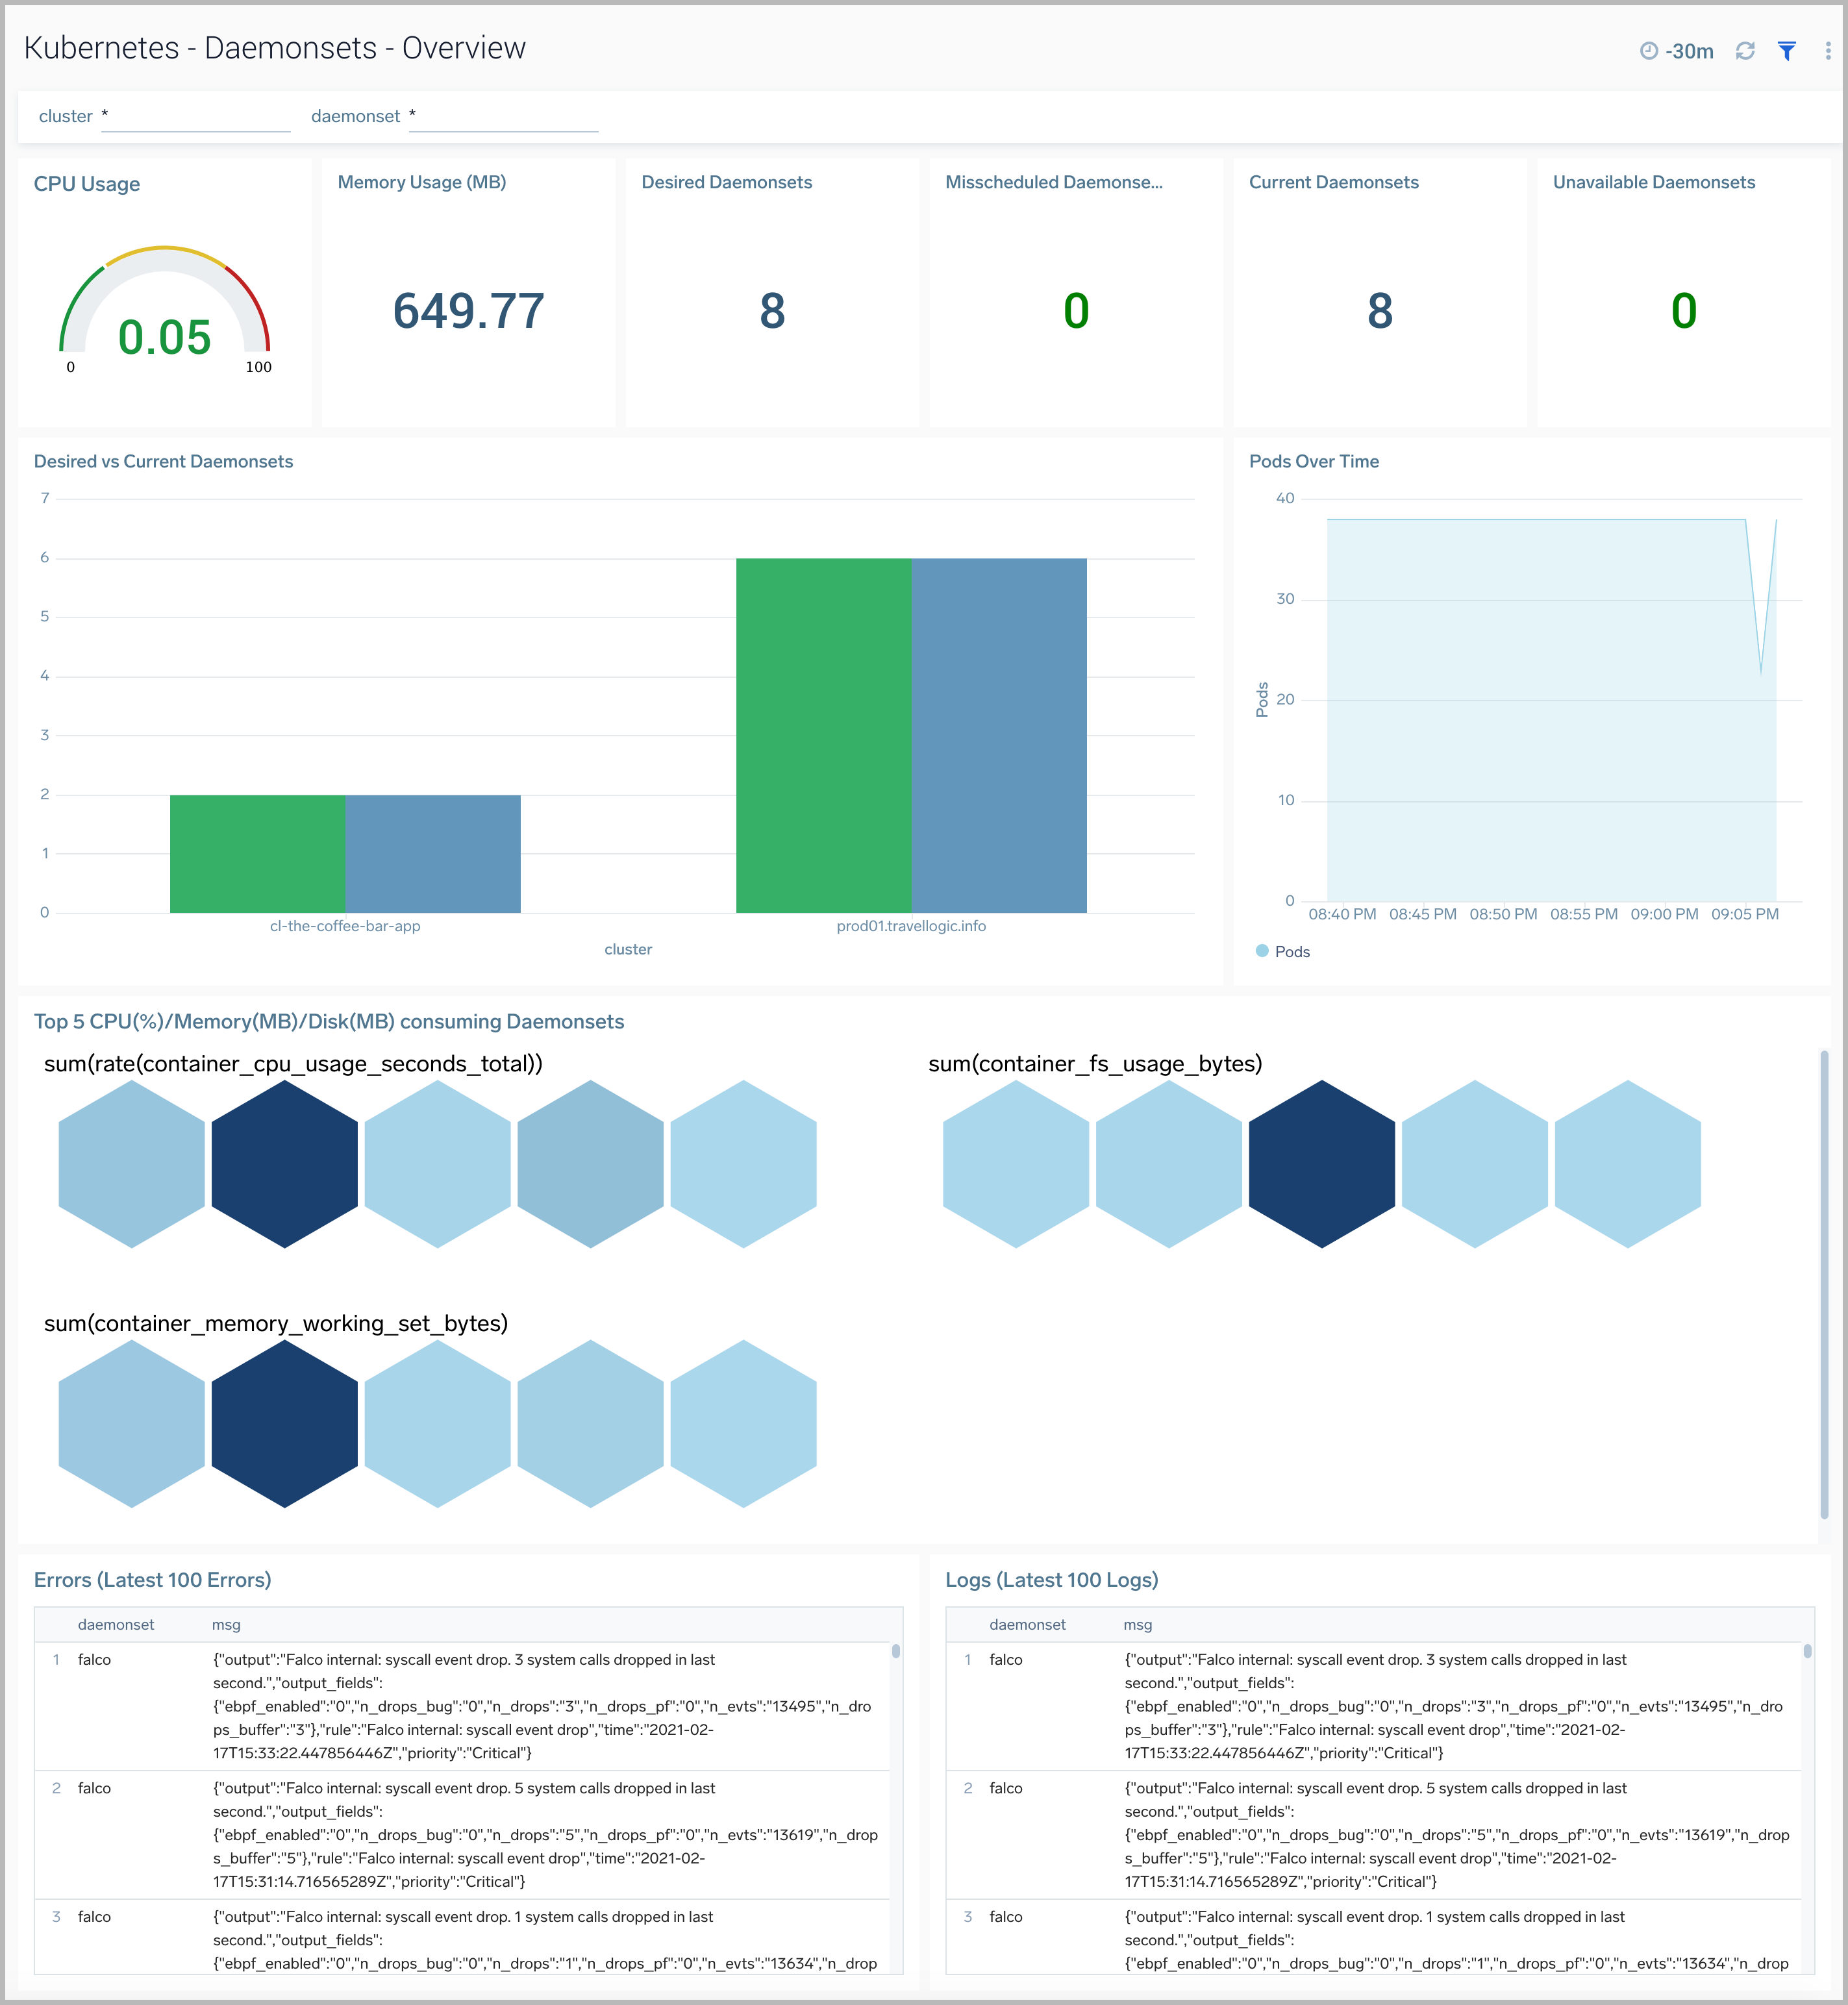
Daemonsets Overview
The Kubernetes - Daemonsets Overview dashboard provides insights into the health of and resource utilization of Kubernetes Daemonsets.
Use this dashboard to:
- Monitor the health of Daemonsets.
- Identify whether the required replica level is achieved or not.
- View logs and errors and investigate potential issues.
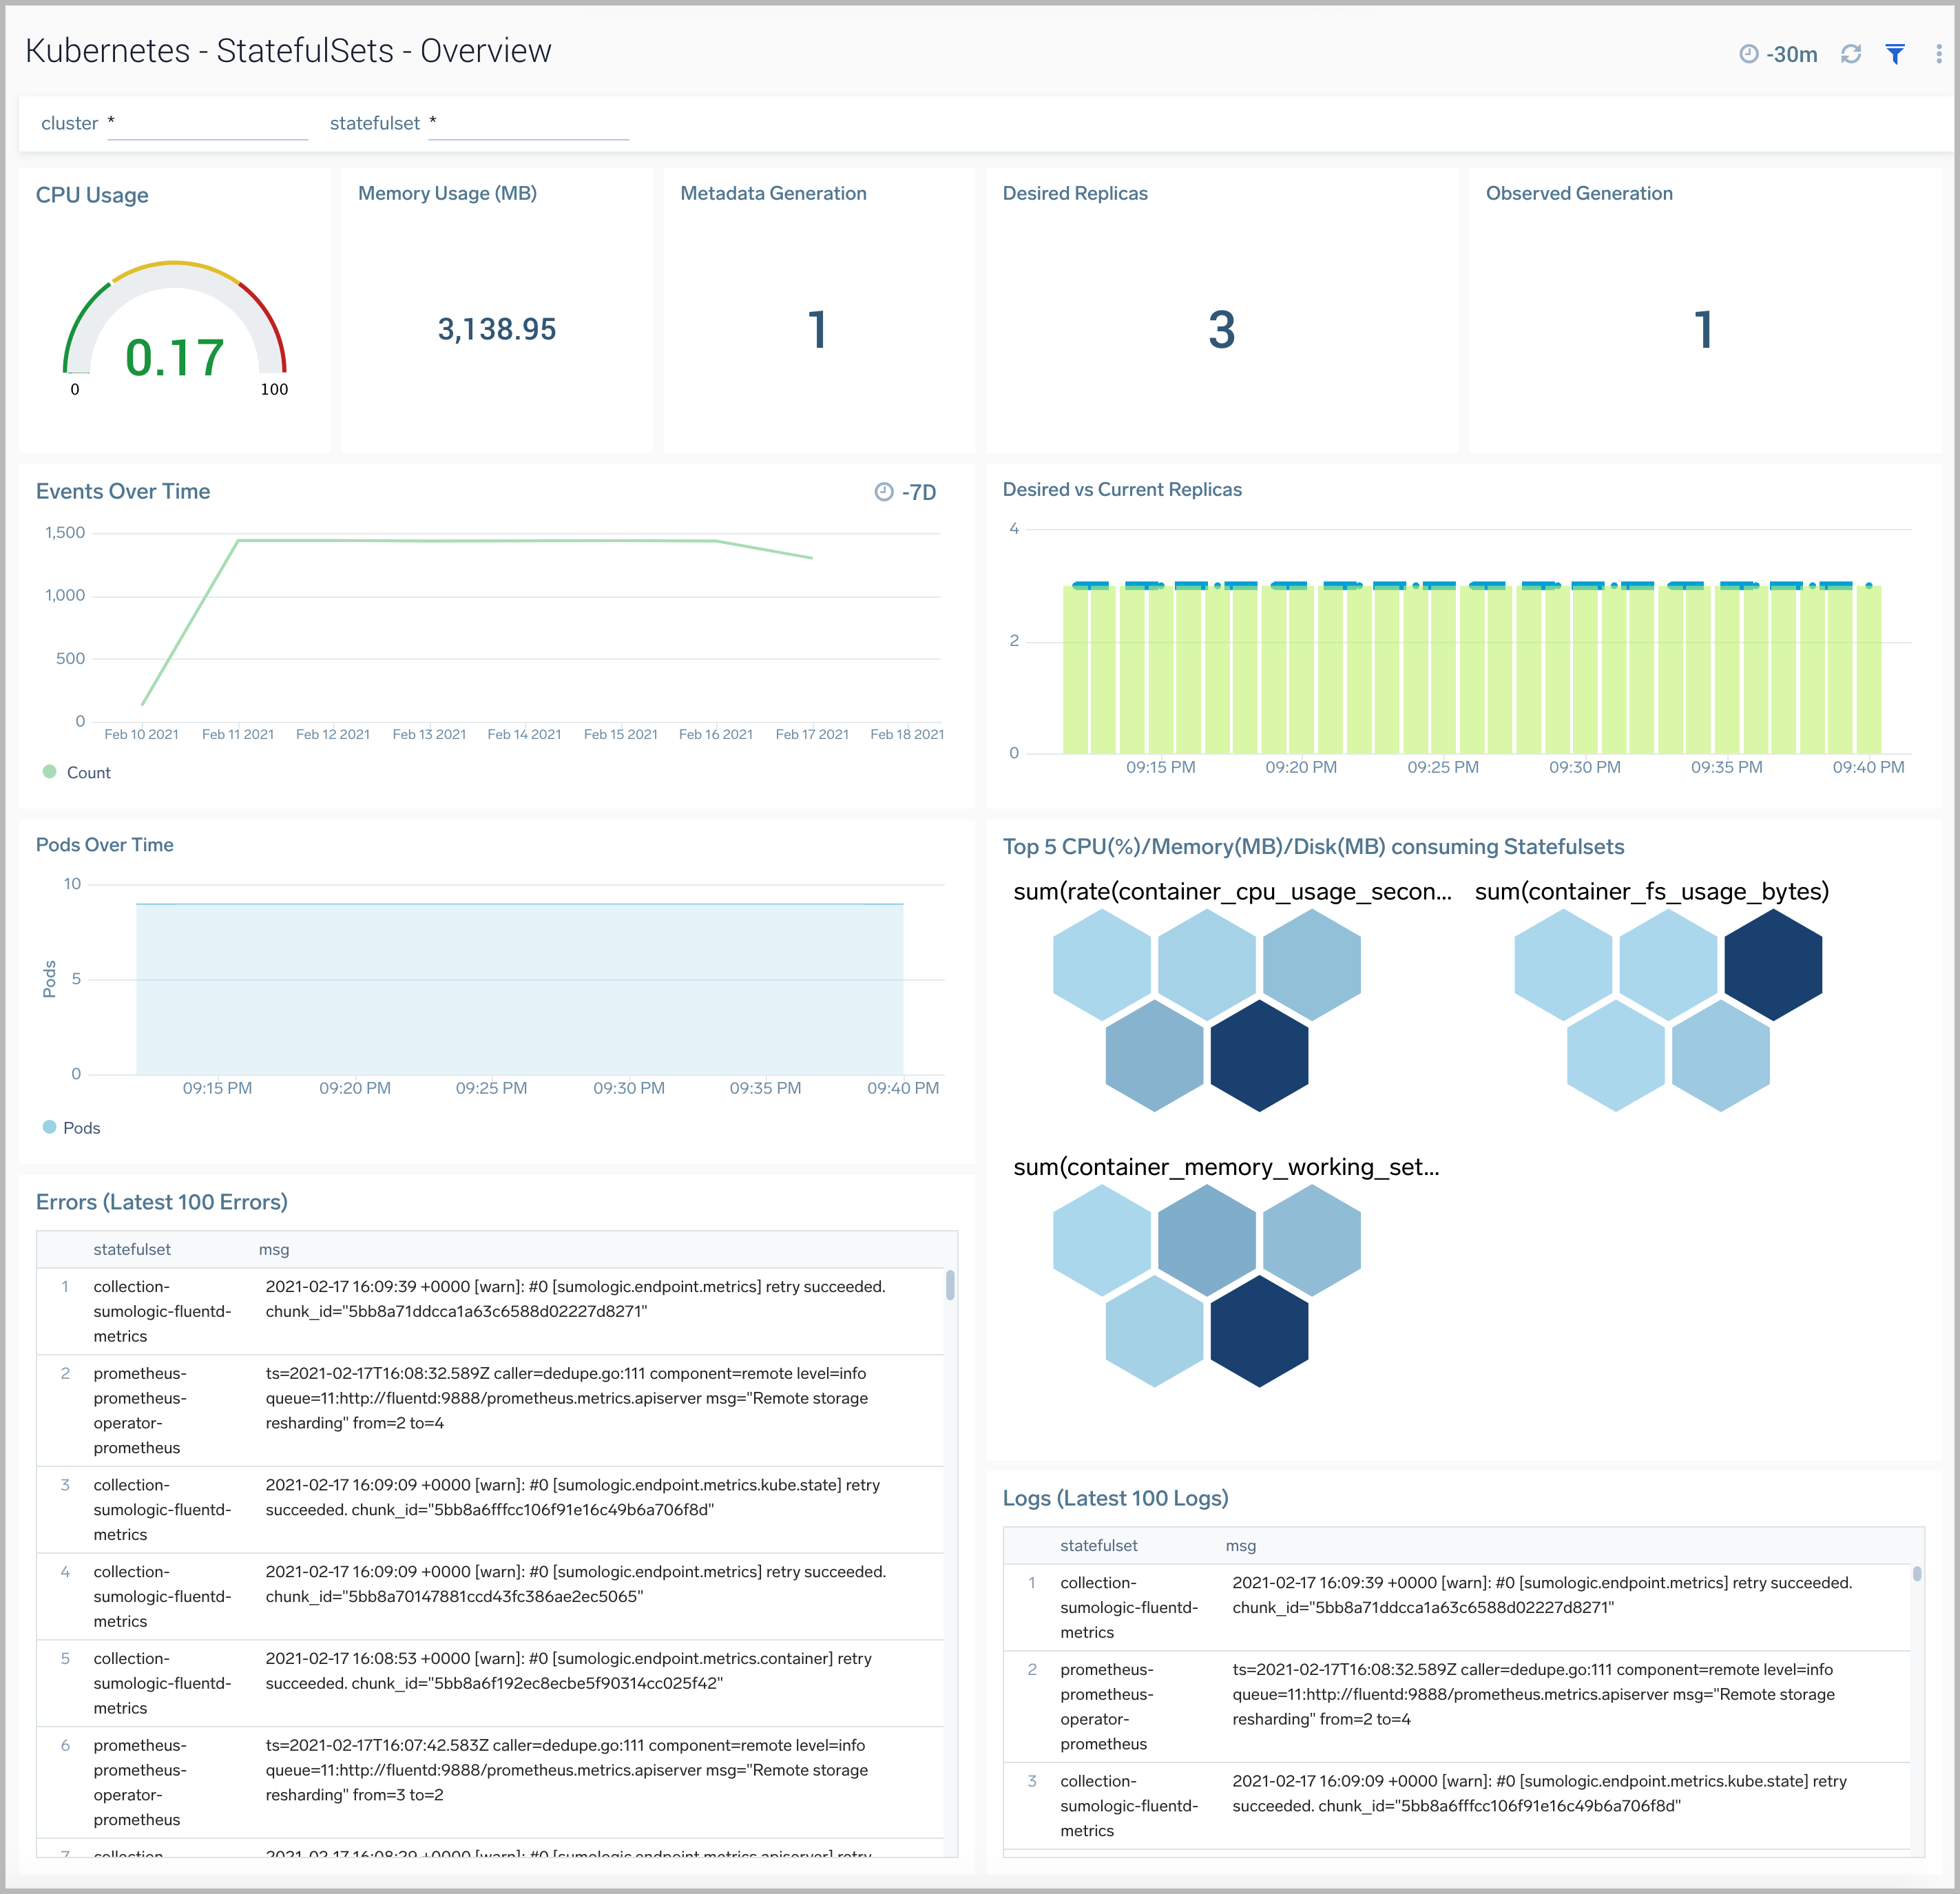
StatefulSets Overview
The Kubernetes - StatefulSets Overview dashboard provides insights into the health of and resource utilization of Kubernetes StatefulSets.
Use this dashboard to:
- Monitor the health of StatefulSets.
- Identify whether the required replica level is achieved or not.
- View logs and errors and investigate potential issues.
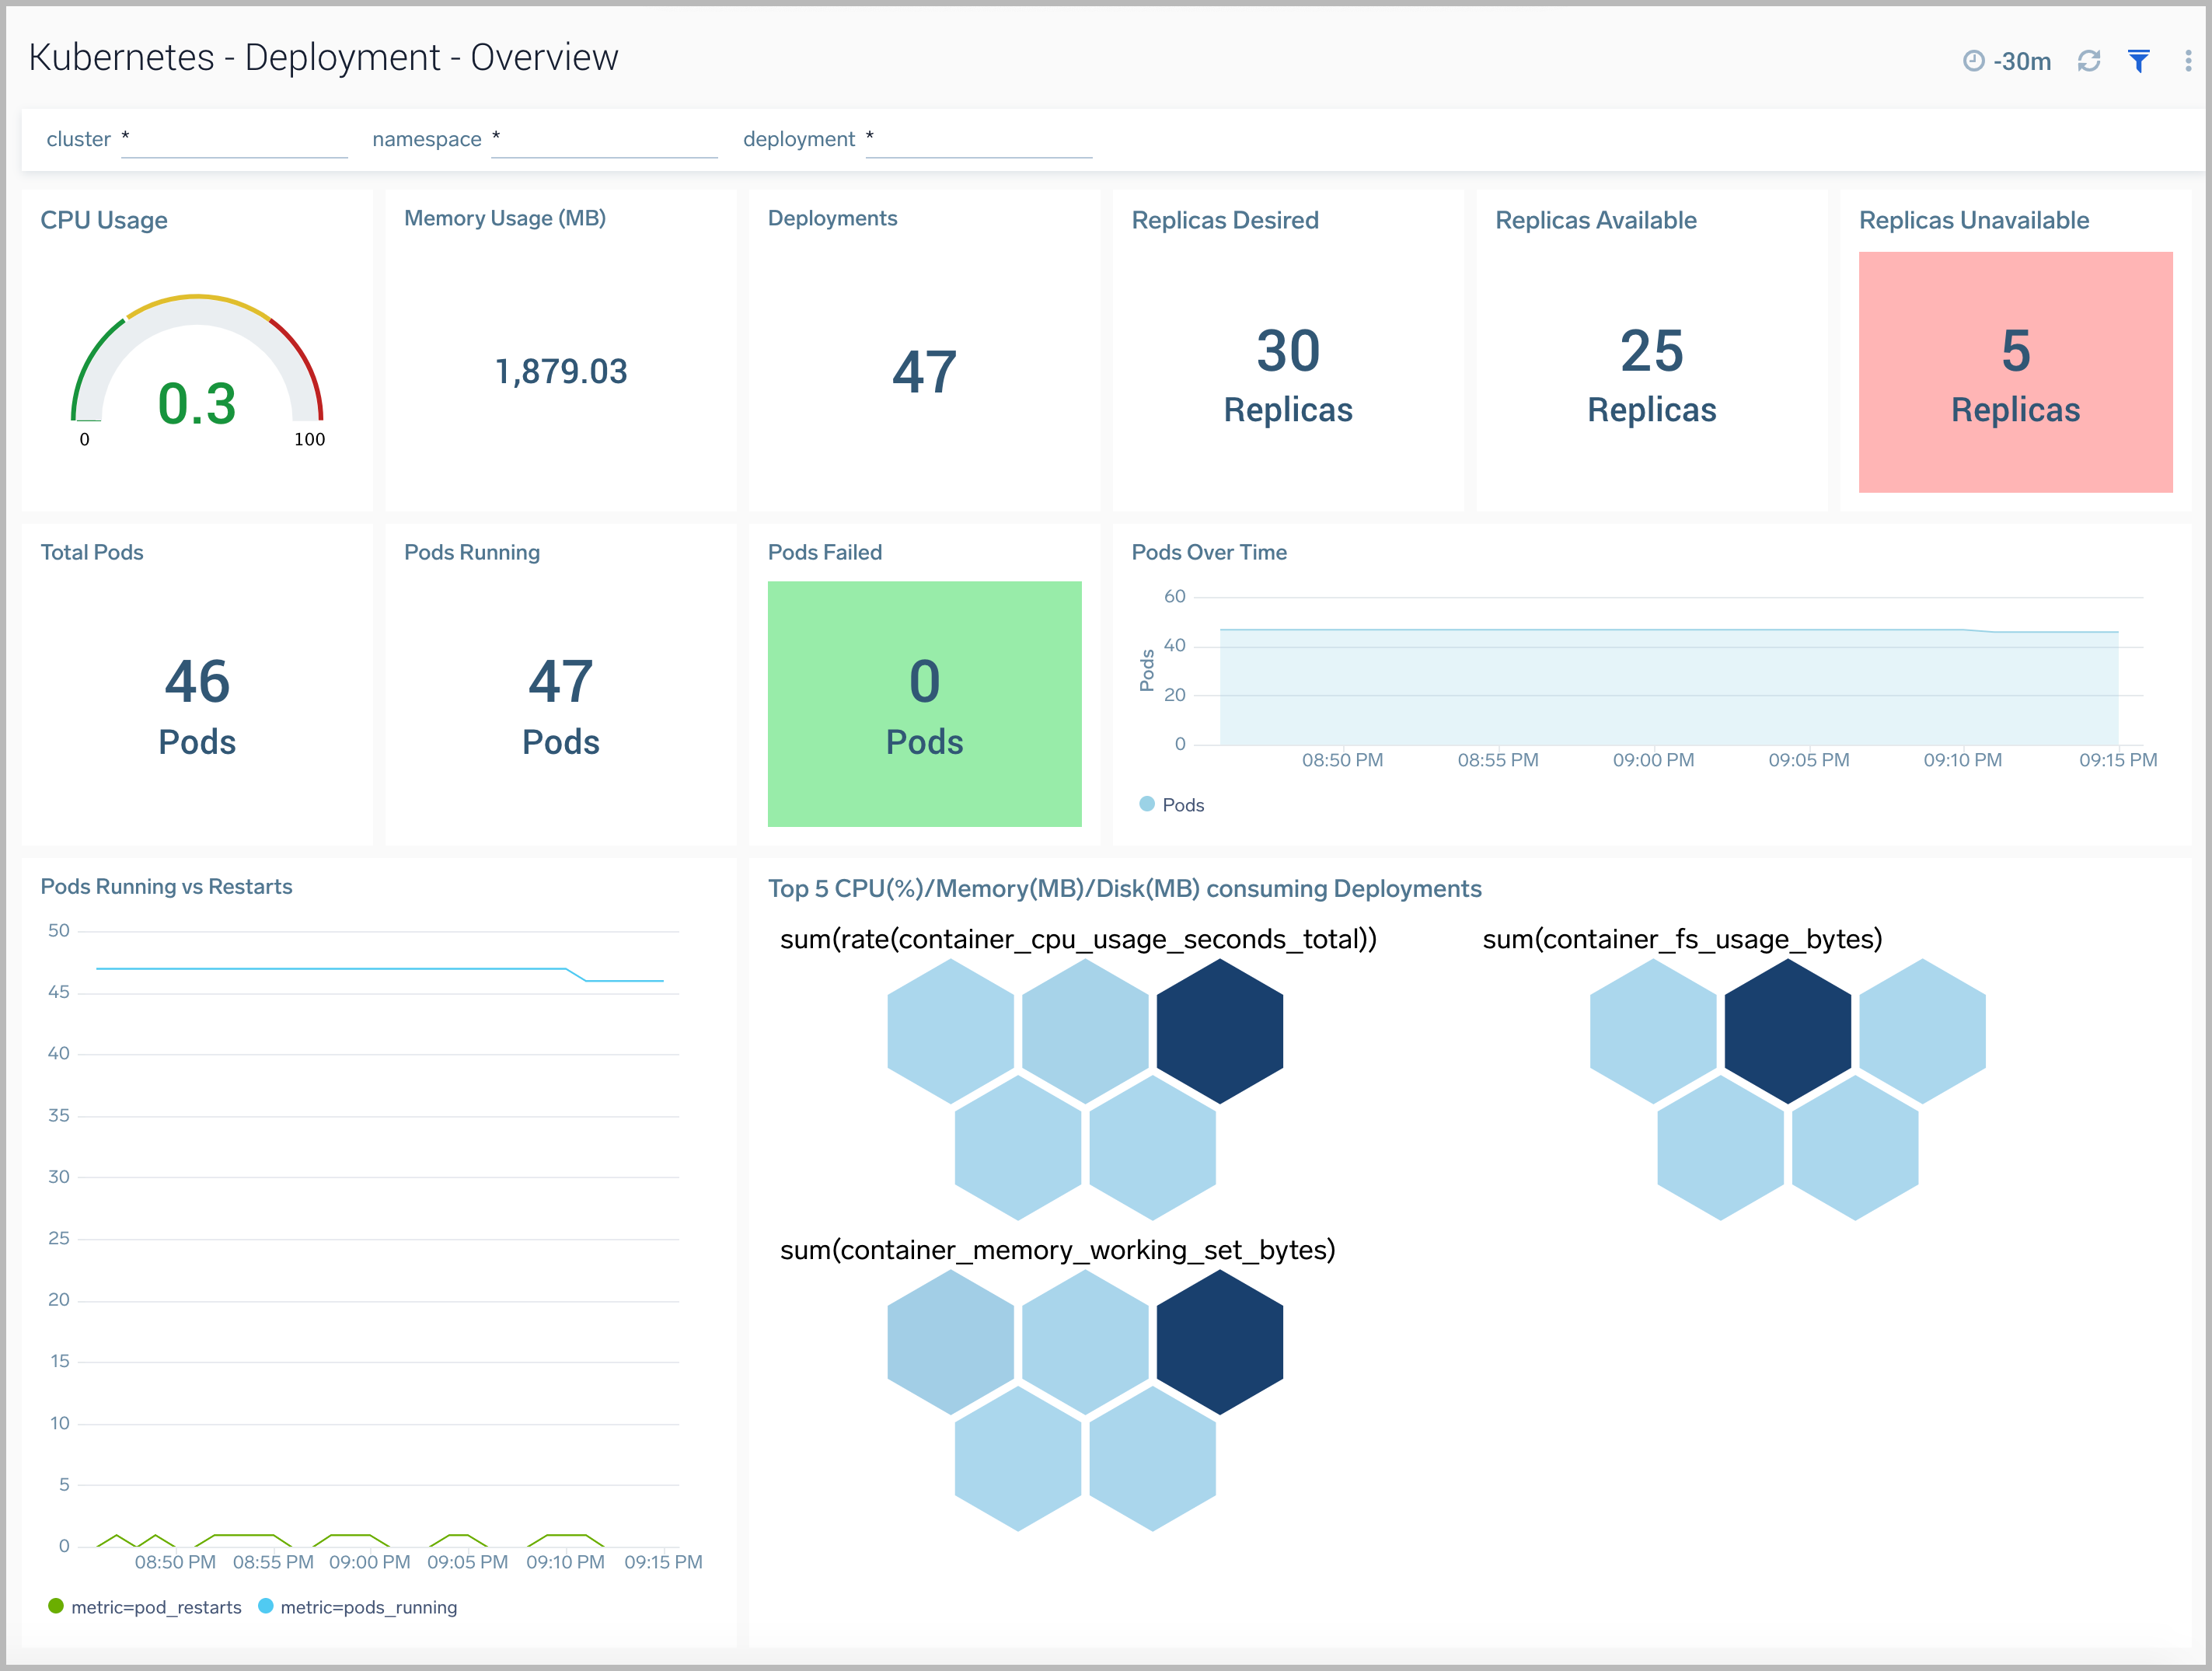
Deployment Overview
The Kubernetes - Deployment Overview dashboard provides insights into the health and performance of your Kubernetes deployments.
Use this dashboard to:
- Monitor the health of deployments in your Kubernetes environment.
- Identify whether the required replica level has been achieved or not.
- View logs and errors and investigate potential issues.
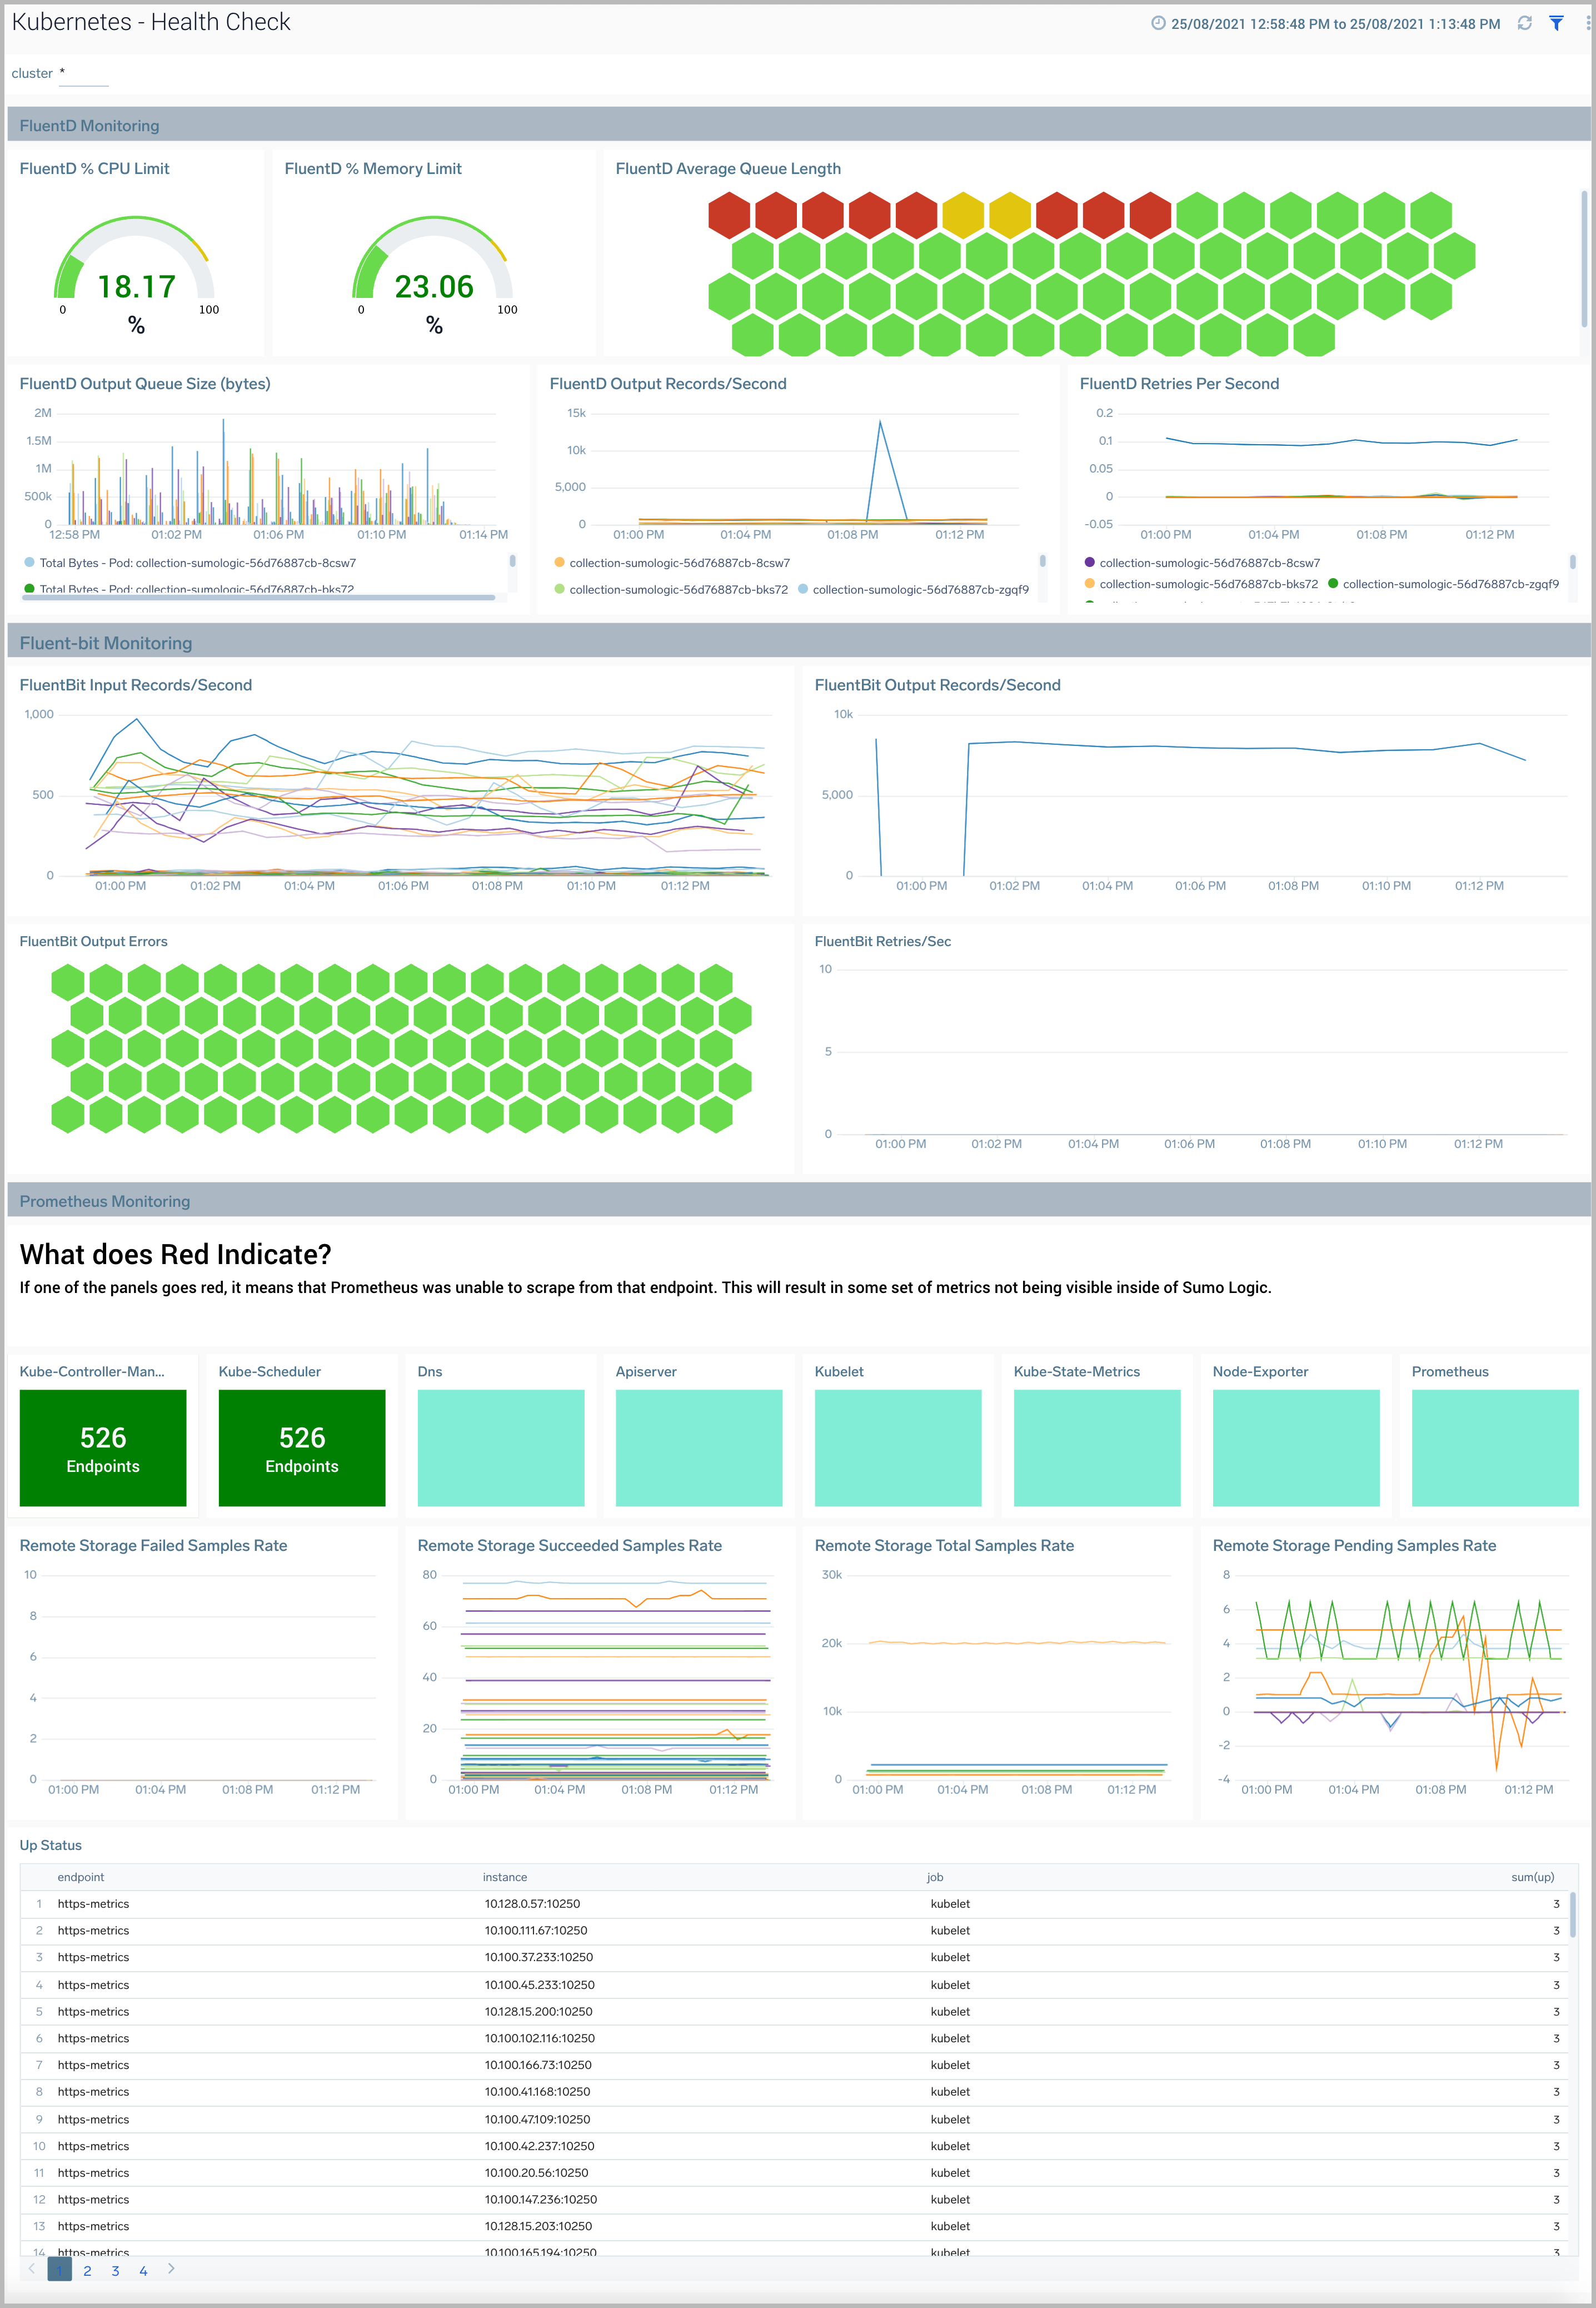
Health Check
The Kubernetes - Health Check dashboard displays the collection status from all the components in the Kubernetes cluster.
Use this dashboard to:
- Monitor the health of FluentD and FluentBit pods in your Kubernetes environmentnote
Currently, in default configurations, Sumo Logic Distribution for OpenTelemetry Collector is used instead of FluentD and Fluent Bit.
- Gain insights into Prometheus metric collection endpoint status.
- Get insight into resource utilization and fine-tune configurations accordingly.
- View logs and errors and investigate potential issues.
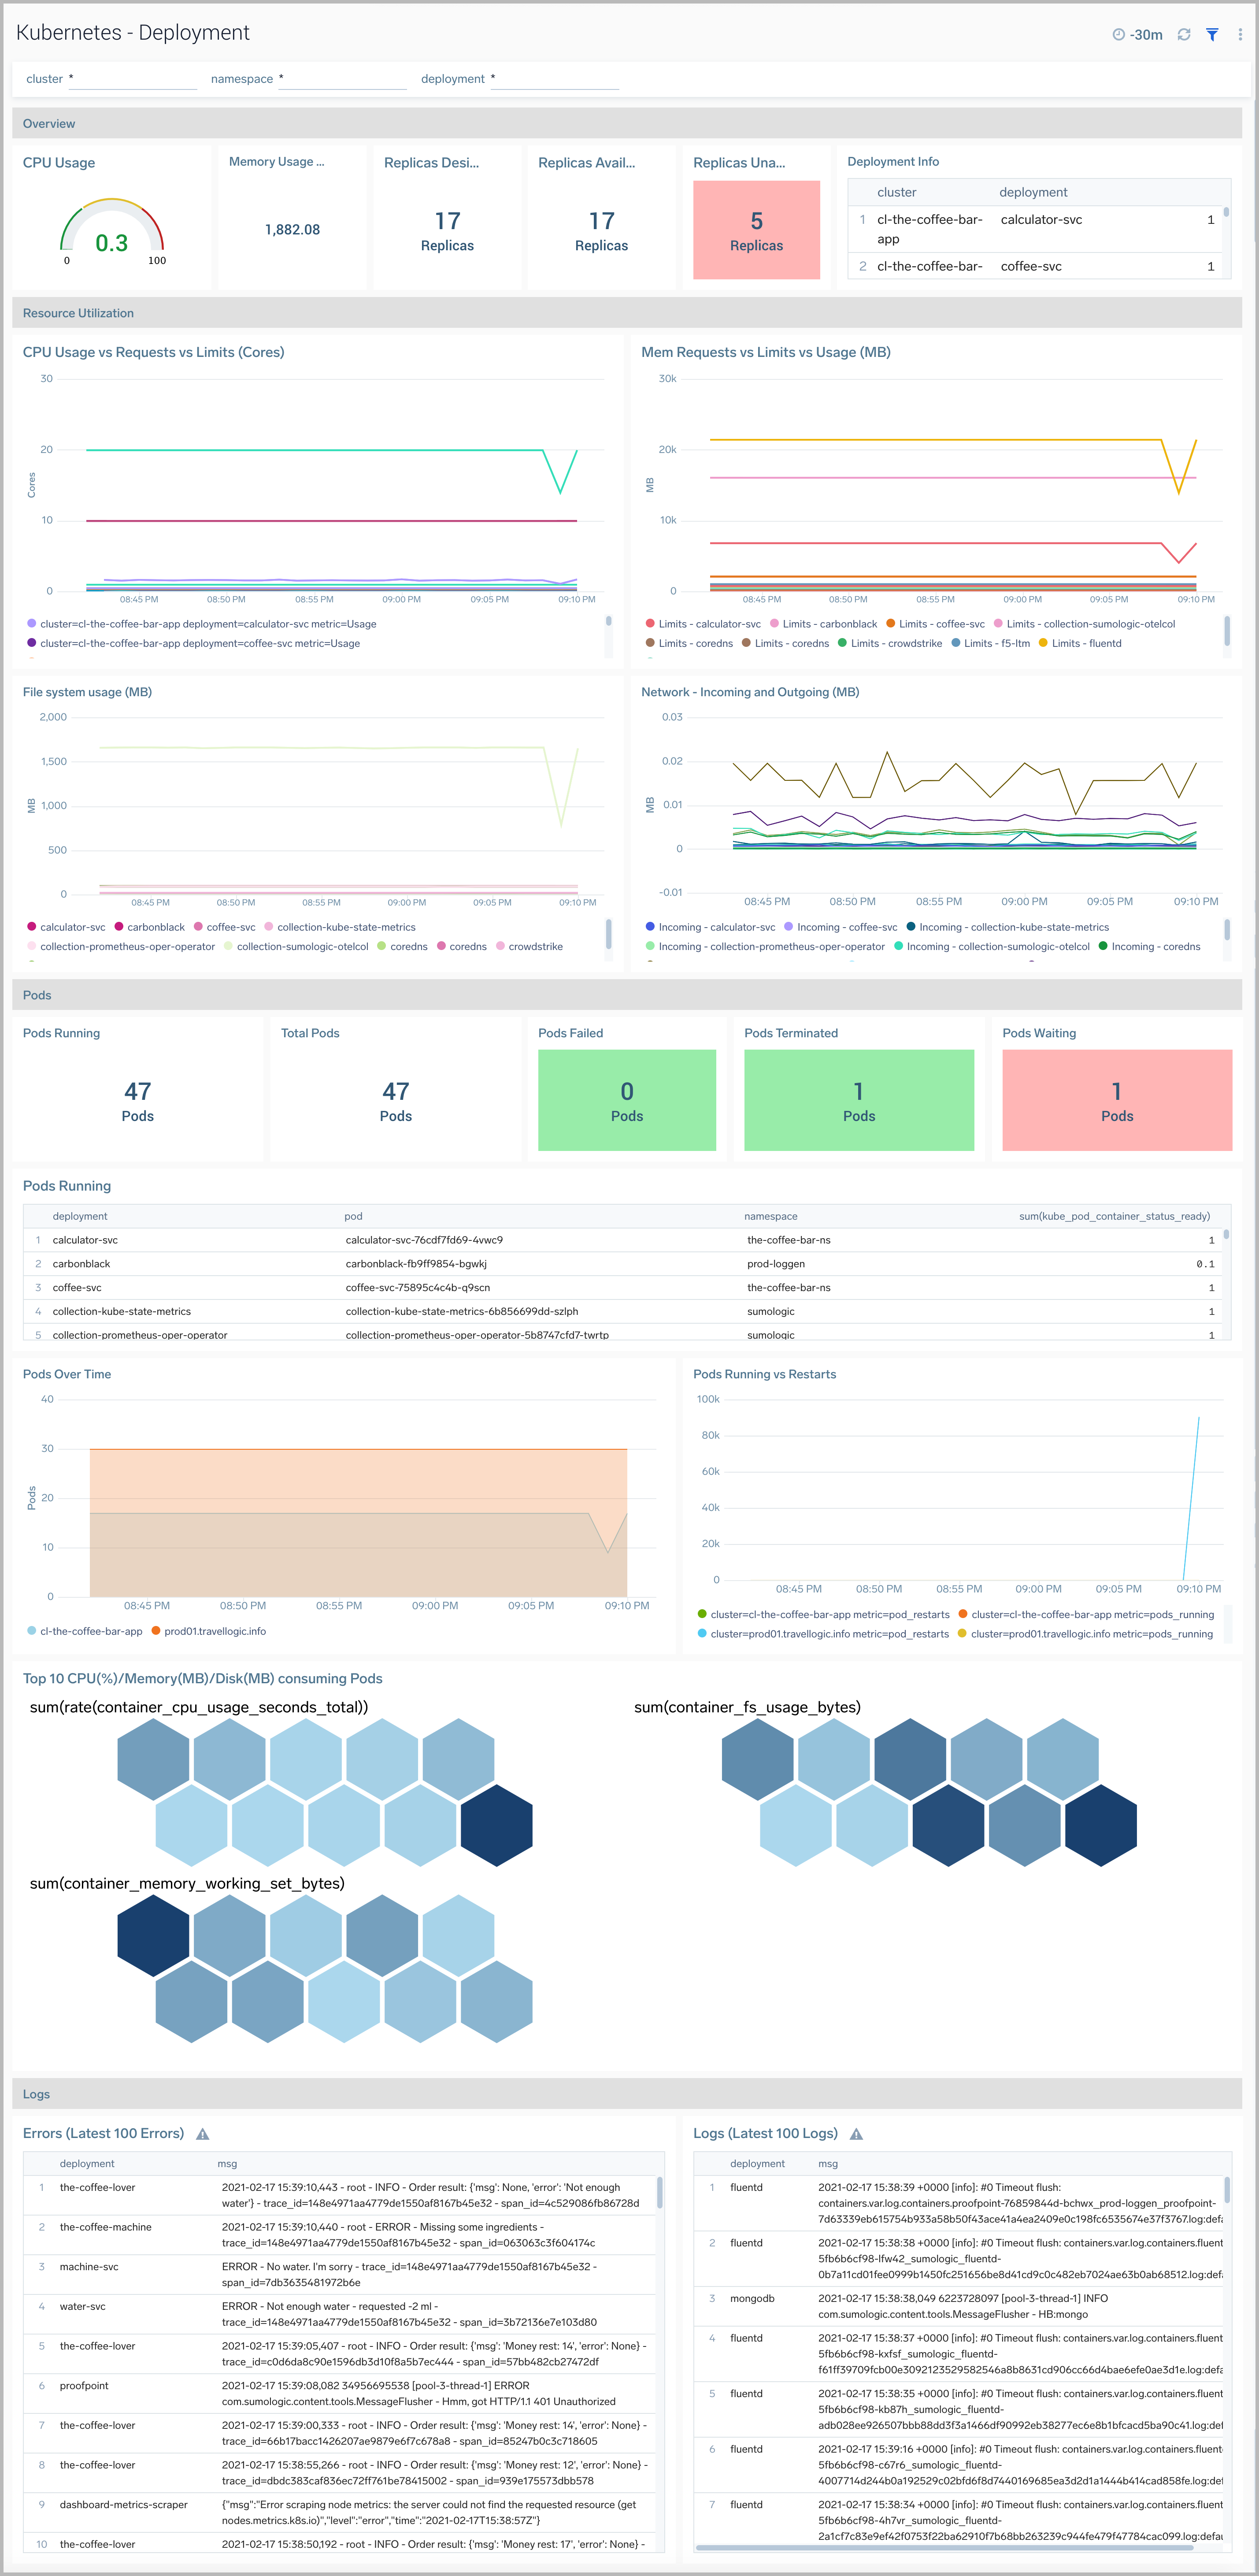
Deployment
The Kubernetes - Deployment dashboard provides insights into the health and performance of your Kubernetes deployments.
Use this dashboard to:
- Monitor the health of deployments in your Kubernetes environment.
- Identify whether the required replica level has been achieved or not.
- View logs and errors and investigate potential issues.
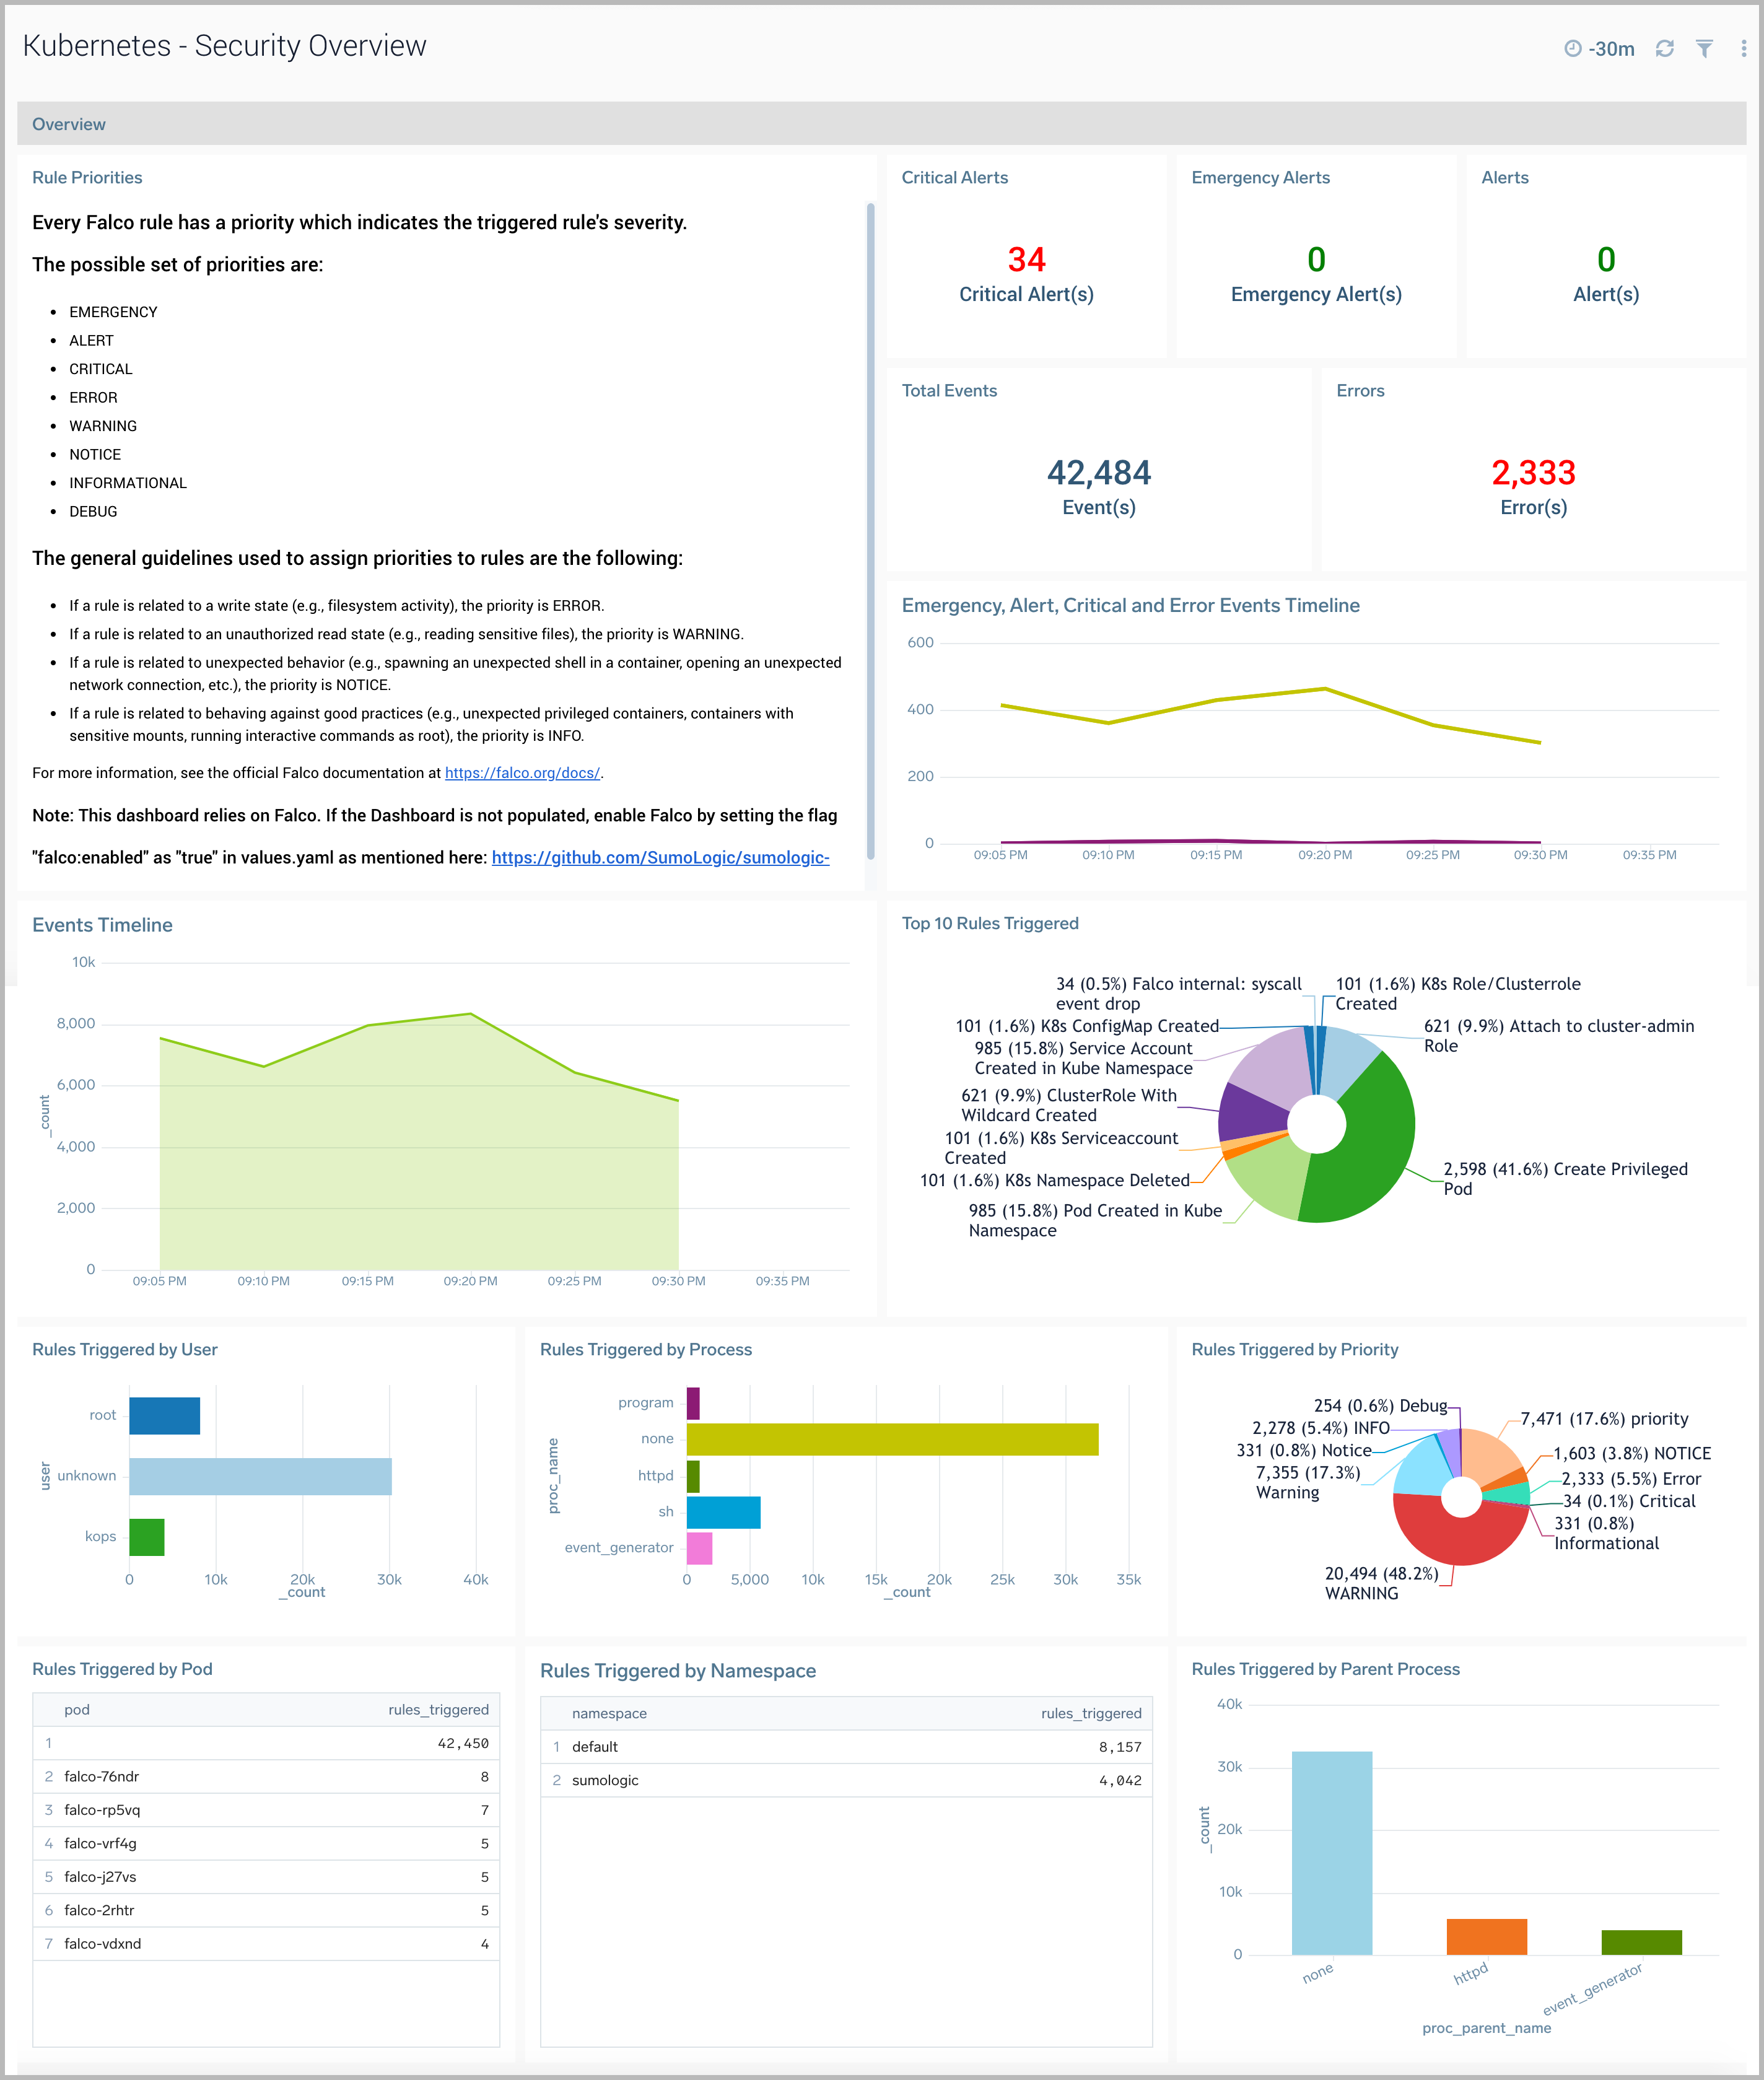
Security Overview
This dashboard relies on Falco. If the Dashboard is not populated, enable Falco by setting the flag falco:enabled as "true" in values.yaml, as described here.
This dashboard provides high level details around anomalous container, application, host, and network activity detected by Falco.
Use this dashboard to:
- Identify and investigate anomalous activity.
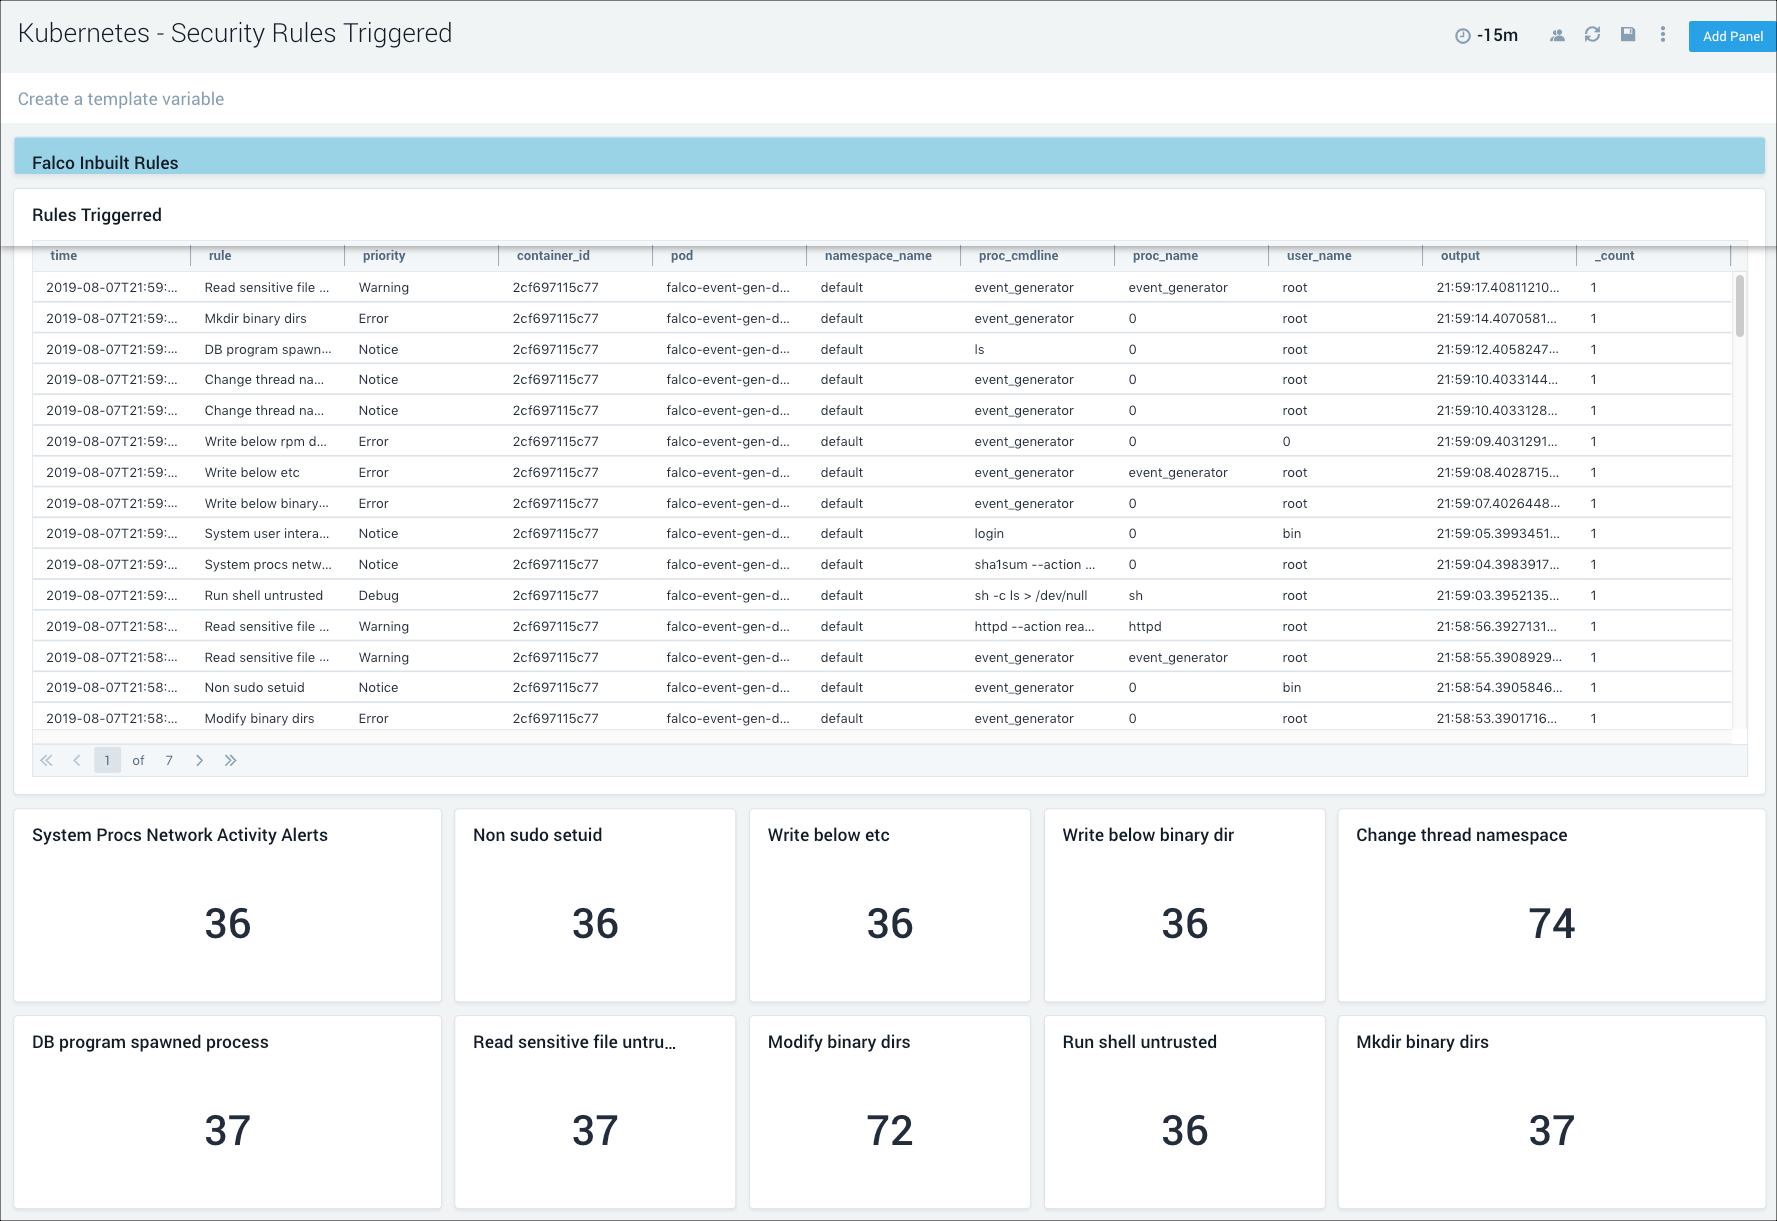
Security Rules Triggered
This dashboard relies on Falco. If the Dashboard is not populated, enable Falco by setting the flag falco.enabled as "true" in values.yaml. For details, please see the Sumo Logic Kubernetes Collection Helm Chart documentation.
The Kubernetes - Security Rules Triggered dashboard provides detailed information around anomalous activity detected by Falco. It also shows information around the OOB Falco rules triggered by anomalous activity in your Kubernetes environments.
Use this dashboard to:
- Reviewed detailed information of anomalous activity.
- Review if the OB Falco security events are triggered and identify the root cause.
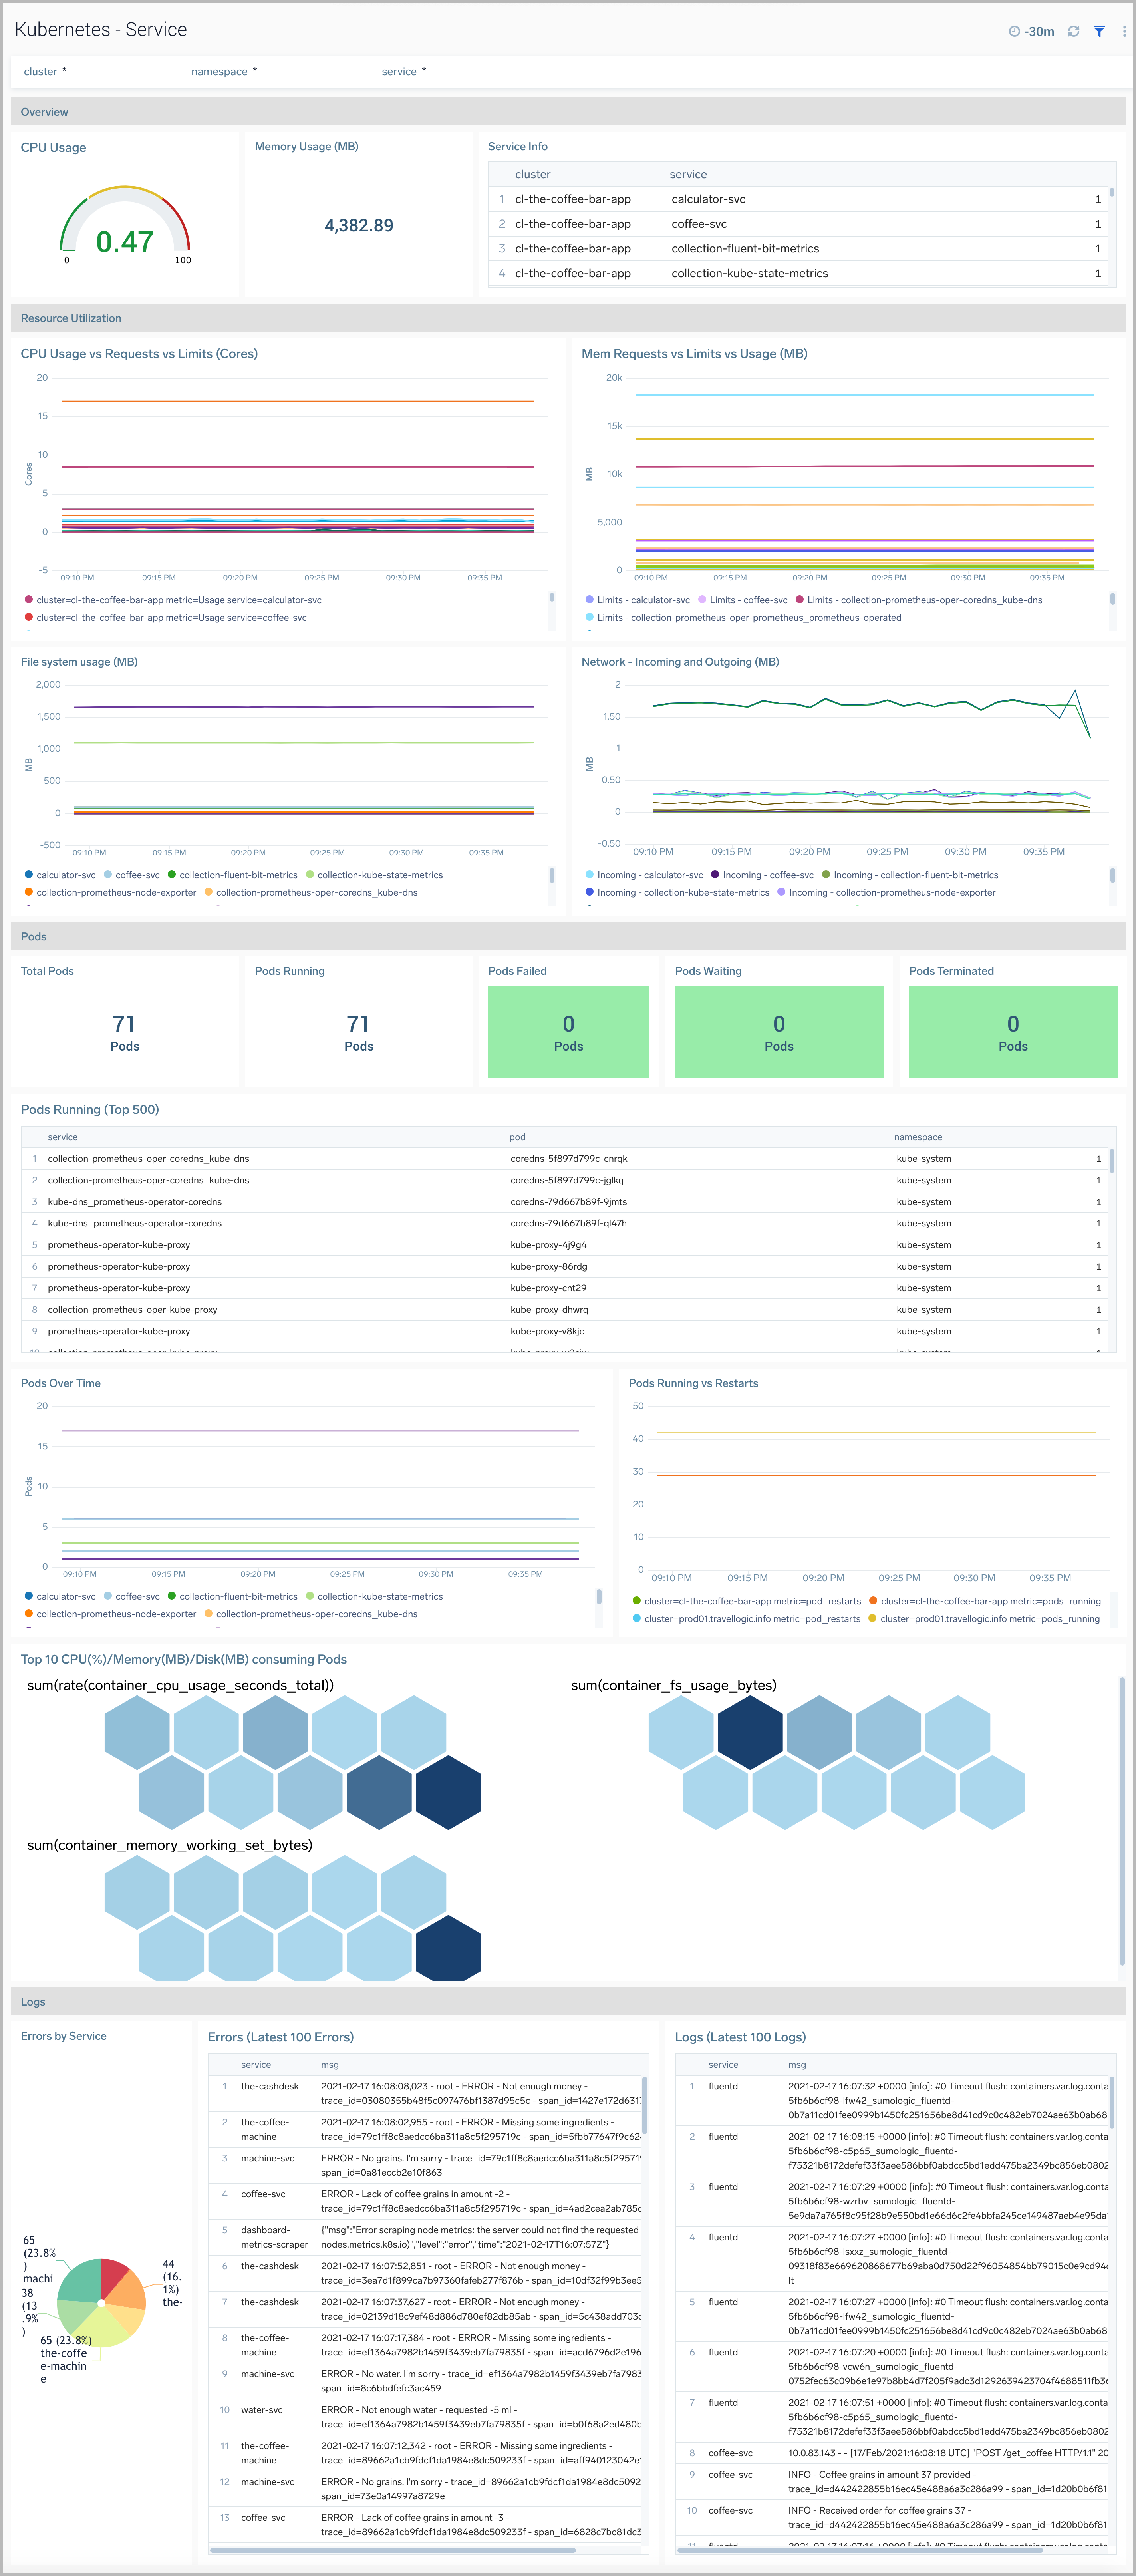
Service
The Kubernetes - Service dashboard provides a high-level view of the health of the cluster services, along with details on utilized resources by service.
Use this dashboard to:
- Reviewed detailed information of services.
- Identify components by Services.
- Determine any errors and warnings by Services.
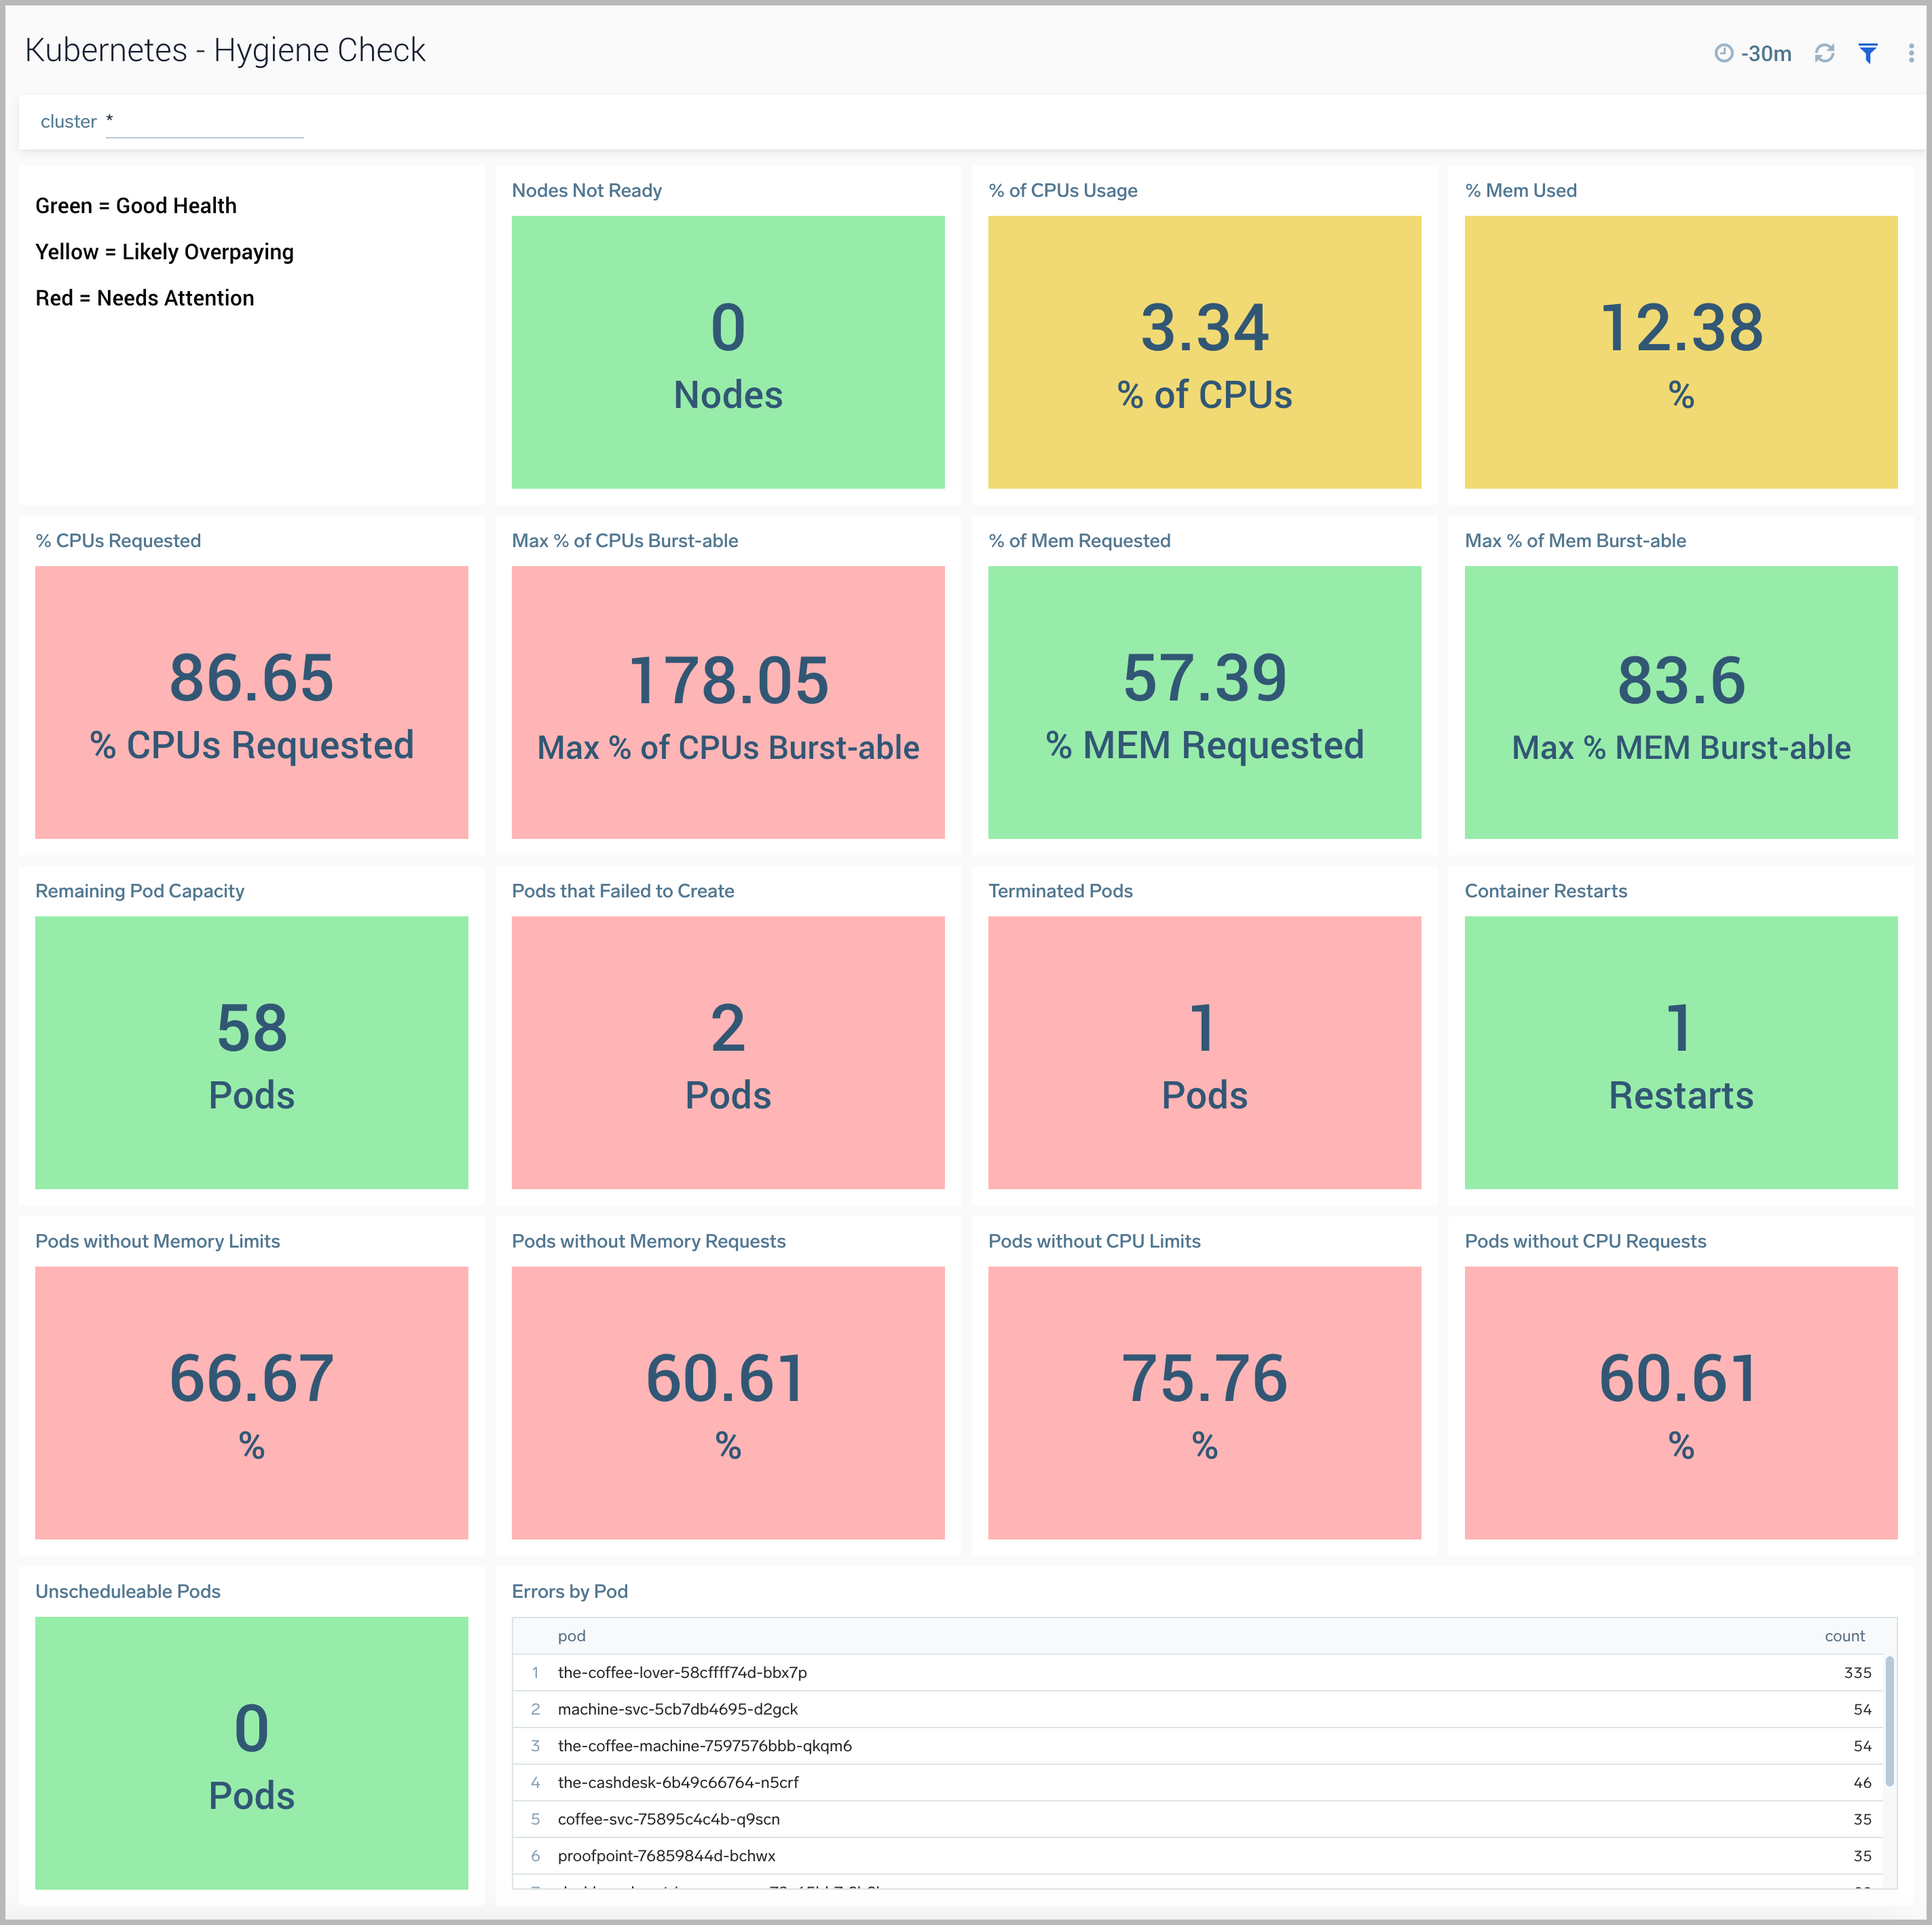
Hygiene Check
The Kubernetes - Hygiene Check dashboard provides visibility into the configuration hygiene of your Kubernetes cluster. This dashboard displays color-coded performance checks for nodes, along with resource utilization, pod capacity, pod errors, and pod states.
Use this dashboard to:
- Assess bad configurations and determine the trouble areas for proactive adjustment.
- Monitor resource allocation across your cluster to maintain optimum performance.
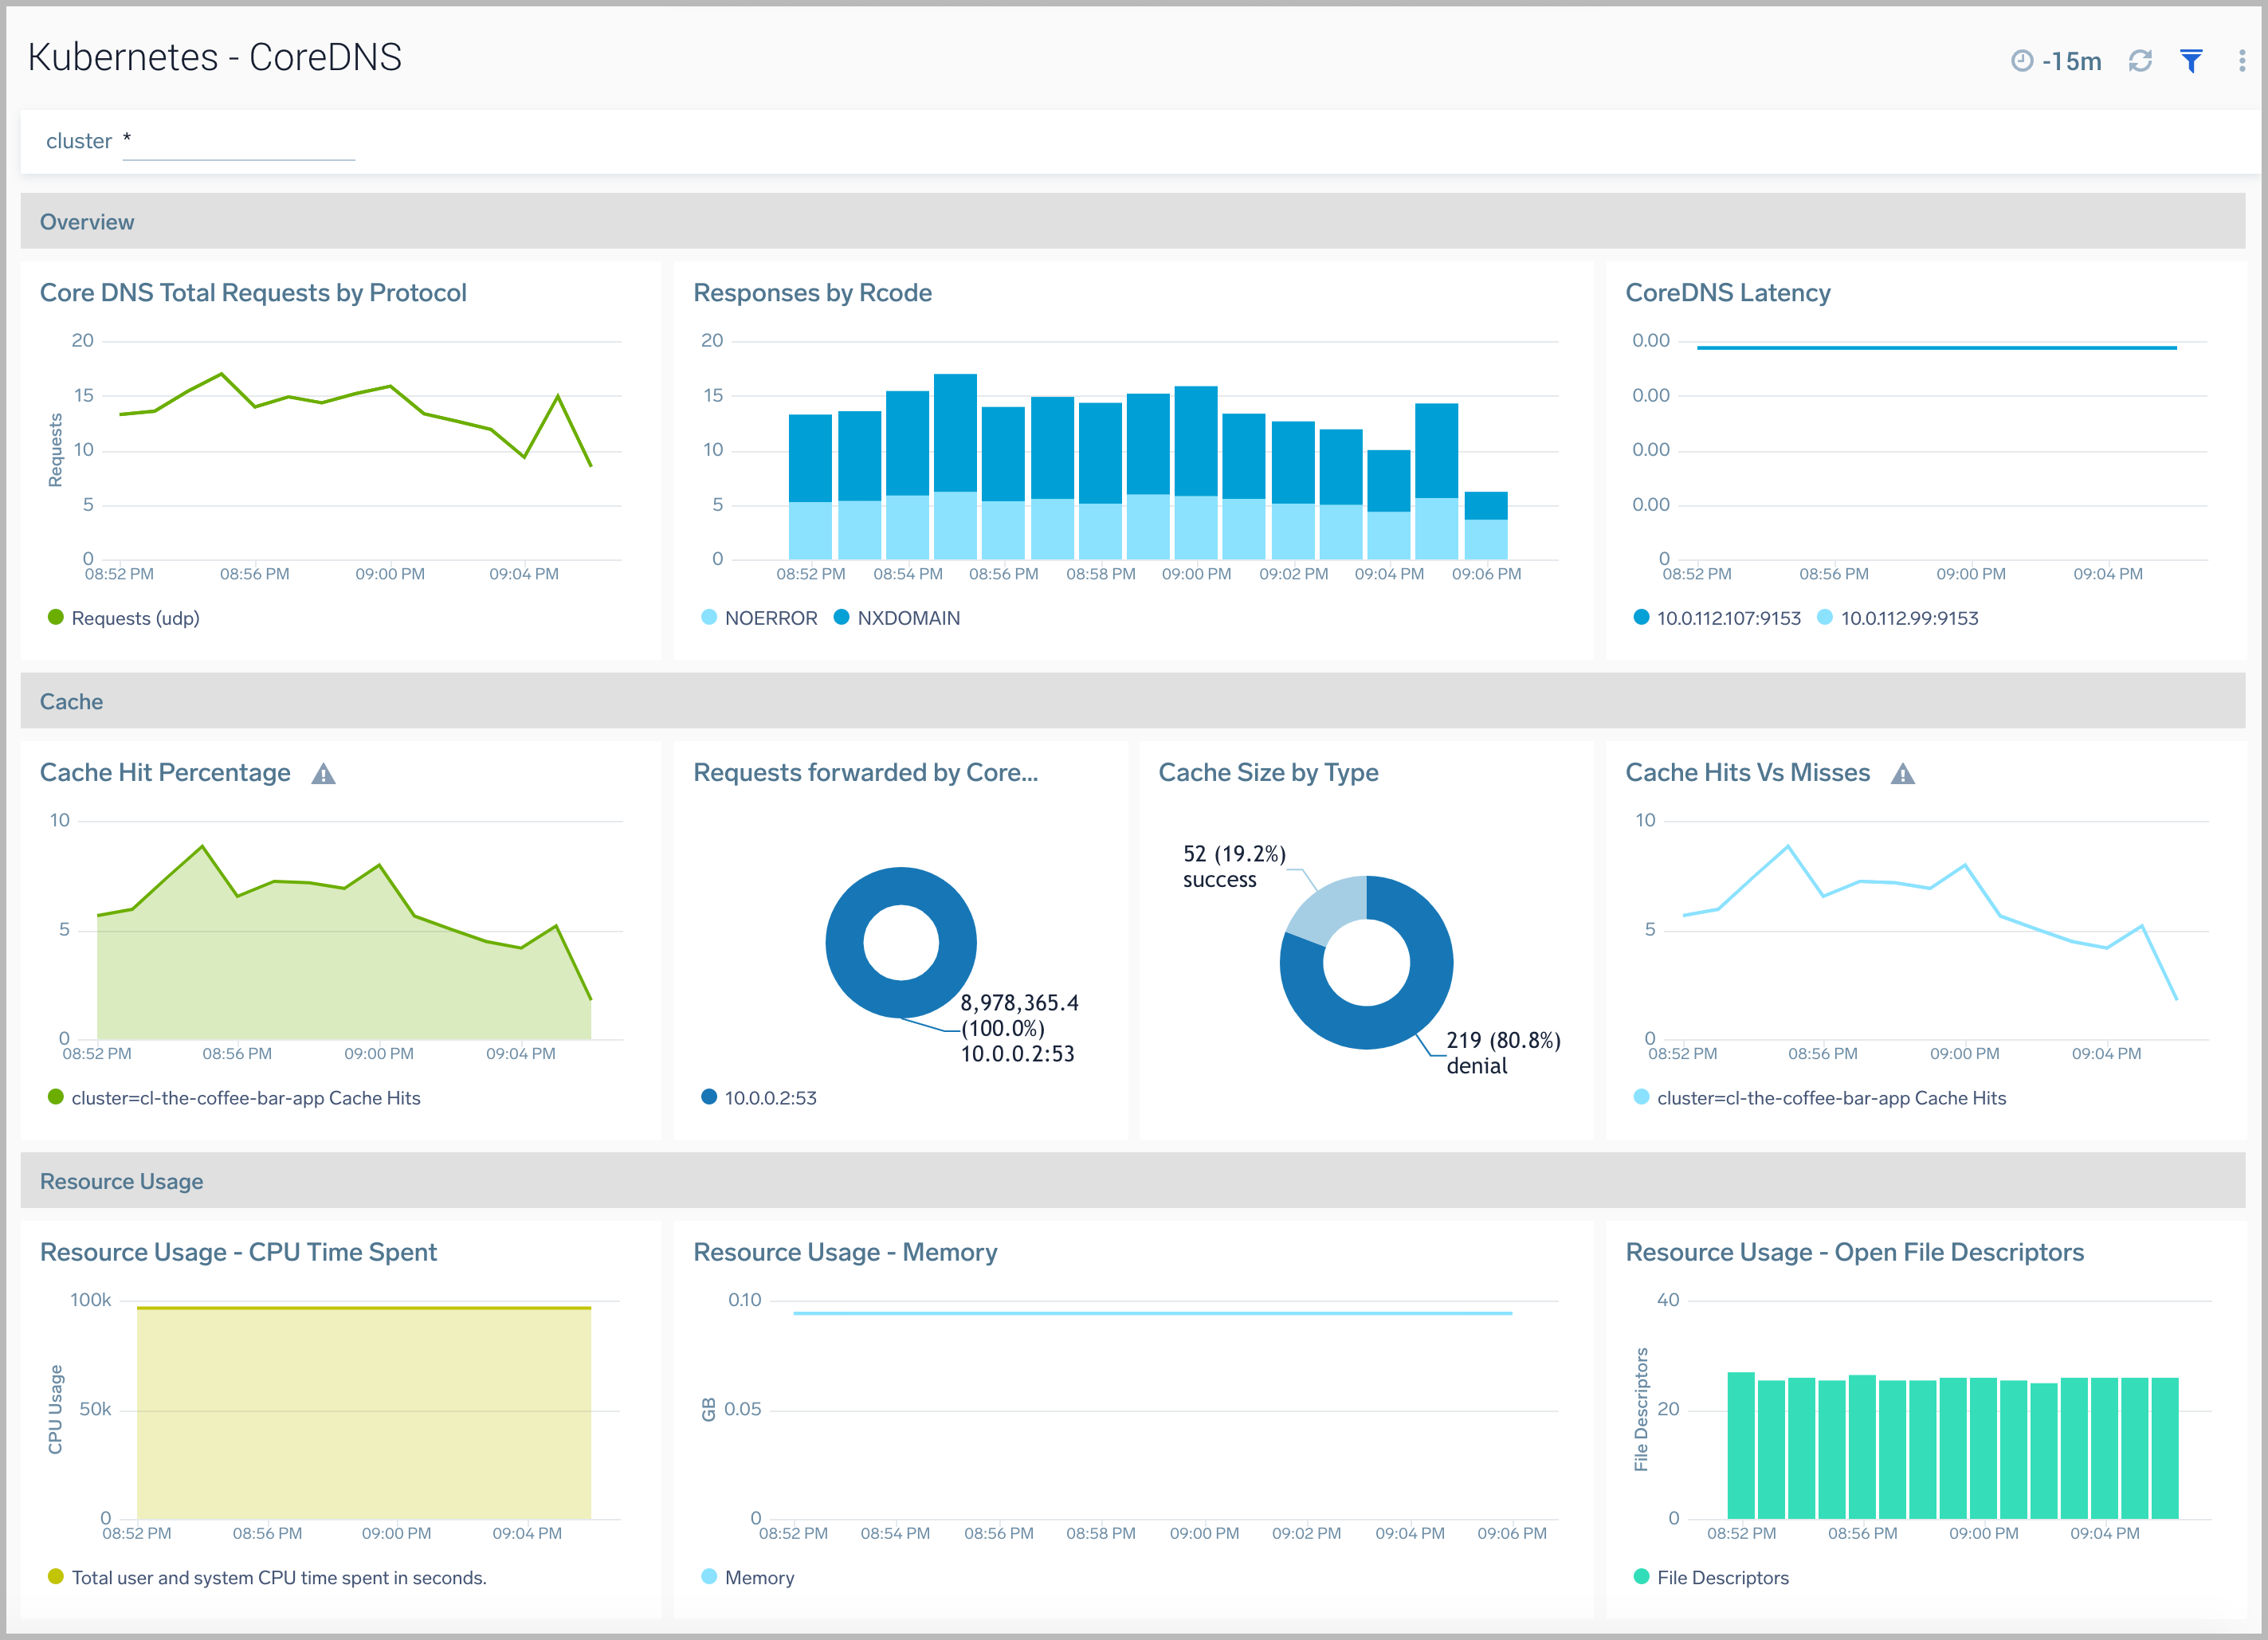
CoreDNS
CoreDNS is a DNS server and can be used as a replacement for kube-dns in a kubernetes cluster.
The Kubernetes - CoreDNS dashboard provides visibility into the health and performance of CoreDNS.
Use this dashboard to:
- Track the total number of requests.
- Review Cache statistics.
- Monitor CoreDNSs resource usage and spikes.
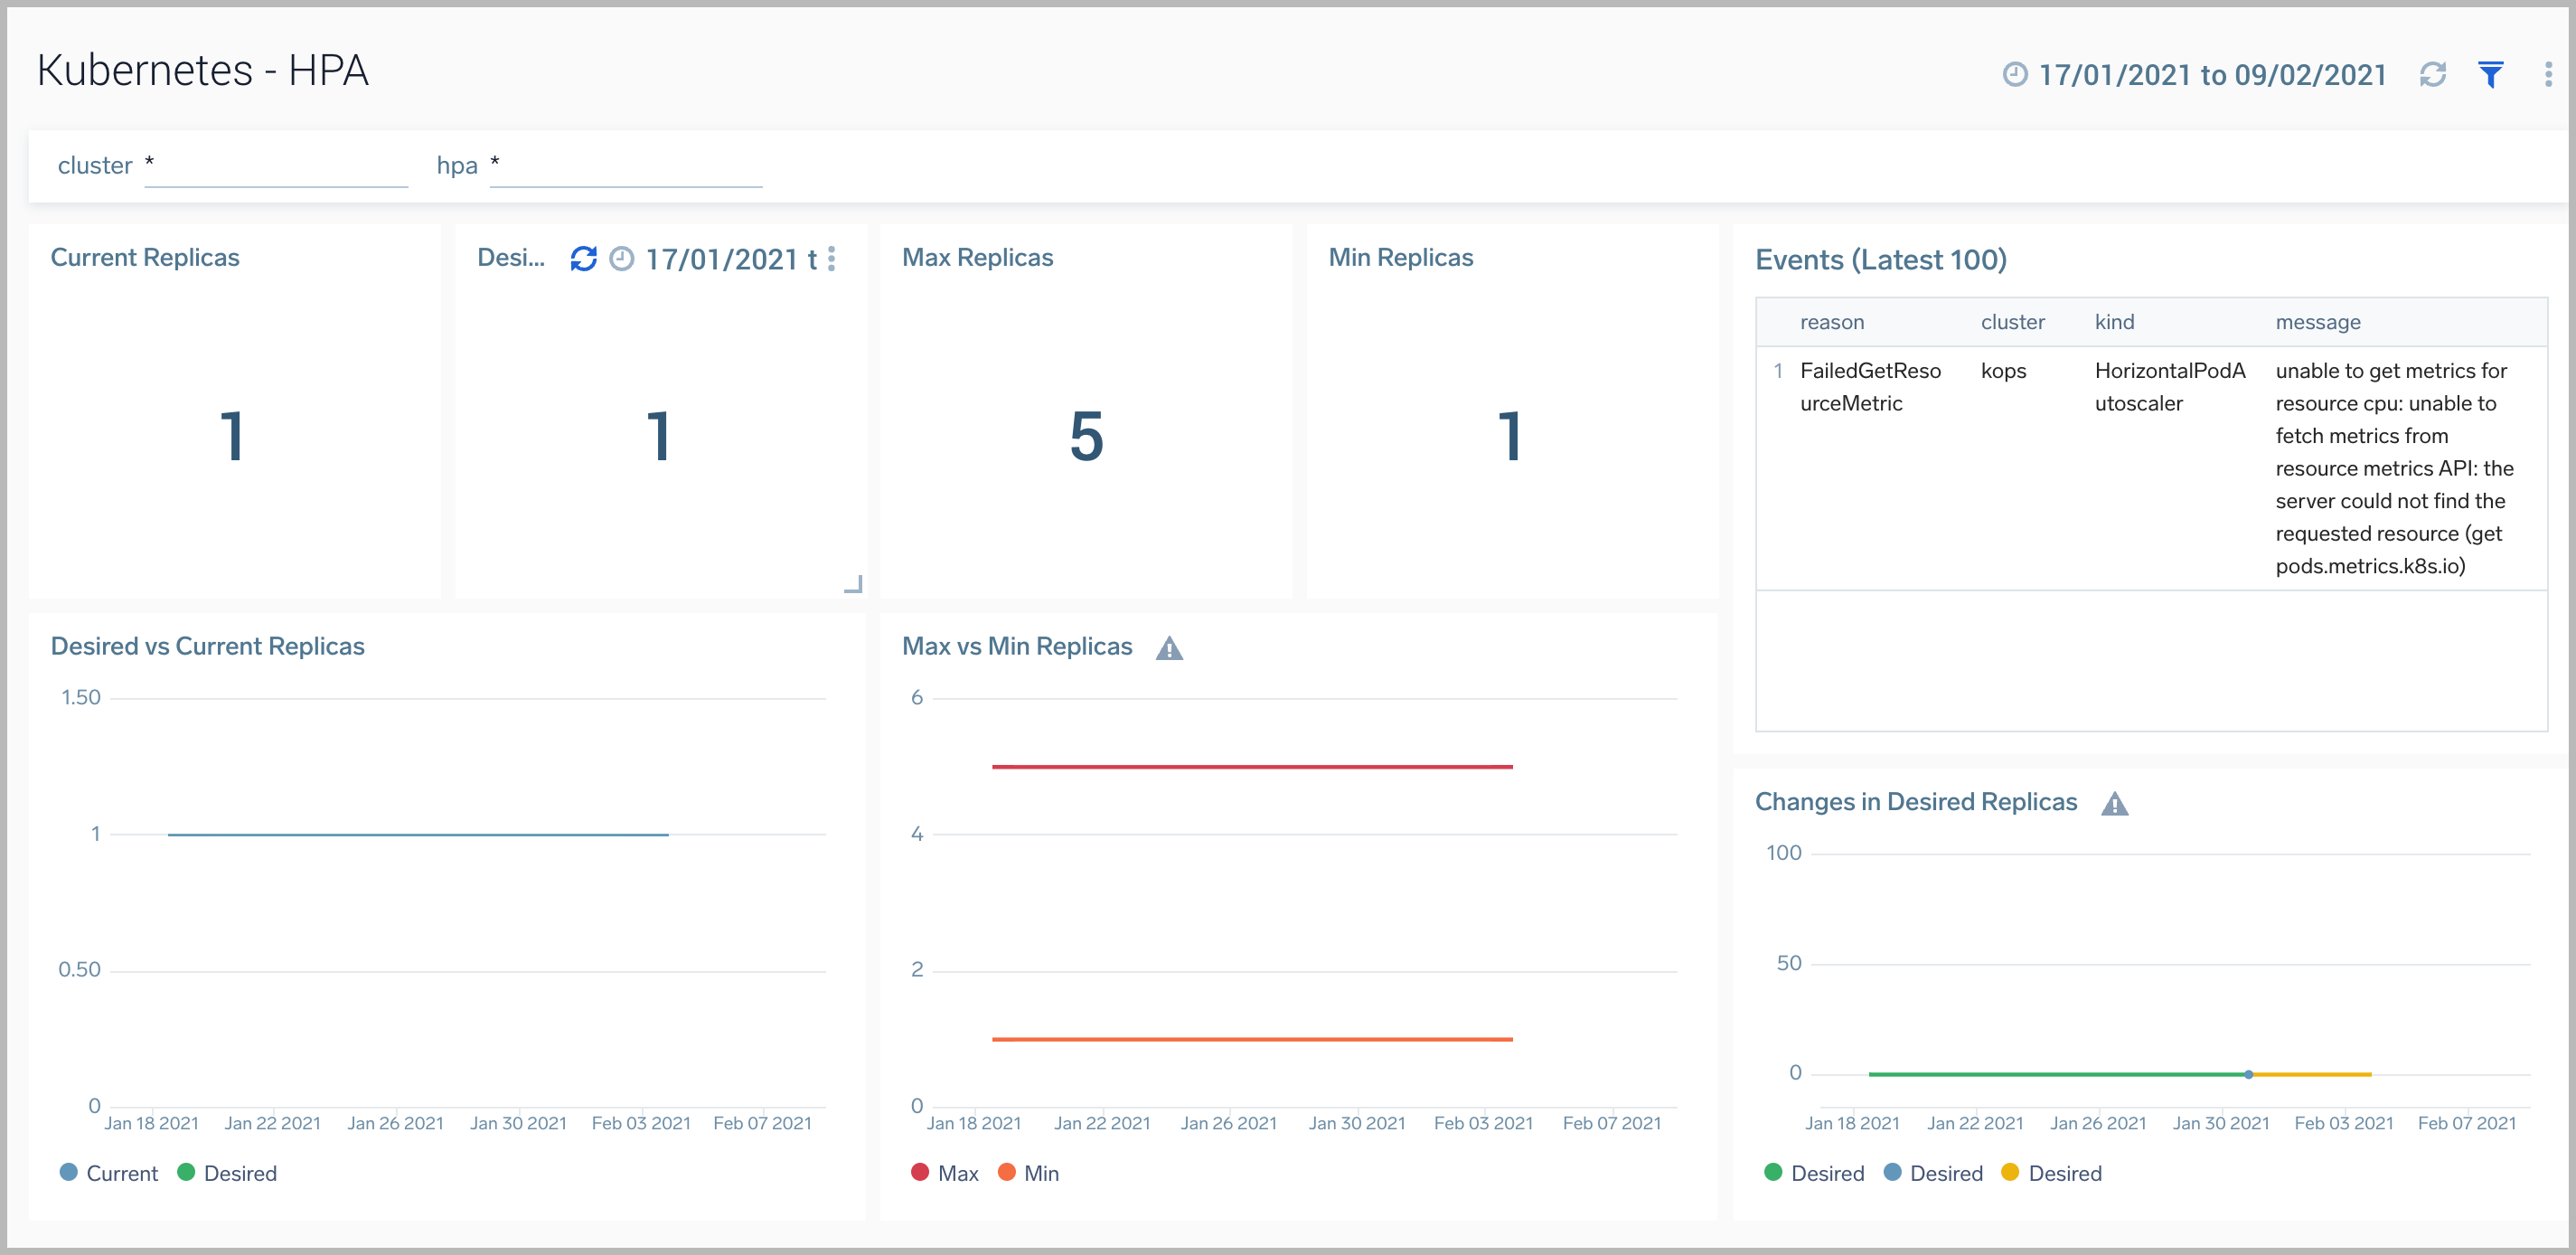
HPA
The Horizontal Pod Autoscaler automatically scales the number of Pods in a replication controller, deployment, replica set or stateful set based on observed CPU utilization.
The Kubernetes - HPAdashboard provides visibility into the health and performance of HPA.
Use this dashboard to:
- Identify whether the required replica level has been achieved or not.
- View logs and errors and investigate potential issues.