Docker Enterprise Edition
Docker Enterprise Edition (Docker EE) is an industry standard container platform, running modern container orchestration engines such as Kubernetes behind the scenes. Docker EE is designed for enterprise development and IT teams who build, ship, and run applications in production scale environments.
The Docker EE App facilitates monitoring and troubleshooting distributed microservice based applications running in Docker containers. The app enables you to correlate events across the Docker platform and application containers and detects anomalous patterns for faster root cause analysis.
The Docker EE App works in conjunction with the Docker ULM App that monitors application container workloads running on the Docker EE platform.
Log Types and Examples
The Docker EE App uses the following log types.
| Log Source Type | Example Log Message |
| Containerd | {"timestamp":1557369652796,"PRIORITY":"6","SYSLOG_FACILITY":"3","_SELINUX_CONTEXT":"unconfined\n","_SYSTEMD_SLICE":"system.slice","_BOOT_ID":"27b76ce41e524d5786122a7601a30f01","_MACHINE_ID":"a211db66c10846958dace7213f56ad40","_HOSTNAME":"dhsumo1-ubuntu-0","_TRANSPORT":"stdout","_STREAM_ID":"1fc1aa8d32304654b4dedcfd82c595e1","SYSLOG_IDENTIFIER":"containerd","_PID":"3381","_UID":"0","_GID":"0","_COMM":"containerd","_EXE":"/usr/bin/containerd","_CMDLINE":"/usr/bin/containerd","_CAP_EFFECTIVE":"3fffffffff","_SYSTEMD_CGROUP":"/system.slice/containerd.service","_SYSTEMD_UNIT":"containerd.service","_SYSTEMD_INVOCATION_ID":"6b881bb9bcad433b9e2f01c229ec195d","MESSAGE":"time=\"2019-05-09T02:40:52.796014949Z\" level=info msg=\"shim reaped\" id=454288d0618791e40195dd7c44514fd7d47e33c35ee4d504a24cbe236afdcb22"} |
| Dockerd | {"timestamp":1557369759861,"_TRANSPORT":"stdout","_STREAM_ID":"1acb0db4a82e4939bce686ec10fe7acb","PRIORITY":"6","SYSLOG_FACILITY":"3","SYSLOG_IDENTIFIER":"dockerd","_PID":"7665","_UID":"0","_GID":"0","_COMM":"dockerd","_EXE":"/usr/bin/dockerd","_CMDLINE":"/usr/bin/dockerd -H unix:// -H tcp://0.0.0.0:2376","_CAP_EFFECTIVE":"3fffffffff","_SELINUX_CONTEXT":"unconfined\n","_SYSTEMD_CGROUP":"/system.slice/docker.service","_SYSTEMD_UNIT":"docker.service","_SYSTEMD_SLICE":"system.slice","_SYSTEMD_INVOCATION_ID":"2f449d0f7cc5447daf4949fb771486f4","_BOOT_ID":"834f3038ccd142e094f31476fa66505a","_MACHINE_ID":"a211db66c10846958dace7213f56ad40","_HOSTNAME":"dhsumo1-ubuntu-3","MESSAGE":"time=\"2019-05-09T02:42:39.861578501Z\" level=error msg=\"Handler for GET /v1.39/swarm/unlockkey returned error: This node is not a swarm manager. Worker nodes can't be used to view or modify cluster state. Please run this command on a manager node or promote the current node to a manager.\""} |
| Docker Trusted Registry (DTR) Client Requests | 127.0.0.1 - - [09/May/2019:01:29:17 +0000] "GET /health HTTP/1.1" 200 27 "-" "curl/7.61.1" |
| Docker Trusted Registry (DTR) | {"auth.user.name":"b246c77d-4f32-4d7b-a05f-e9d0def0b739","go.version":"go1.11.5","http.request.contenttype":"application/vnd.docker.distribution.manifest.v2+json","http.request.host":"34.222.139.0","http.request.id":"d7c3c77a-c4de-4ef8-a1c5-c58192b70120","http.request.method":"PUT","http.request.remoteaddr":"71.204.129.194","http.request.uri":"/v2/admin/sampleapp/manifests/latest","http.request.useragent":"docker/0.0.0-20190424223053-cfe423a go/go1.11.5 git-commit/cfe423a kernel/4.15.0-47-generic os/linux arch/amd64 UpstreamClient(Docker-Client/0.0.0-20190424223053-cfe423a \\(linux\\))","level":"info","msg":"dispatching manifest put payload","payload":{"namespace":"admin","repository":"sampleapp","digest":"sha256:f79f7a10302c402c052973e3fa42be0344ae6453245669783a9e16da3d56d5b4","imageName":"admin/sampleapp@sha256:f79f7a10302c402c052973e3fa42be0344ae6453245669783a9e16da3d56d5b4","os":"linux","architecture":"amd64","author":"admin","pushedAt":"2019-05-07T01:58:24.198629261Z"},"time":"2019-05-07T01:58:24.198643304Z","vars.name":"admin/sampleapp","vars.reference":"latest"} |
| Universal Control Plane (UCP) | E0509 02:44:15.887502 1 goroutinemap.go:150] Operation for "provision-default/orcl-pv-claim[4e38340b-6866-11e9-95b6-0242ac11000a]" failed. No retries permitted until 2019-05-09 02:46:17.887477418 +0000 UTC m=+453713.589406681 (durationBeforeRetry 2m2s). Error: "AzureDisk - failed to get Azure Cloud Provider. GetCloudProvider returned nil instead" |
Sample Queries
This section provides query samples taken from the Docker EE App dashboards.
_sourceCategory=kubernetes/system _sourceName=containerd !"level=debug"
| json "MESSAGE", "_HOSTNAME", "_PID", "_SYSTEMD_INVOCATION_ID" as msg, hostname, pid, system_invocation_id
| parse regex field=msg "time=\"(?<time>[\S]+)\" level=(?<level>[\S]+) msg=\"(?<message>.*)\""
_sourceCategory=docker _sourceName = dtr-registry-* (PUT) pushedAt "dispatching manifest put payload"
| json  "$['auth.user.name']", "$['http.request.host']", "$['http.request.method']", "$['http.request.remoteaddr']", "$['http.request.uri']", "$['http.request.useragent']", "level", "payload.repository", "payload.imageName", "payload.os", "payload.author", "payload.pushedAt" as user_id, host, method, remote_ip , uri, user_agent, level, repository, image_name, os, author, time_pushed_at
| count by time_pushed_at, image_name, repository, author, user_id, host, method, remote_ip , uri, level, os
_sourceCategory=docker _sourceName = dtr-nginx*
| parse regex "^(?<src_ip>\d{1,3}\.\d{1,3}\.\d{1,3}\.\d{1,3})" nodrop
| parse regex "(?<method>[A-Z]+)\s(?<url>\S+)\sHTTP/[\d\.]+\"\s(?<status_code>\d+)\s(?<size>[\d-]+)" nodrop
| parse regex "(?<method>[A-Z]+)\s(?<url>\S+)\sHTTP/[\d\.]+\"\s(?<status_code>\d+)\s(?<size>[\d-]+)\s\"(?<referrer>.*?)\"\s\"(?<user_agent>.+?)\".*" nodrop
_sourceCategory=kubernetes/system _sourceName=docker
| json "MESSAGE", "_HOSTNAME", "_PID", "_SYSTEMD_INVOCATION_ID" as msg, hostname, pid, system_invocation_id
| parse regex field=msg "time=\"(?<time>[\S]+)\" level=(?<level>[\S]+) msg=\"(?<message>.*)\""
_sourceCategory=docker _sourceName= ucp-kube-controller-manager (fail* or error or except*)
| parse "* *       *" as misc,time,msg
Collecting Logs and Metrics for Docker EE
This section has instructions for collecting logs for the Sumo App for Docker EE. This app works in conjunction with the Docker ULM App, and the first step is to configure collection for Docker ULM App. Then, since Docker EE uses Kubernetes for orchestration, you install and deploy the Sumo Logic Collection Helm Chart for collection of Docker EE specific components.
Step 1. Collect Logs and Metrics for the Docker ULM App
This section shows you how to configure log and metric collection for the Docker ULM App, which requires configuring two sources:
- Docker Logs. Collects stdout/stderr logs from processes that are running within Docker containers.
- Docker Stats. Collects metrics about Docker containers.
To configure log and metric collection for the Docker ULM App, do the following:
- Follow the instructions to Collect Logs and Metrics for Docker ULM. Use the same
_sourceCategoryfor each host on your cluster. - Follow the instructions to Install the Docker ULM App and dashboards.
Step 2. Deploy Sumo Logic Collection Helm Chart to collect logs and metrics
For details see Kubernetes Observability and check the Kubernetes Quickstart for installation instructions.
Troubleshooting
If you get the following error while executing kubectl, your kube config is not wired correctly to UCP’s kube: The connection to the server localhost:8080 was refused - did you specify the right host or port?
Do the following:
- Log in to the UCP Web UI (dashboard), navigate to your user account, and click My Profile.
- Then click Client Bundles > New Client Bundle > Generate Client Bundle.
- Unpack the ucp-bundle-XYZ.zip file on the Manager Node/Machine.
unzip ucp-bundle-XYZ.zip - Run the following command.
source env.sh
Assuming you have a Mac/Unix environment, docker and kubectl will work on your cluster as your user ID, as shown in the following example where the user ID is admin.
Installing the Docker EE App
You configured two sources for collection, docker logs and docker stats, and therefore will specify two source categories when installing the Docker EE App.
To install the Docker EE App, do the following:
- From the App Catalog, search for and select the app.
- To install the app, click Add to Library.
- You retain the default App Name, or enter a name of your choice for the app.
- Select the following options for the Docker Log source.
- Choose Source Category, and select the Source Category from the list.
- Choose Enter a Custom Data Filter, and for the Docker Log Source enter the source category with the value from Step 1 of the collection instructions, beginning with an underscore, for example:
_sourceCategory=docker
- Select the following option for the Docker Platform Log Source.
- Choose Source Category, and select the Source Category from the list.
- Choose Enter a Custom Data Filter, and enter the source category specified in Step 2 of collection instructions followed by “
/system”, for example:_sourceCategory=kubernetes/system
- Advanced. Select the Location in Library (the default is the Personal folder in the library), or click New Folder to add a new folder.
- Click Add to Library.
Once an app is installed, it will appear in your Personal folder, or another folder that you specified. From here, you can share it with your organization.
Panels will start to fill automatically. It's important to note that each panel slowly fills with data matching the time range query and received since the panel was created. Results won't immediately be available, but with a bit of time, you'll see full graphs and maps.
Viewing Docker EE Dashboards
Each dashboard has a set of filters that you can apply to the entire dashboard, as shown in the following example. Click the funnel icon in the top dashboard menu bar to display a scrollable list of filters that are applied across the entire dashboard.
You can use filters to drill down and examine the data on a granular level.
Each panel has a set of filters that are applied to the results for that panel only, as shown in the following example. Click the funnel icon in the top panel menu bar to display a list of panel-specific filters.
UCP Overview
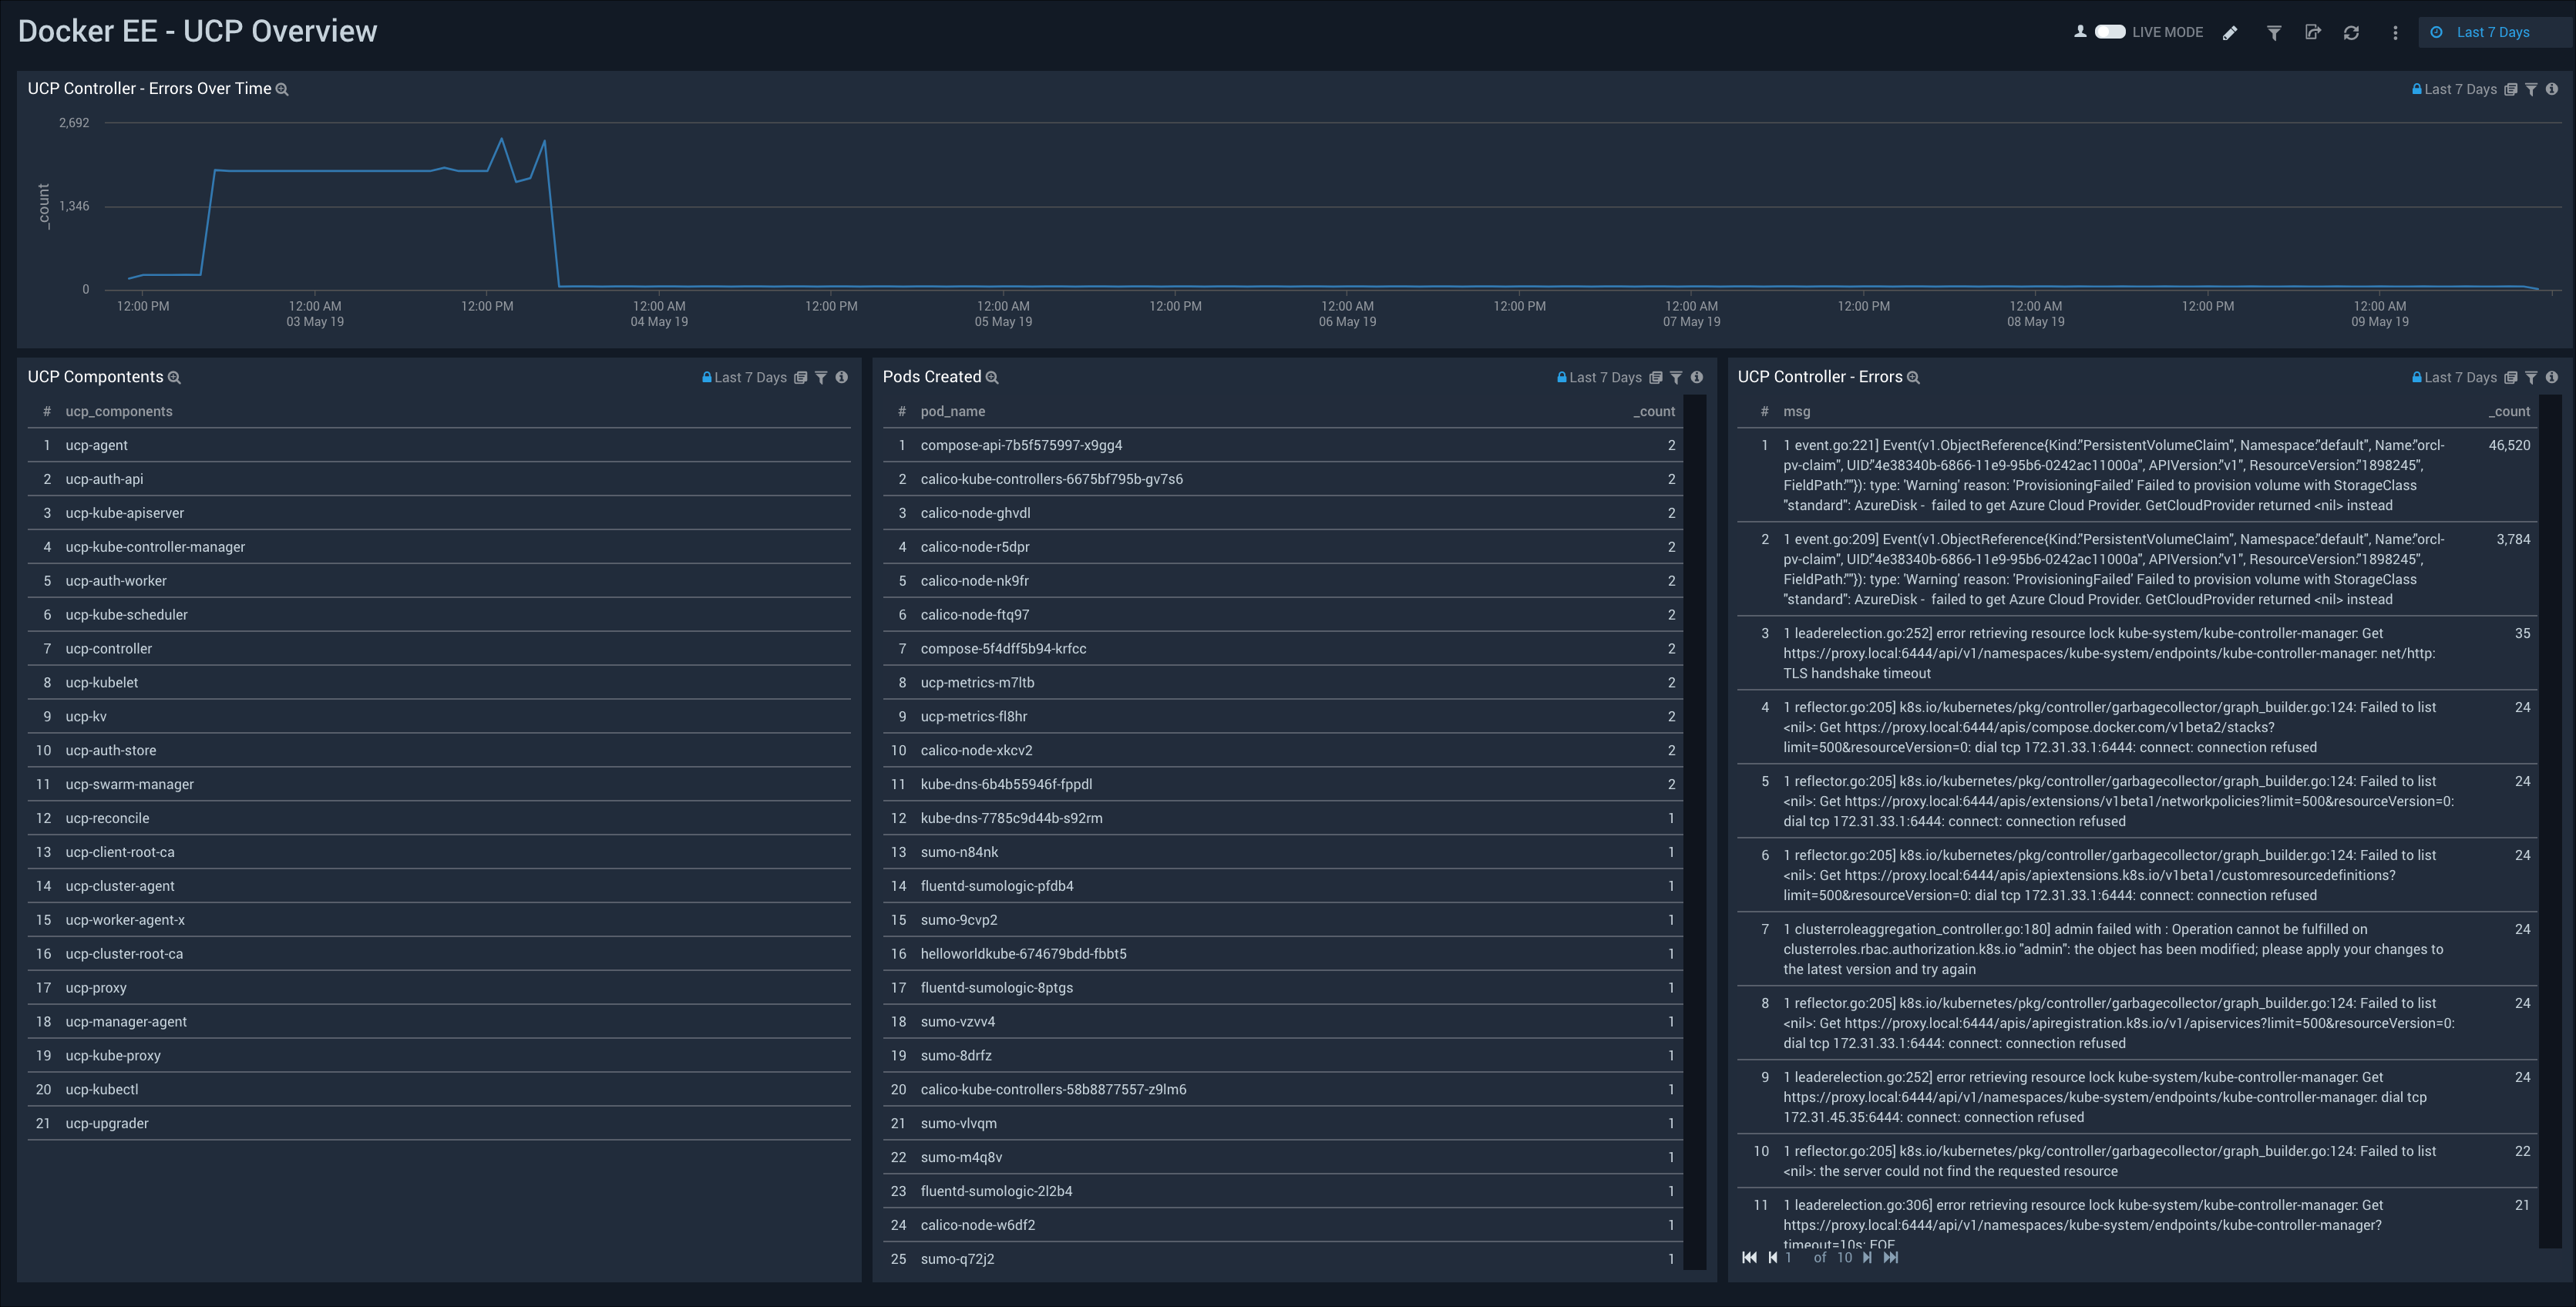
The Docker EE - UCP Overview Dashboard provides detailed information on the Docker Universal Control Plane (UCP) components, including pods created, UCP controller errors, and trends for UCP controller errors.
Docker Universal Control Plane (UCP) is the cluster management solution for managing a Docker cluster and applications.
Use this dashboard to:
- Find errors in the Docker Universal Control Plane.
- Find recent pods created by UCP.
Dockerd Monitoring
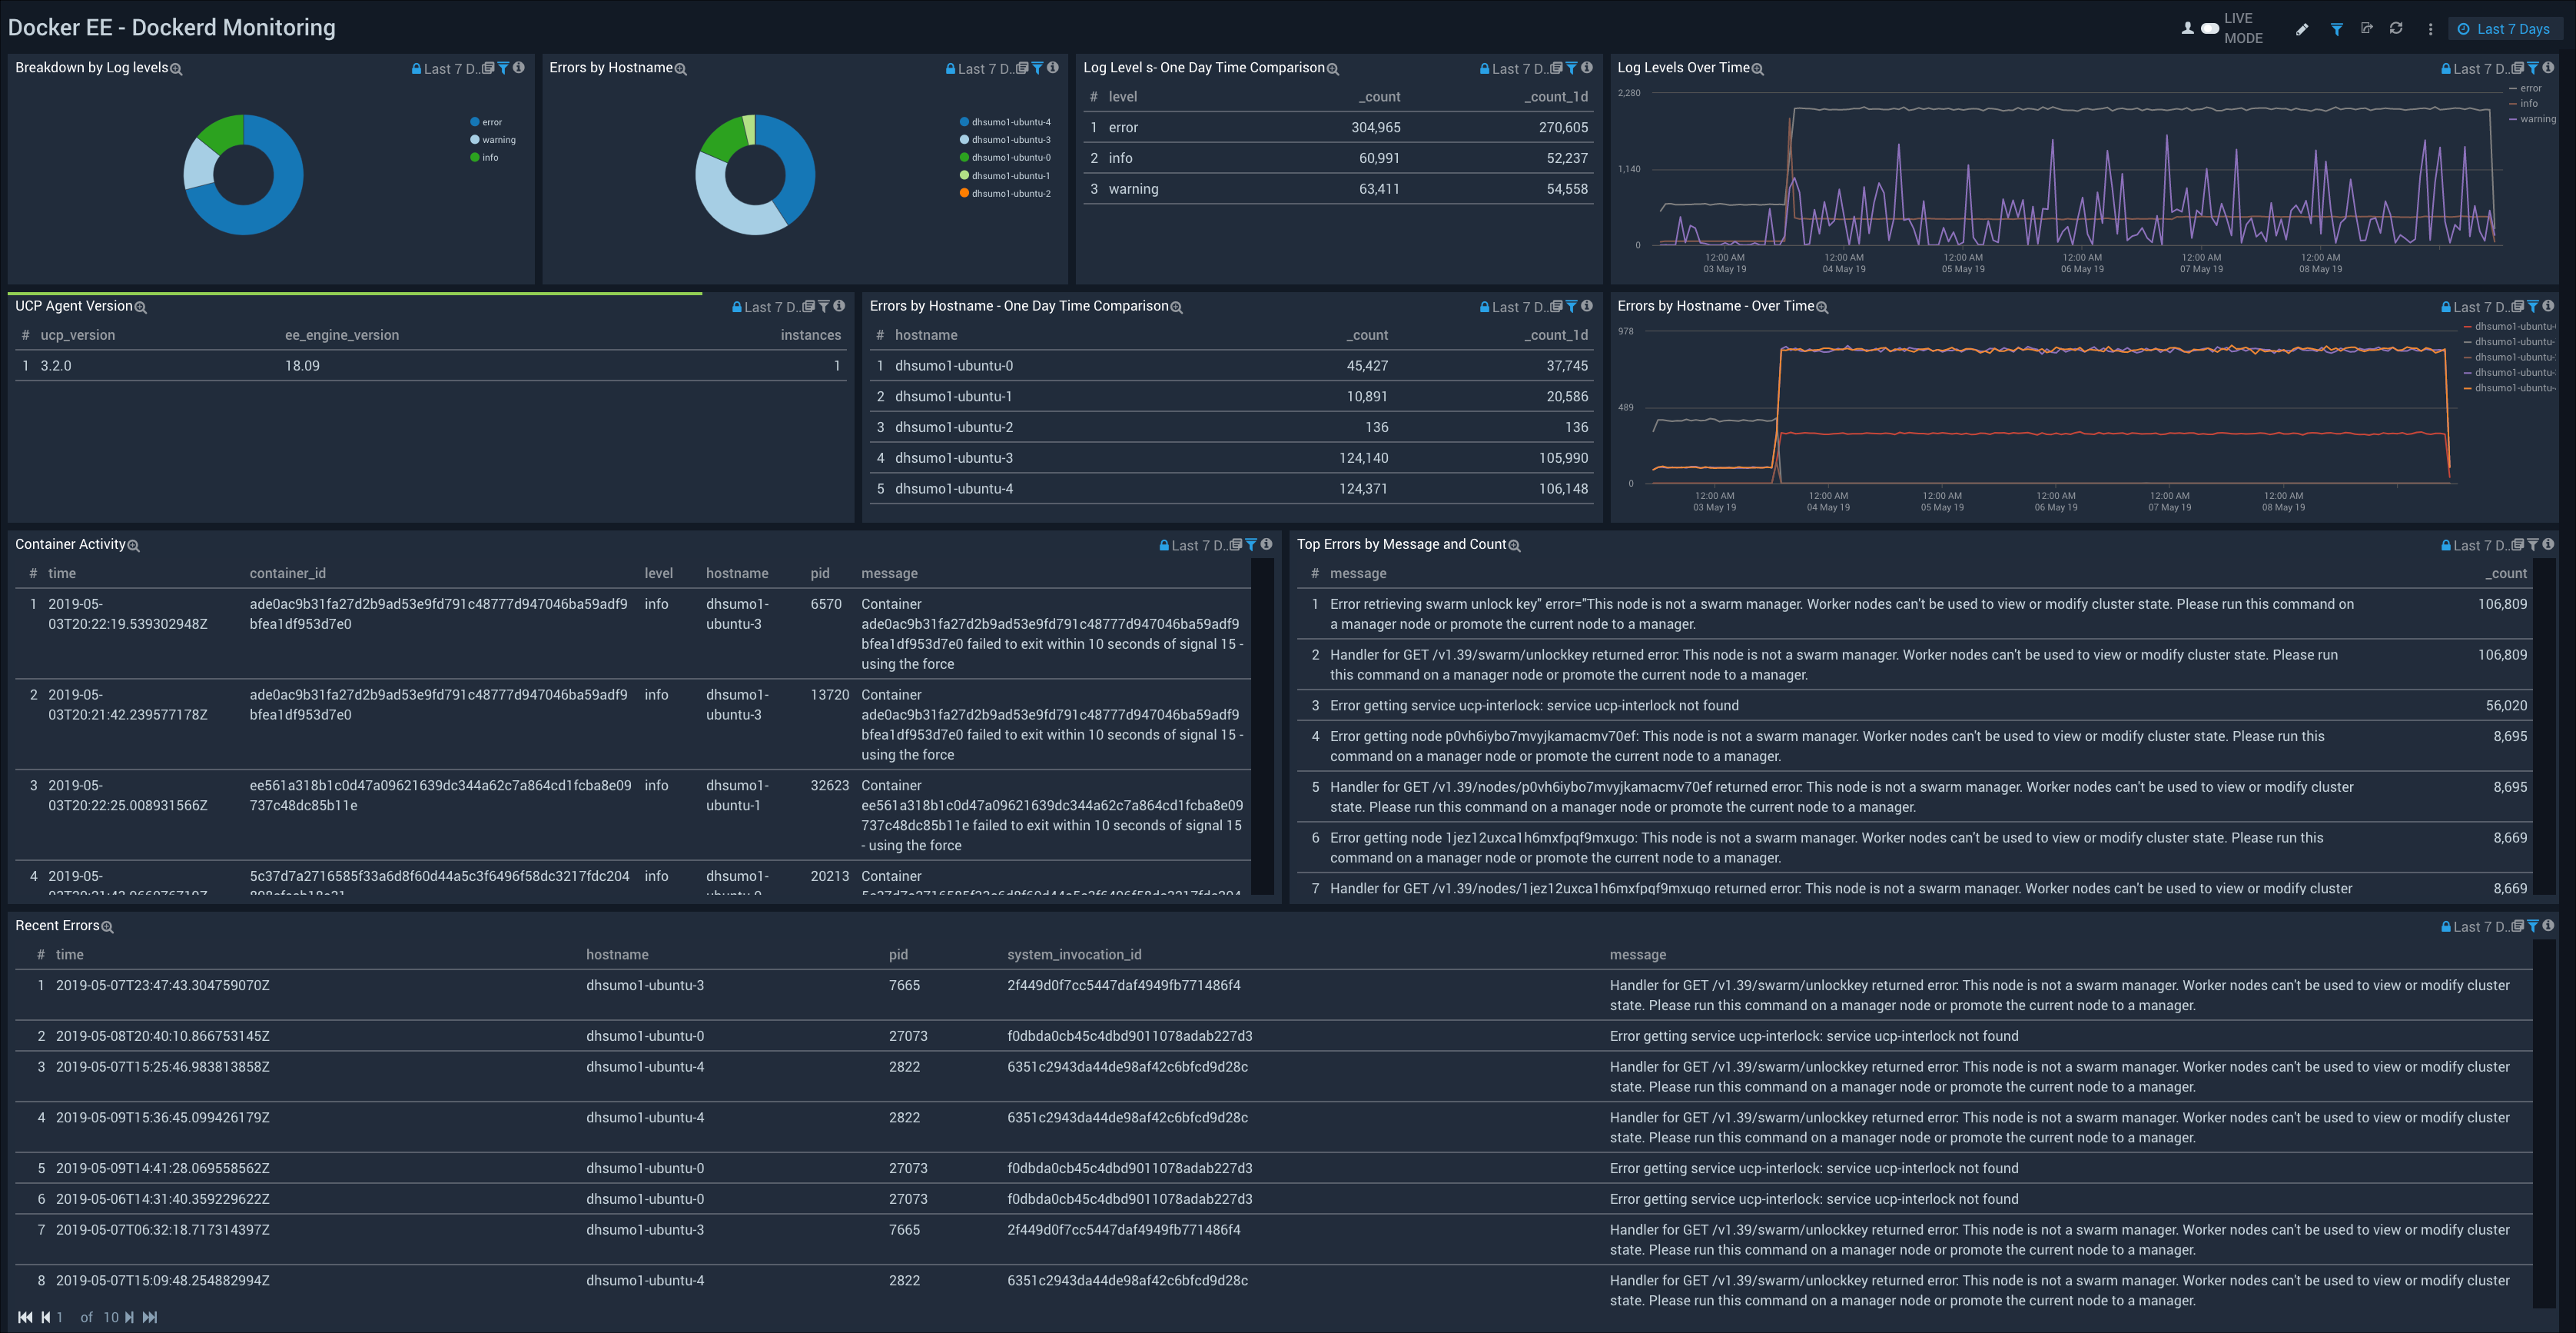
The Docker EE - Dockerd Monitoring Dashboard provides detailed information on the “dockerd” utility that manages containers, including log levels, hostname errors, recent errors, container activity, and UCP agent versions. The panels also provide visualizations to understand log level trends and errors by hostname trends, as well as tabular comparisons over time.
Use this dashboard to:
- Troubleshoot “dockerd” by investigating docker daemon errors, exceptions and failures. You can identify unusual activity or spikes in the number of errors using the Time Comparison and Log Levels Over Time charts.
- Analyze container activities by events.
Containerd Monitoring
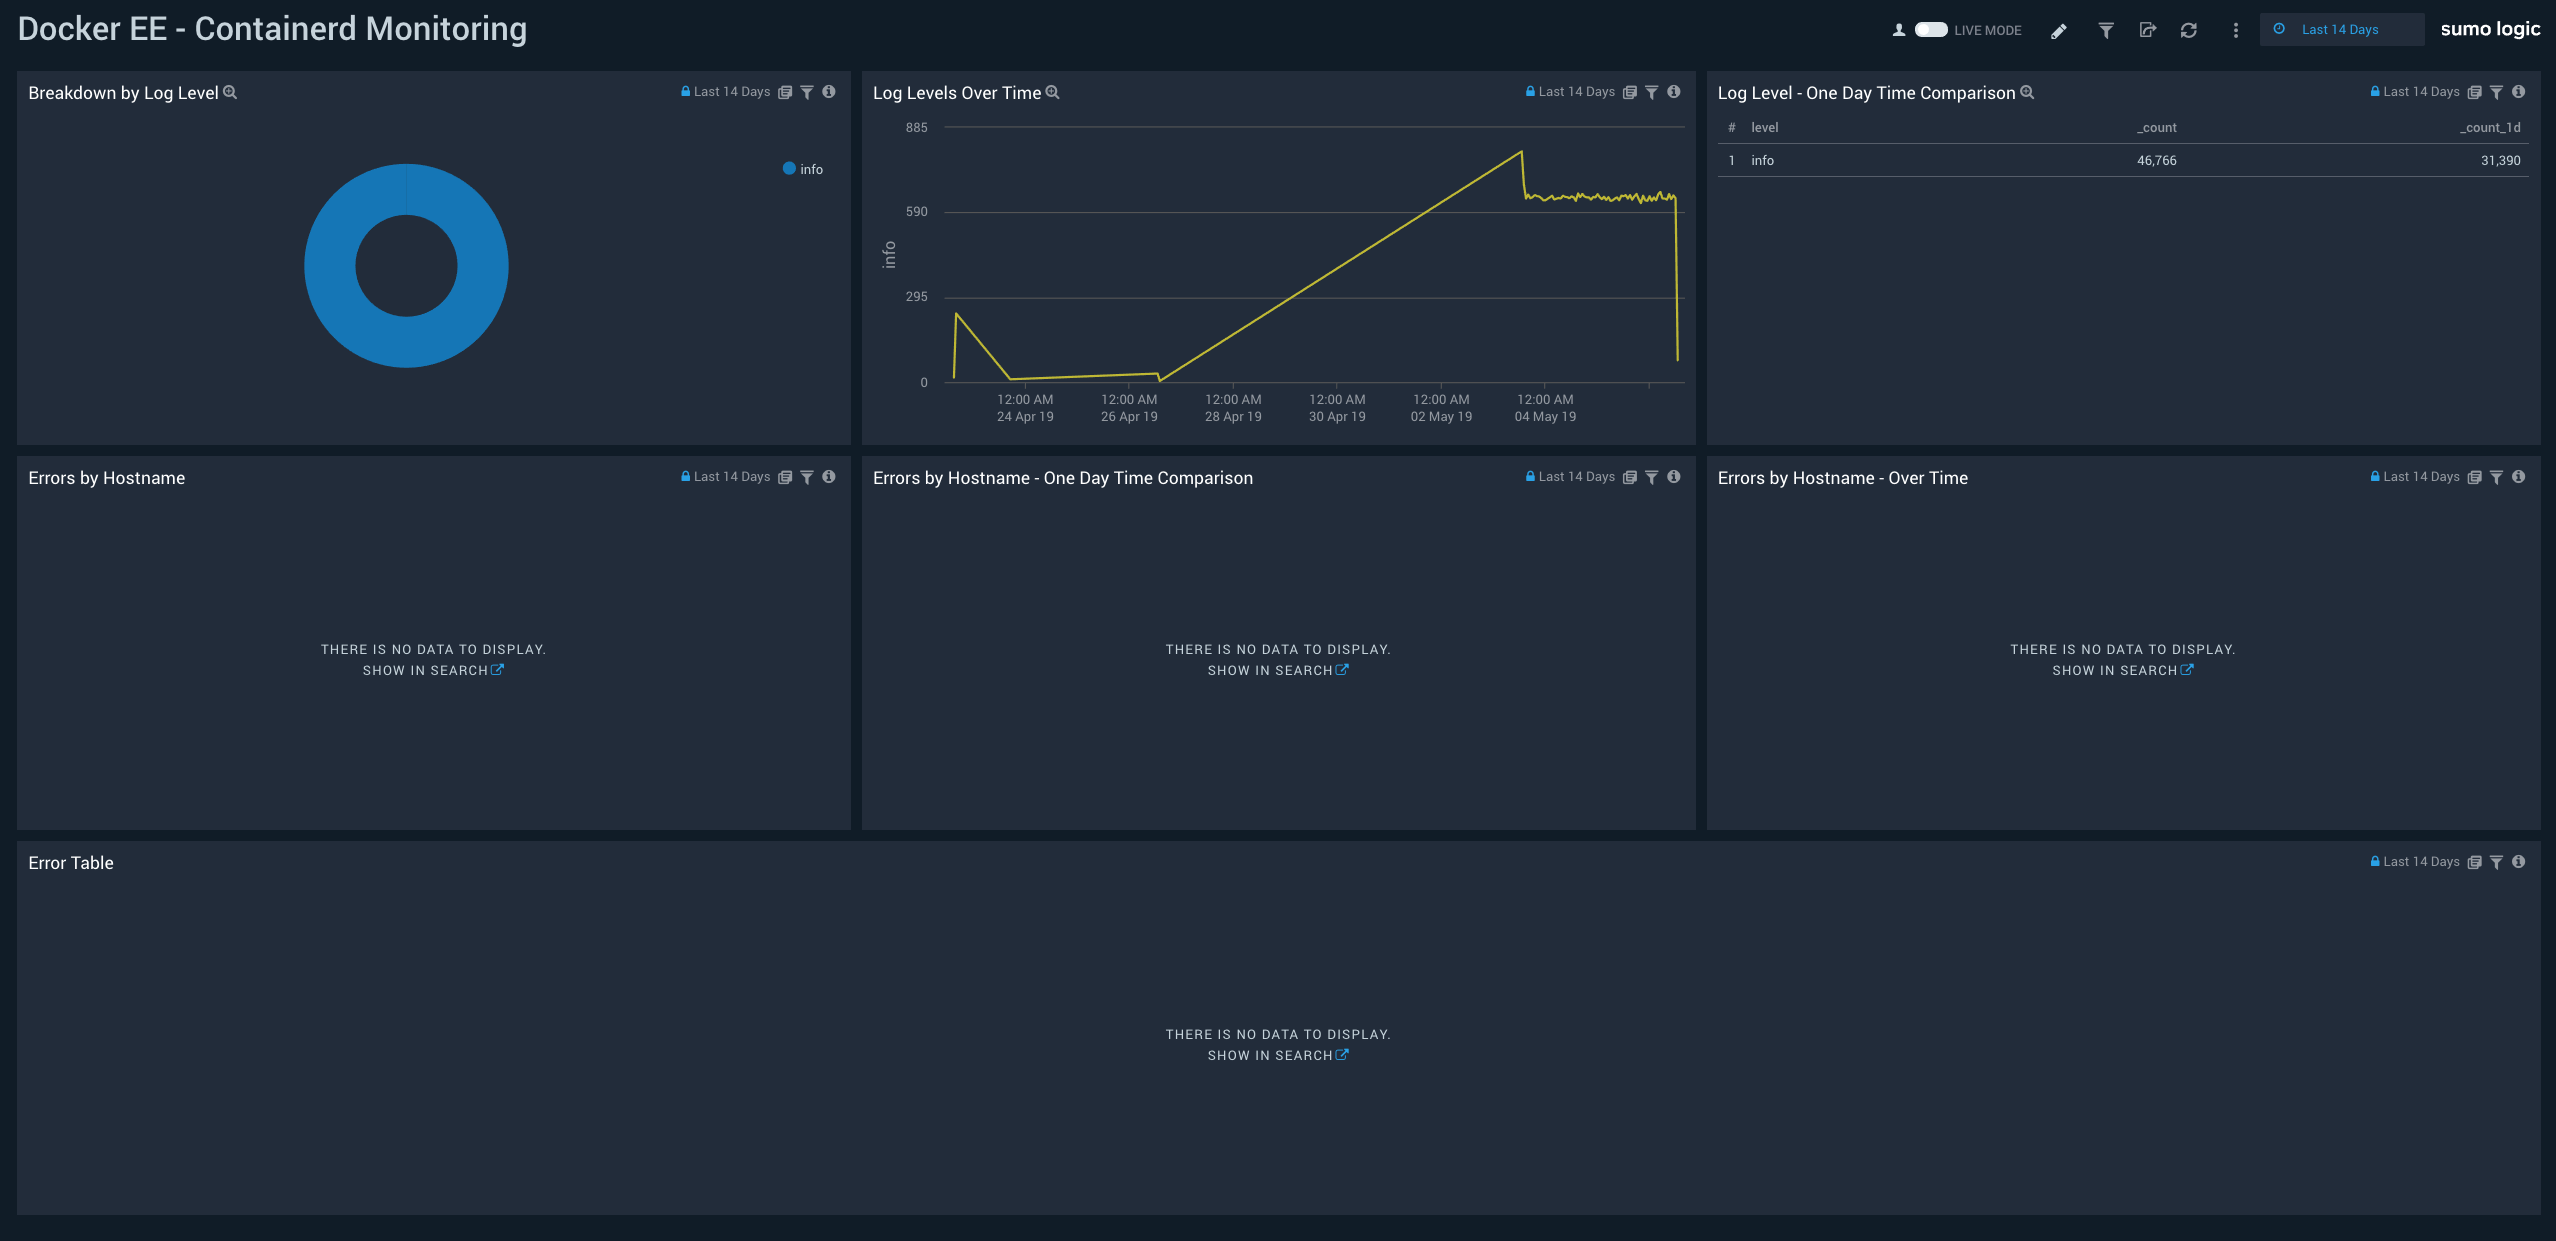
The Docker EE - Containerd Monitoring Dashboard provides detailed information on the containerd utility that allows you to run containers on Linux, Windows, Solaris, or other operating systems. This includes a log level breakdown, trends, and comparisons; hostname errors, trends, and comparisons, and detailed information on errors.
Use this dashboard to:
- Troubleshoot “containerd” by investigating errors, exceptions and failures.
- Identify unusual activity or spikes in the number of errors logs using the Time Comparison and Log Levels Over Time charts.
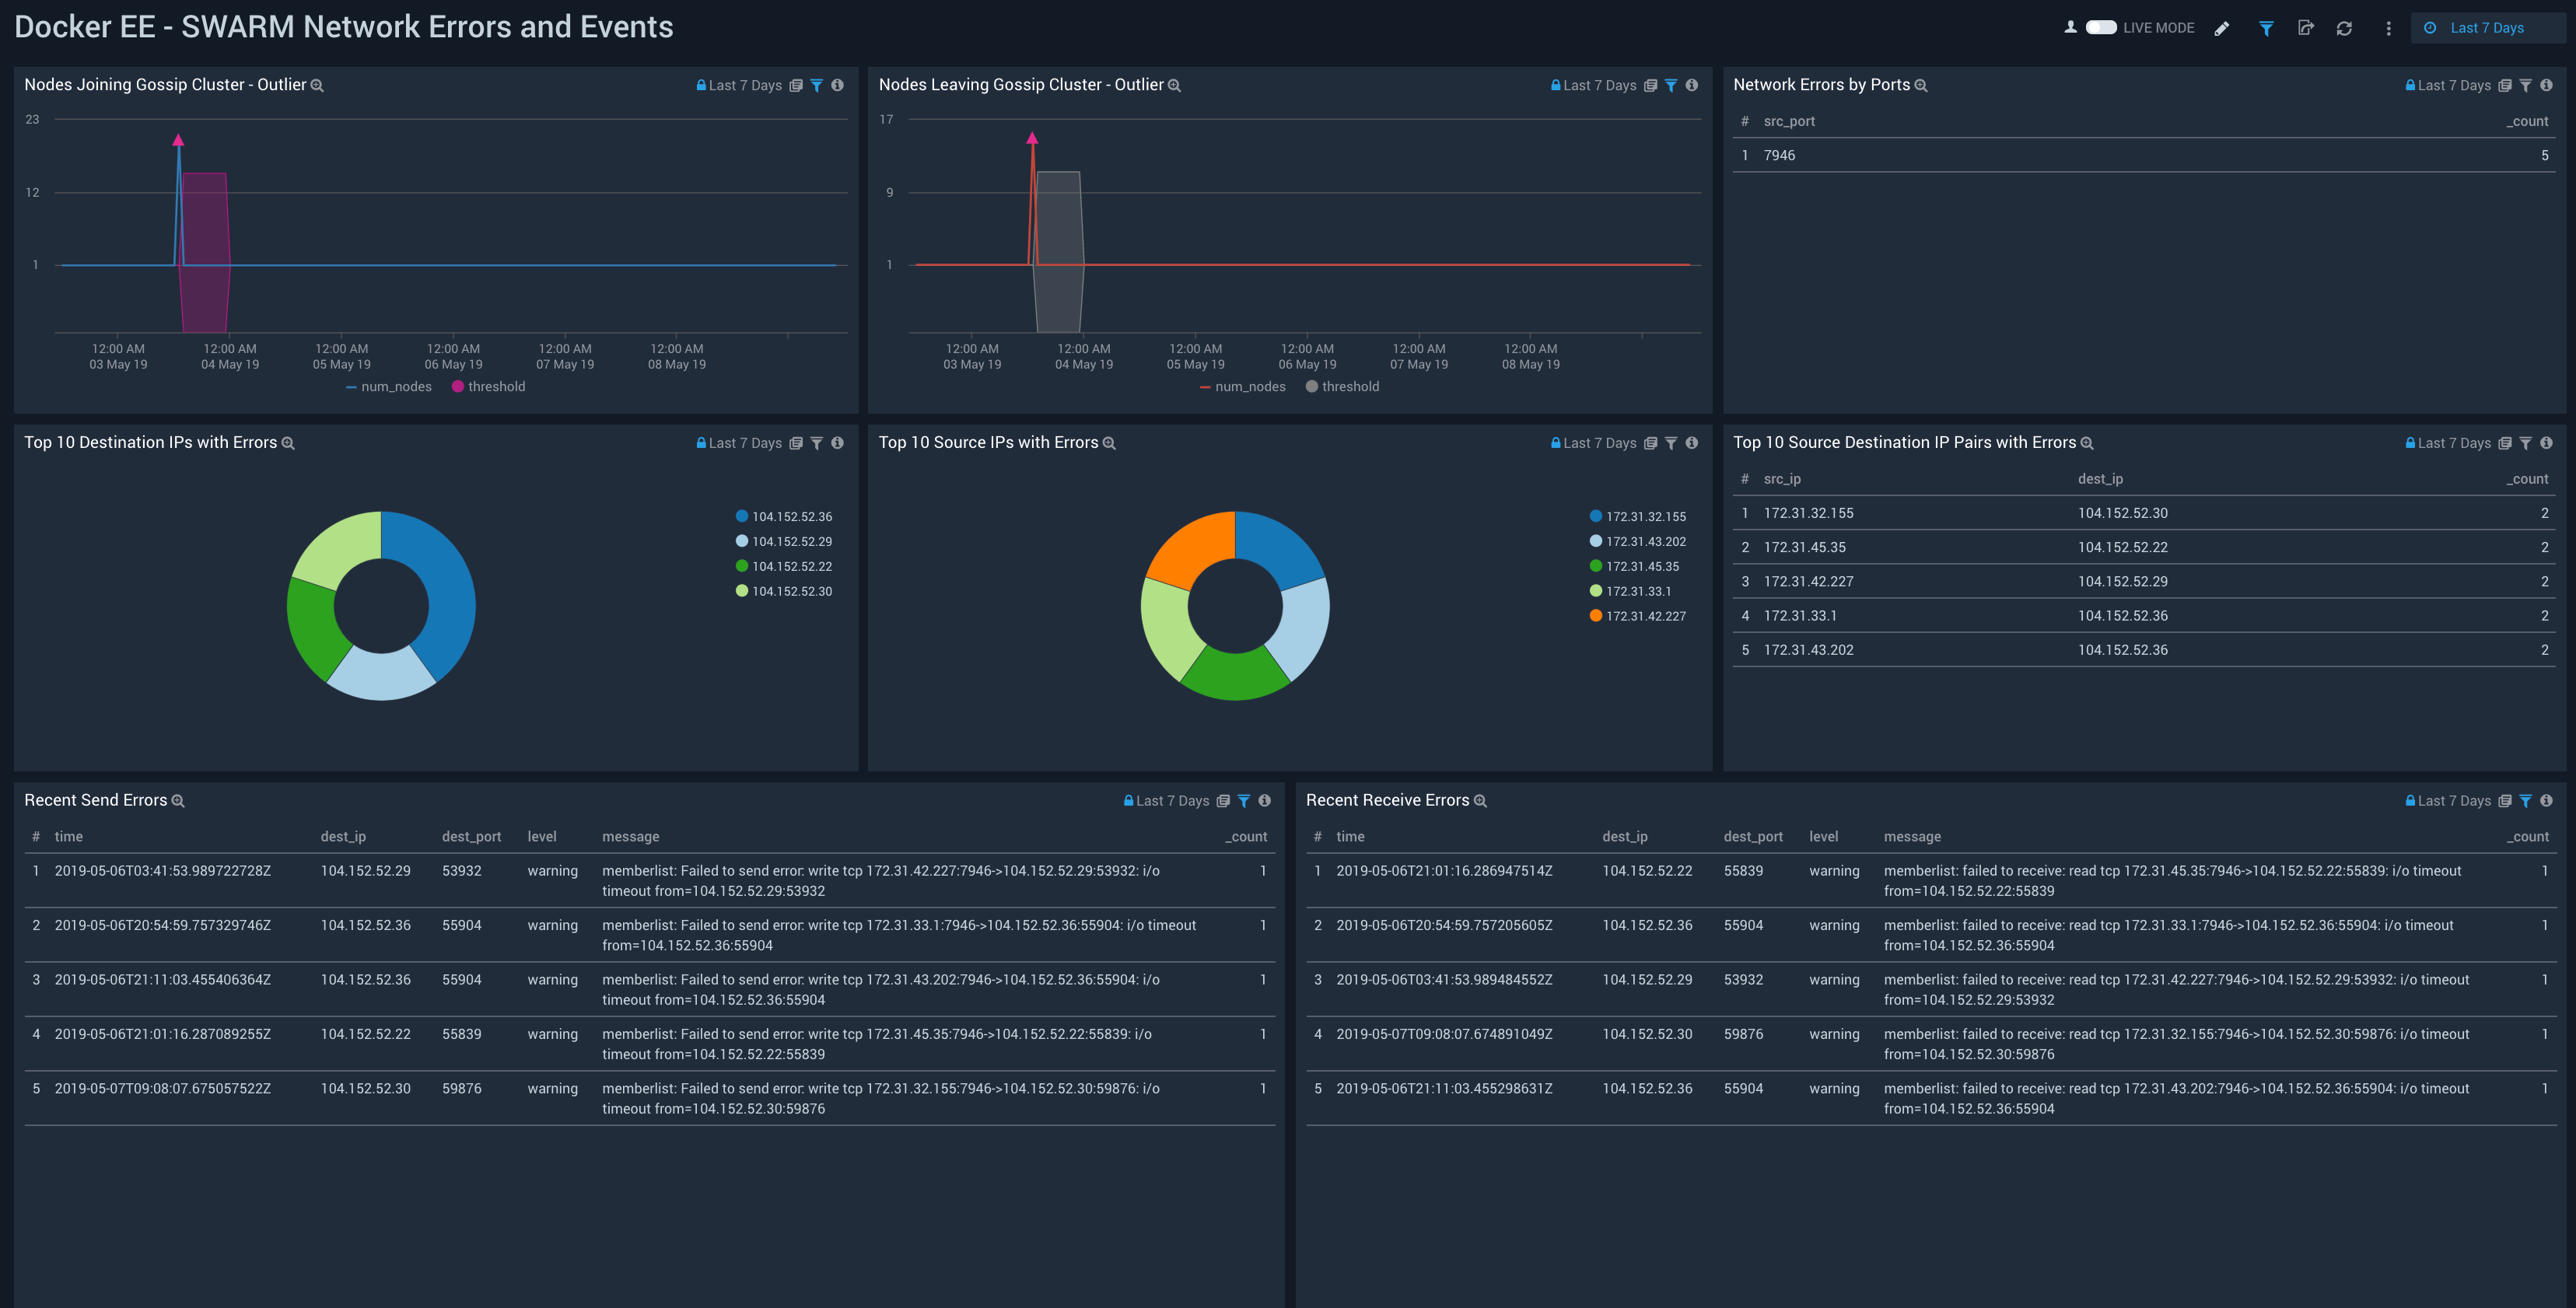
SWARM Network Errors and Events
The Docker EE - SWARM Network Errors and Events Dashboard provides an at a glance view of cluster node outliers, network errors by port, and the top source and destination IPs. The panels also provide detailed information on recent Send and Receive errors. SWARM is a Docker-native clustering system.
Use this dashboard to:
- Monitor nodes joining or leaving the Gossip Cluster.
- Analyze send errors, receive errors, and errors breakdown by destination/source IPs.
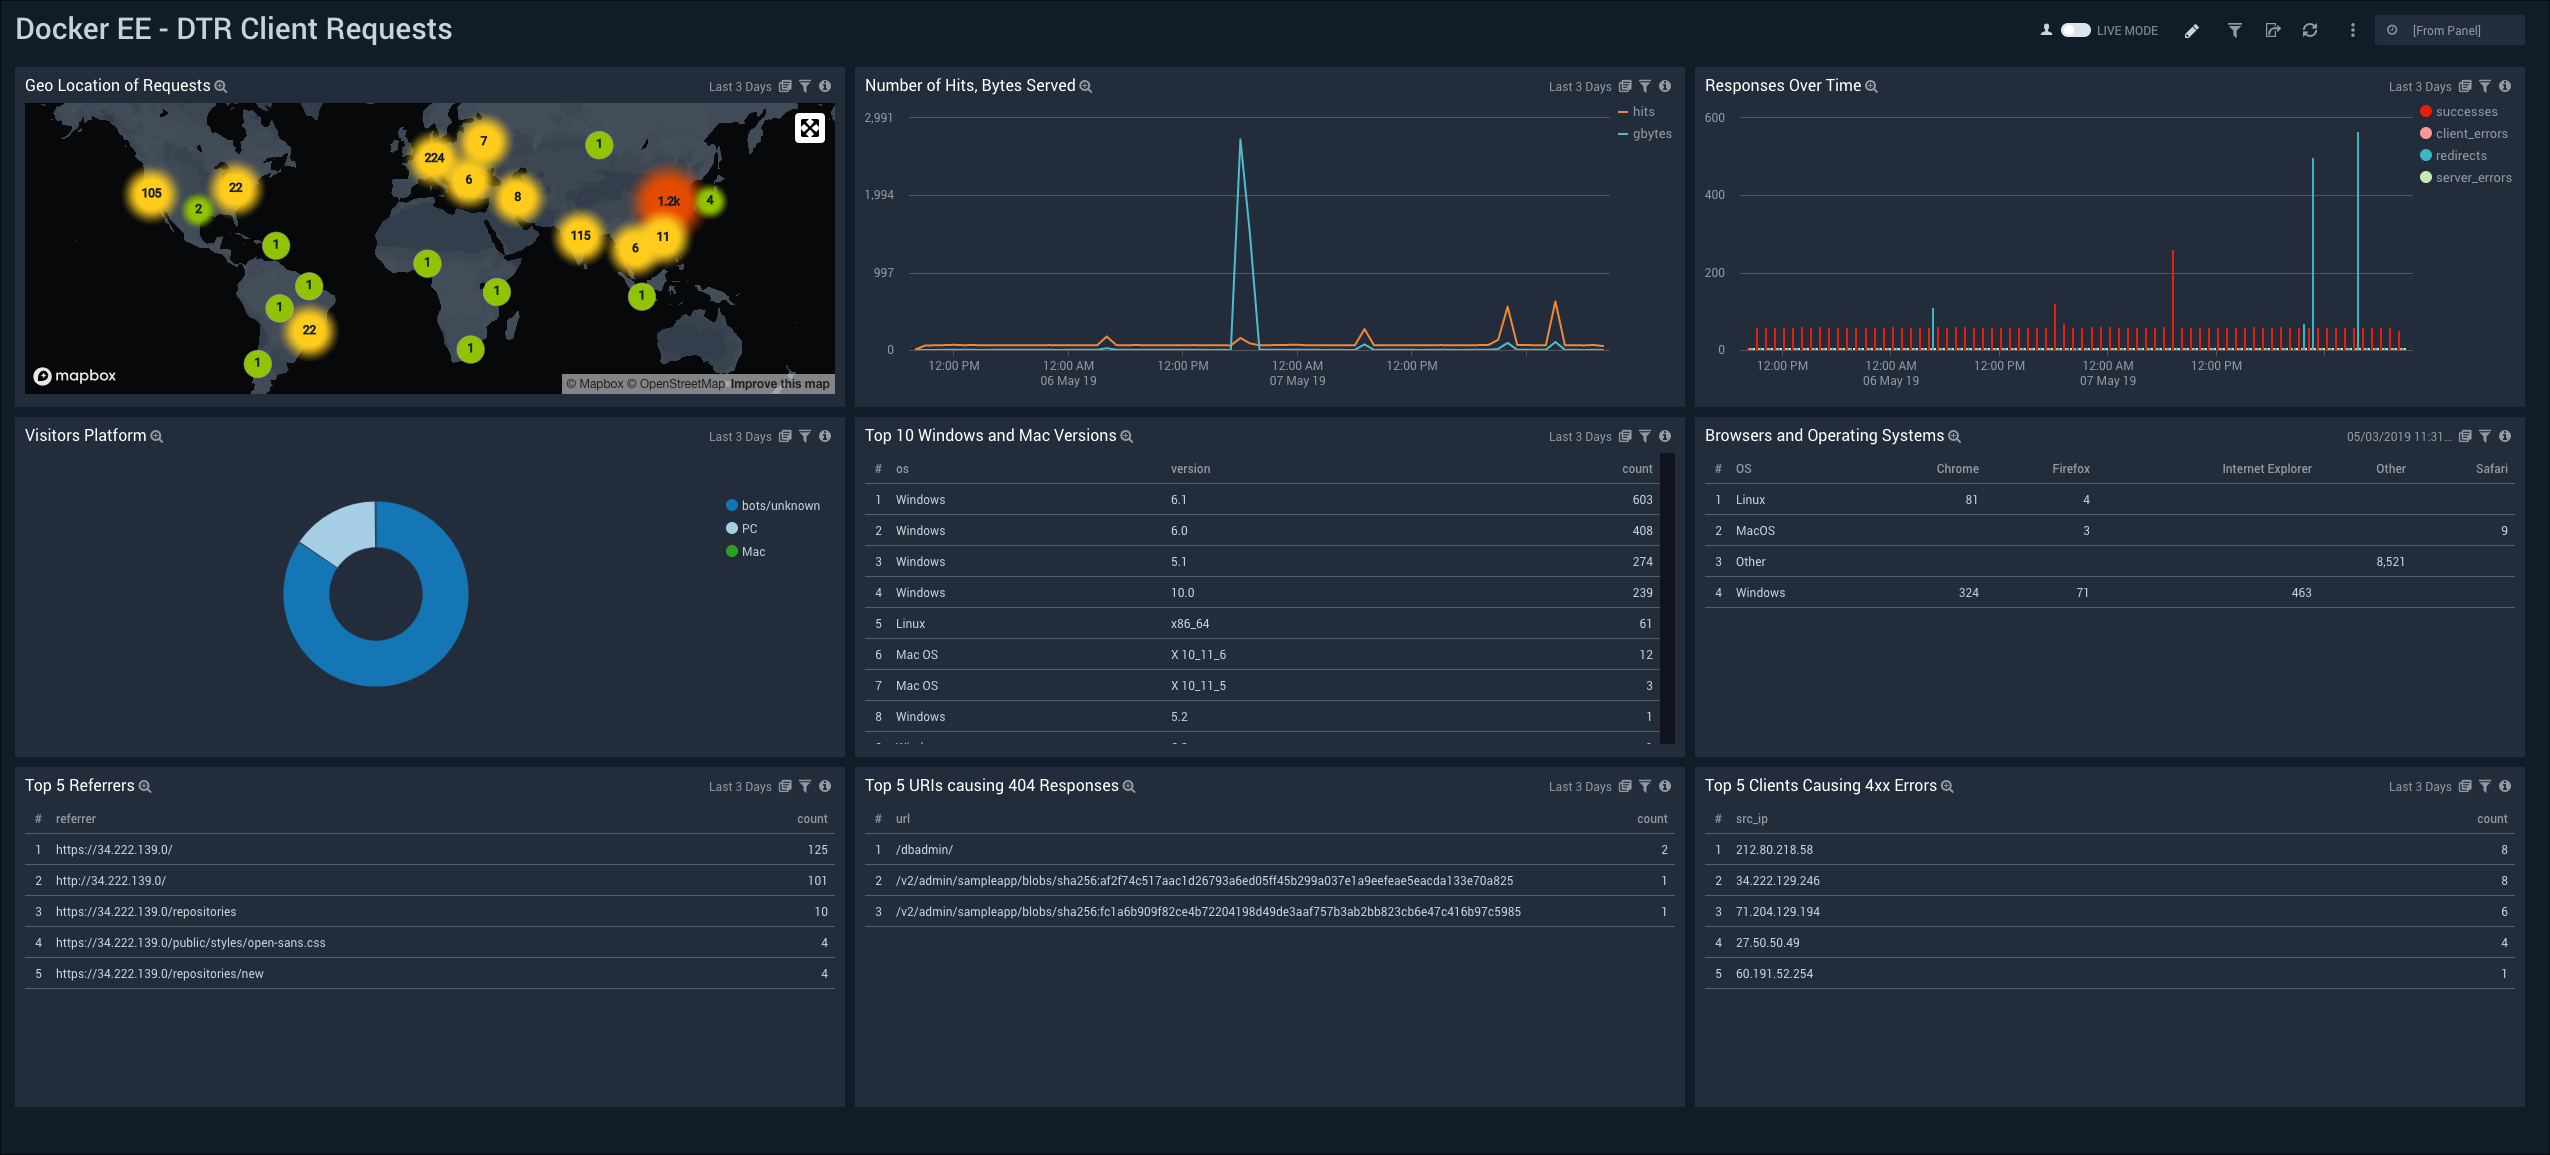
DTR Client Requests
The Docker EE - DTR Client Requests Dashboard provides a high-level view of client geographic locations, the number of hits and bytes served, response trends, and the platforms used by visitors. The panels also provide detailed information on browsers and operating systems (OSs), top versions for Windows and Mac, top referrers, top URIs causing errors, and top clients causing errors.
Use this dashboard to:
- Monitor the incoming requests to Docker Trusted Registry (DTR).
- Analyze incoming client requests by different dimensions such as geographic location, bytes served, request referrers, and client IPs.
DTR Registry
The Docker EE - DTR Registry Dashboard provides a high-level and detailed views of images pushed and pulled by repository and their geographic locations. Docker Trusted Registry (DTR) is an image storage solution that is installed behind a firewall to securely store and manage the Docker images in applications.
Use this dashboard to:
- Monitor Images pushed and pulledMonitor geographic locations of incoming push and pull requests
Host and Container Troubleshooting
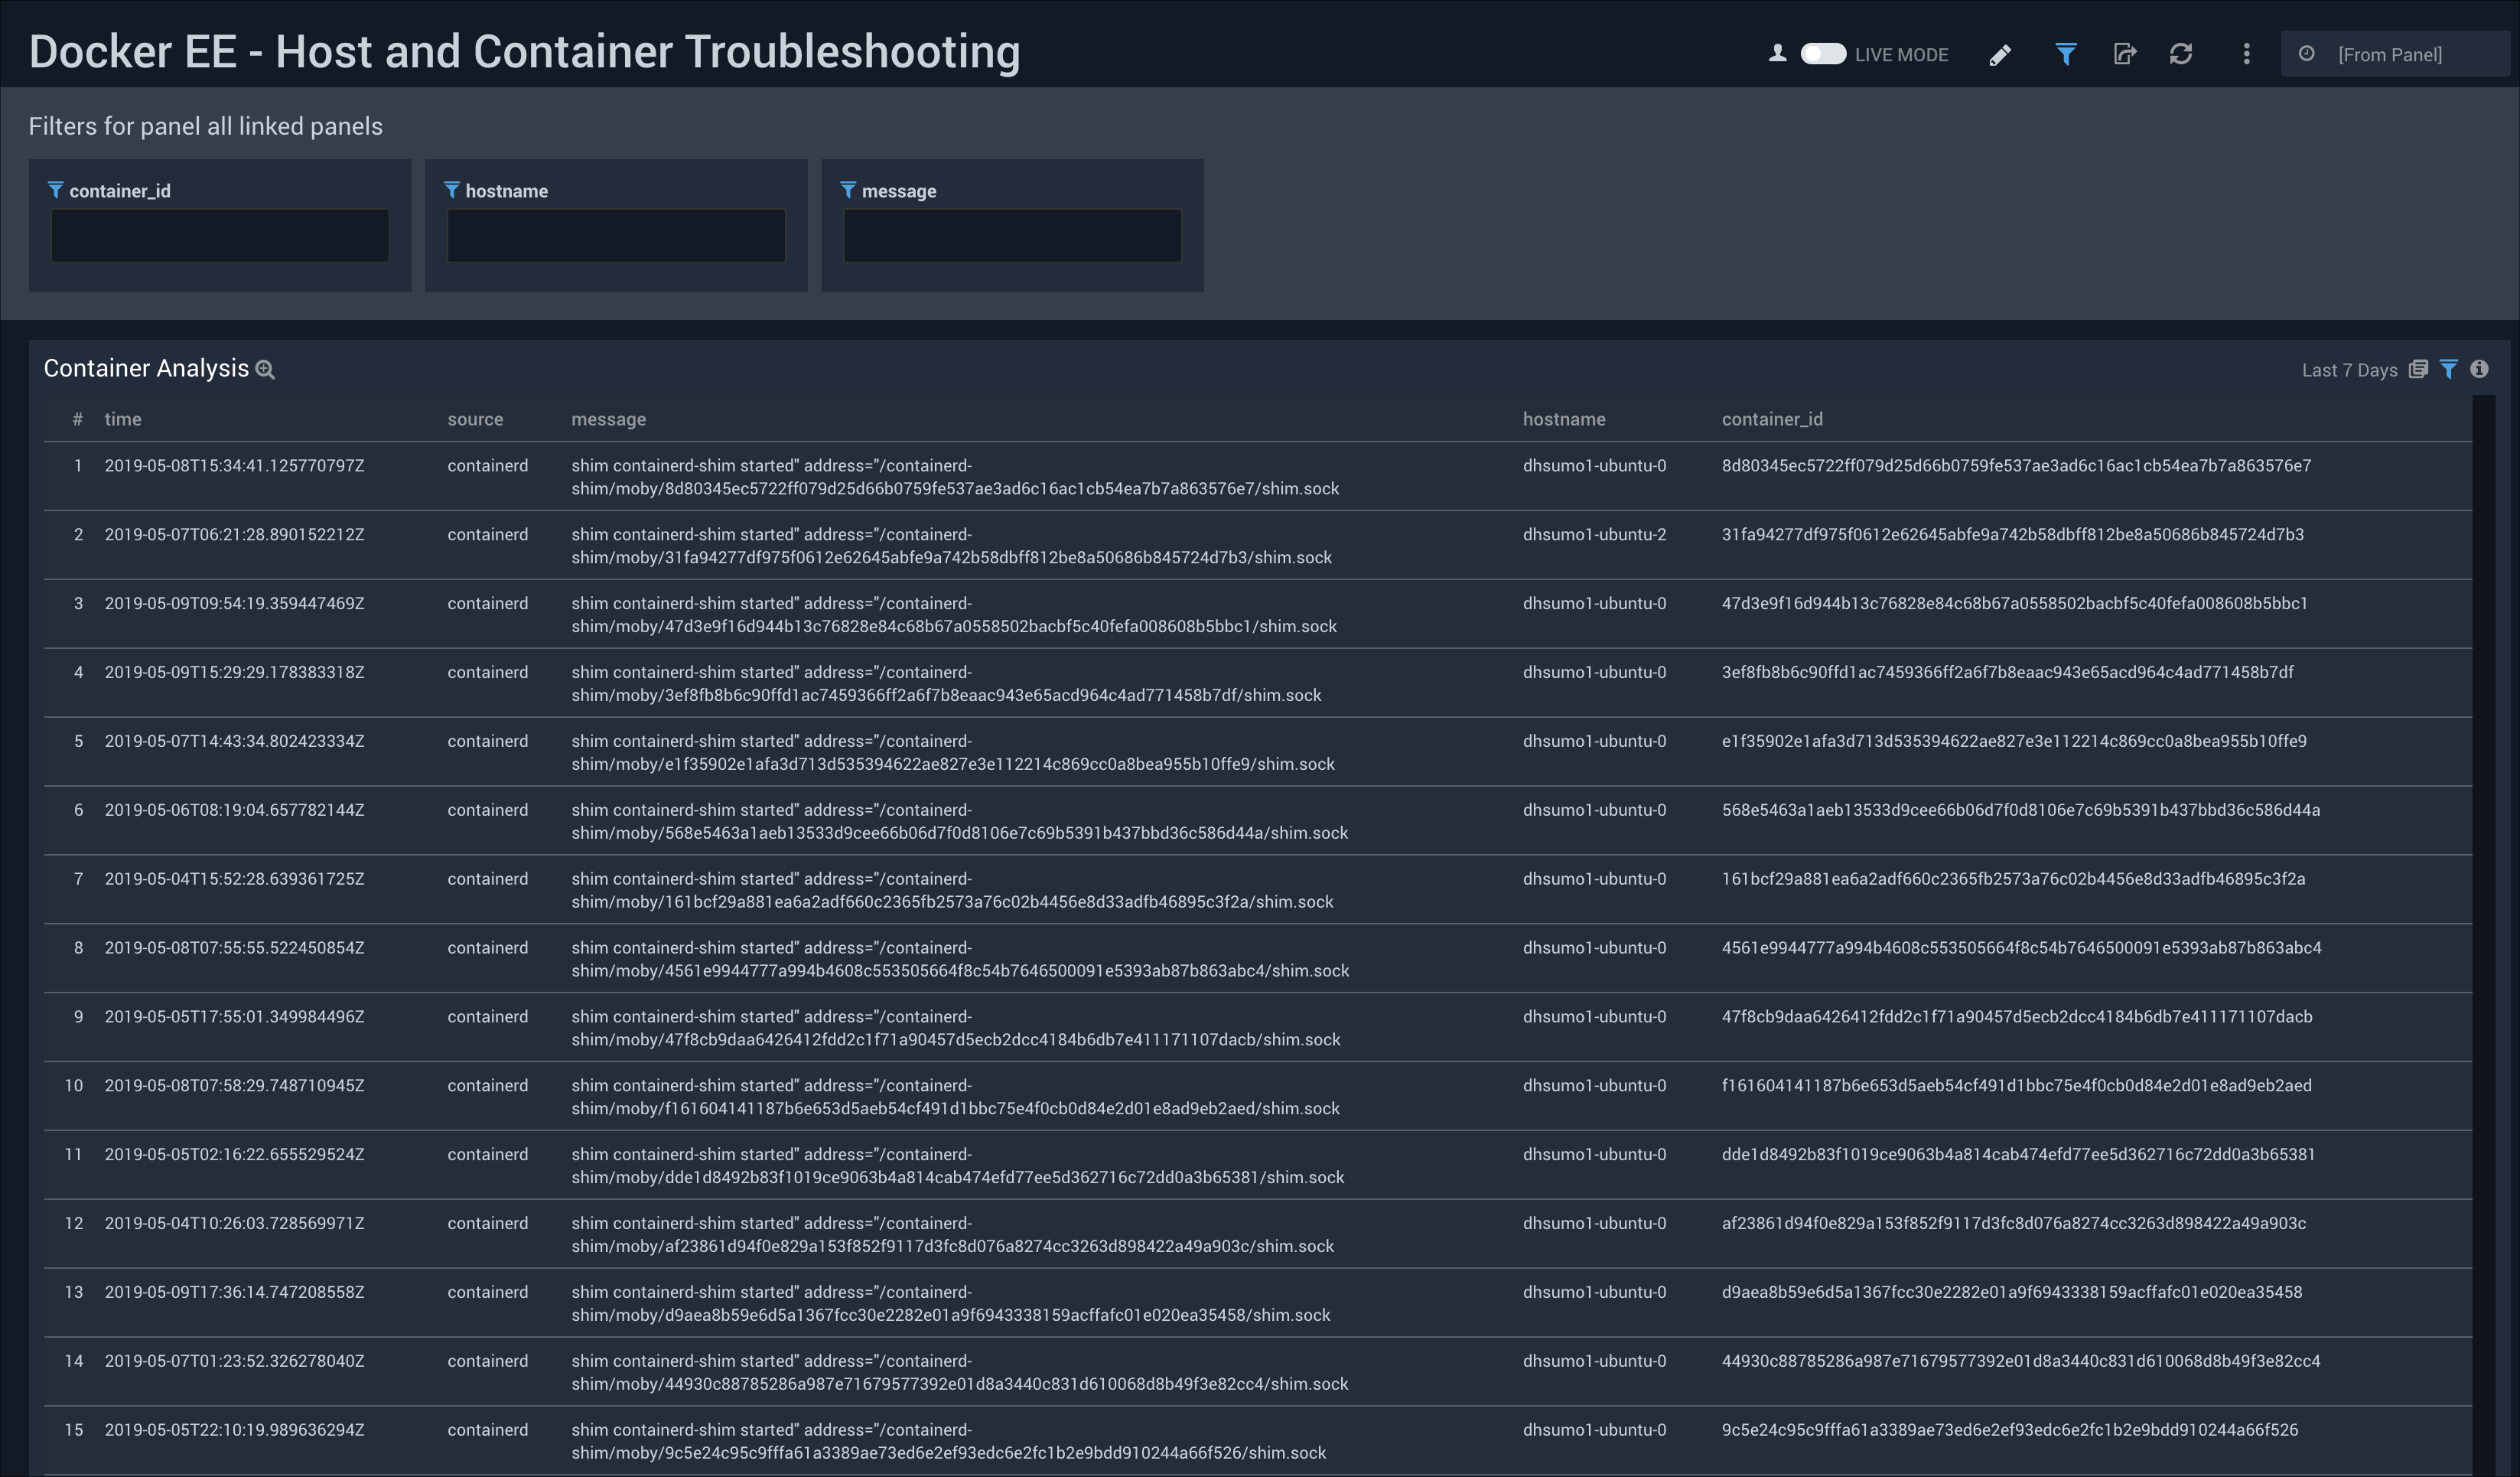
The Docker EE - Host and Container Troubleshooting Dashboard provides container analysis information that is helpful when troubleshooting a problem, including timestamp, source, message, hostname, and container ID.
Use this dashboard to:
- Troubleshoot whether applications running within containers are associated with errors on the Docker EE Platform.
- Analyze container activities and events across “dockerd” and “containerd” logs.
- Use the in-built dashboards filter to enter in any container ID or hostname, and find all related logs for that particular container or host.