Troubleshoot Dashboards
This guide provides an overview of product features and related technologies. In addition, it contains recommendations on best practices, tutorials for getting started, and troubleshooting information for common situations.
Copy and paste text from a Dashboard to open a search in a new window
The best way to select the text from a dashboard panel is to first "Zoom In" on the panel. To do this, hover over the title bar and then select the magnifying glass, the Zoom icon, that appears next to the name of the panel.
![]()
This opens the Panel into a larger view, and from this larger view, you can select text without the chance of a click opening the search.
Dashboard Error - No Data to Display
Live Mode
Depending on the time range of a dashboard data panel, it can take time for a panel to display the complete results. When you click the toggle to go into Live Mode, the panels start displaying live data going forward, while also backfilling with data for the specified time period. When the dashboard is completely backfilled, the percentage indicator changes to a green dot.
If you see the Dashboard error "No Data to Display," this issue is usually due to a time zone configuration error in your source configuration(s) or a timestamp problem in your logs.
Sumo Logic applies UTC as the time zone if the time zones in your messages if:
- Time zones are not parsed automatically.
- A time zone is missing in your messages.
- A time zone value is missing.
- The source is not configured with a default time zone.
This results in "parsed time" showing as either hours in the future or hours behind the actual message time in the logs. This affects how panels interpret these messages. (Find more information on common time parsing problems see Timestamps, Time Zones, Time Ranges, and Date Formats.)
Panels are active queries that only query data as it is being received into the system prior to messages being indexed, and they only look for messages with a parsed timestamp 10 minutes forward in time or within the window of the current panel time. As messages are received the panel determines if the messages are between X hours/minutes ago to 10 minutes from now:
- If yes, then the message gets added to the panel.
- If no, it is excluded.
If your message times are in PST, but Sumo Logic interprets them as UTC, then the panels will skip the messages as not being current. For example, if the current time is 17:00 UTC, and the log messages coming in have a timestamp of 10:00 (PT), and the service parsed them as 10:00 (UTC) due to a time zone configuration error, then the panel will not show these messages because the parsed time is 7 hours behind the current time and may be outside the current panel window.
Interactive Mode
Interactive mode is different because it queries the log messages after processing and indexing, and finds messages that have a parsed timestamp that falls within the selected time range, regardless of when they were received by the service. With an interactive search, a message that was received 7 hours before the parsed message is still found by the current query.
The easiest way to check if a timestamp parsing problem or delayed ingest could be causing this problem is to compare the parsed time "Time" field to the time the service received the message. On the panel showing no data, click the Panel or click the Show in Search button to open the query in the Search tab.
When you open the query on the Search page, Sumo Logic provides an option just under the time range selector called Use Receipt Time. Run the query with this option checked.
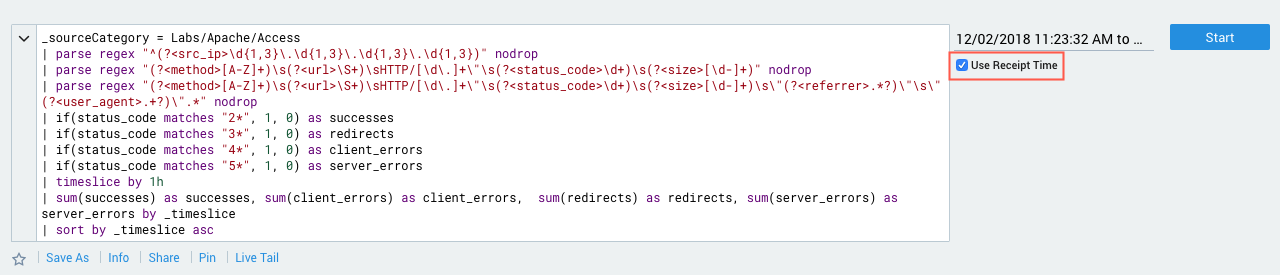
With this option, you can search by the time Sumo Logic received the messages (or the receipt time in Sumo Logic) instead of the time parsed from the logs. This option displays both the parsed time as well as the receipt time, so you can compare the values. If you see hours of difference between these values, then you probably have a time parsing problem and may need to update your Source configurations, especially the Source or Collector level setting for Use time zone from log file. If none is present use:. The most common issue is that this setting defaults to UTC, when your Source log messages may be generated in a different time zone.
Query to Check Offset of Receipt Time and Message Time
The following query can be run within your account and will display a count of Collectors, Sources, and sourceNames that have a receipt time and parsed message time which are greater than 1 hour. This query should be run over a very small time range with the Use Receipt Time option for the query selected. This query can identify the Sources and sourceNames that could be susceptible to the "No data to display" error in a Dashboard Panel.
* | _receipttime - _messagetime as difference
| difference/1000/60 as diff_minutes
| where diff_minutes < -60 or diff_minutes > 60
| count by _collector, _source, _sourceName
Sorry there was a problem opening the Dashboard
There is a known issue where the Sumo Logic Dashboards sometimes fail to load, and instead, display the message, "Sorry there was a problem opening the Dashboard."
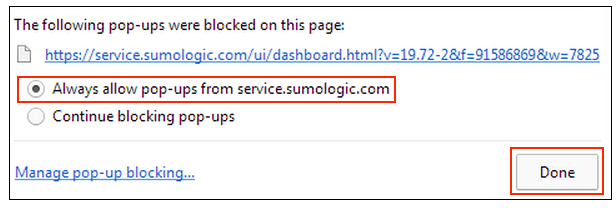
This issue occurs only with the Chrome web browser, when the popup blocker is being displayed in the browser address bar.
To work around this problem of opening the dashboards, in the web browser that you use, you must allow popup windows from Sumo Logic so that the Dashboards open, as shown below:
Why can't I edit a Dashboard?
When you create a Dashboard and publish it or install an App, you are the owner of the Dashboard, so you have the ability to edit or adjust it at any time. But If you're using a Dashboard that is published by someone else in your organization, you won't see the Edit toggle on the Dashboard page, and you won't have the ability to edit it directly.
To workaround this issue, you can always make a copy of the Dashboard from the Library. Then you can edit the copy as you like, because you own the copy. For instructions, see Copy Content in the Library.
Why can't I view a search from a Dashboard?
There are several reasons why you may not be able to open a search from a Dashboard.
- If you don't own a Dashboard, you may not be able to open a search query from a Dashboard by using Show in Search.
- Or it may be that the original Dashboard Link has been changed to drill down to another Dashboard, instead of showing the query in the Search page. How would you know? This can be confusing when you just want to view the query and the messages it returns in the Search page.
To workaround these issues, you can always make a copy of the Dashboard from the Library. Then you can edit the copy as you like, because you own the copy. For instructions, see Copy Contents in the Library.