About Dashboards
Dashboards are a powerful forensic tool to create searches and view search results based on data available through a search.
- If you’re having problems with your systems or network, you can easily move backward in time to pinpoint exactly when the problems occurred, and analyze additional search results to uncover the root cause.
- Reports and long-term trend analysis provide historical context and are useful in any situations in which live data isn’t as relevant as historical data.
- Dashboards populate completely every time you launch them and backfill data as needed. This means there will be a delay before you see all the data. If you change a time range, the data panels will rerun the search.
- In Live Mode, dashboards provide a real-time view of your system, continually updating as data comes in.
Dashboards contain a collection of panels:
- Data Panels provide a graphical representation in the form of a chart of your organization's data.
- Text and Title Panels allow you to add context to the data in the dashboard.
To create a data panel, you first run a search query. From the resulting data in the search page's Aggregates tab, you can display that data using different types of charts, then save those charts to a panel in a dashboard.
The information you save in a dashboard provides insight into the current state of the data you're uploading to Sumo Logic. Instead of having to run a number of queries, Sumo Logic runs these searches automatically, making sure that you're never looking at stale data. You won't have to remember to run important searches once you save them to dashboards—you'll be able to spend your time gaining insight into what's happening in your organization.
For more information, see the following topics:
- Adding Text and Title Panels
- Get Started with Dashboards and Panels
- Share Dashboards Inside and Outside Your Organization
Live mode
From a dashboard, you can click the toggle to go into Live Mode.
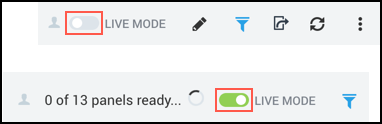
In Live Mode, dashboards provide a real-time view of your system, continually updating as data comes in. When you click the toggle to go into Live Mode, the panels start displaying live data going forward, while they also backfill with data for the specified time period. When the dashboard is completely backfilled, the percentage indicator changes to a green dot.
Live Mode is the ideal way to share screens for network operations centers, Operations, Developers, and so on.
To display Live Mode when a dashboard first opens, you can include mode=live in the URL (for example, https://example-www.sumologic.net/ui...&t=r&mode=live). This option won't work if the dashboard has panels with absolute or literal time ranges, but in that case, you will still be able to toggle to Live Mode.
Live Mode supports filters and relative time range changes. But keep in mind that if you start Live Mode with new settings, the dashboard will take some time to load, depending on the time range and amount of data being queried. You can close the browser when backfill is still in progress (not 100% yet). Backfill continues to run until complete.
Note that in Live Mode, Sumo will not render a panel that has more than 1440 groups. For more information, see Live Mode panel limitations below.
For free accounts, Live Mode will disable automatically if not viewed for seven days. For other accounts, Live Mode will disable automatically if not viewed for 30 days. If disabled, click the Live Mode toggle to reopen Live Mode.
Interactive mode
When you toggle a dashboard's Live Mode icon off, the dashboard enters interactive mode. In interactive mode, the dashboard is not updated with new data. You must put a dashboard in interactive mode to edit the dashboard and to change time range and filter settings.
Dashboard uses
The uses for dashboards are nearly endless. Perhaps your IT security group wants to keep an eye on who is installing virtual machines. Save the query you run as a panel in a dashboard, and watch for spikes in a line graph. Dashboards bring additional assurance, knowing that unusual activity will be displayed real time in an easy-to-digest graphical format. The data that matters the most to you is even easier to track.
When you install Sumo Logic apps, they display information about your environment using pre-configured search queries, panels, and dashboards. They're also a great example of use cases for creating your own dashboards.
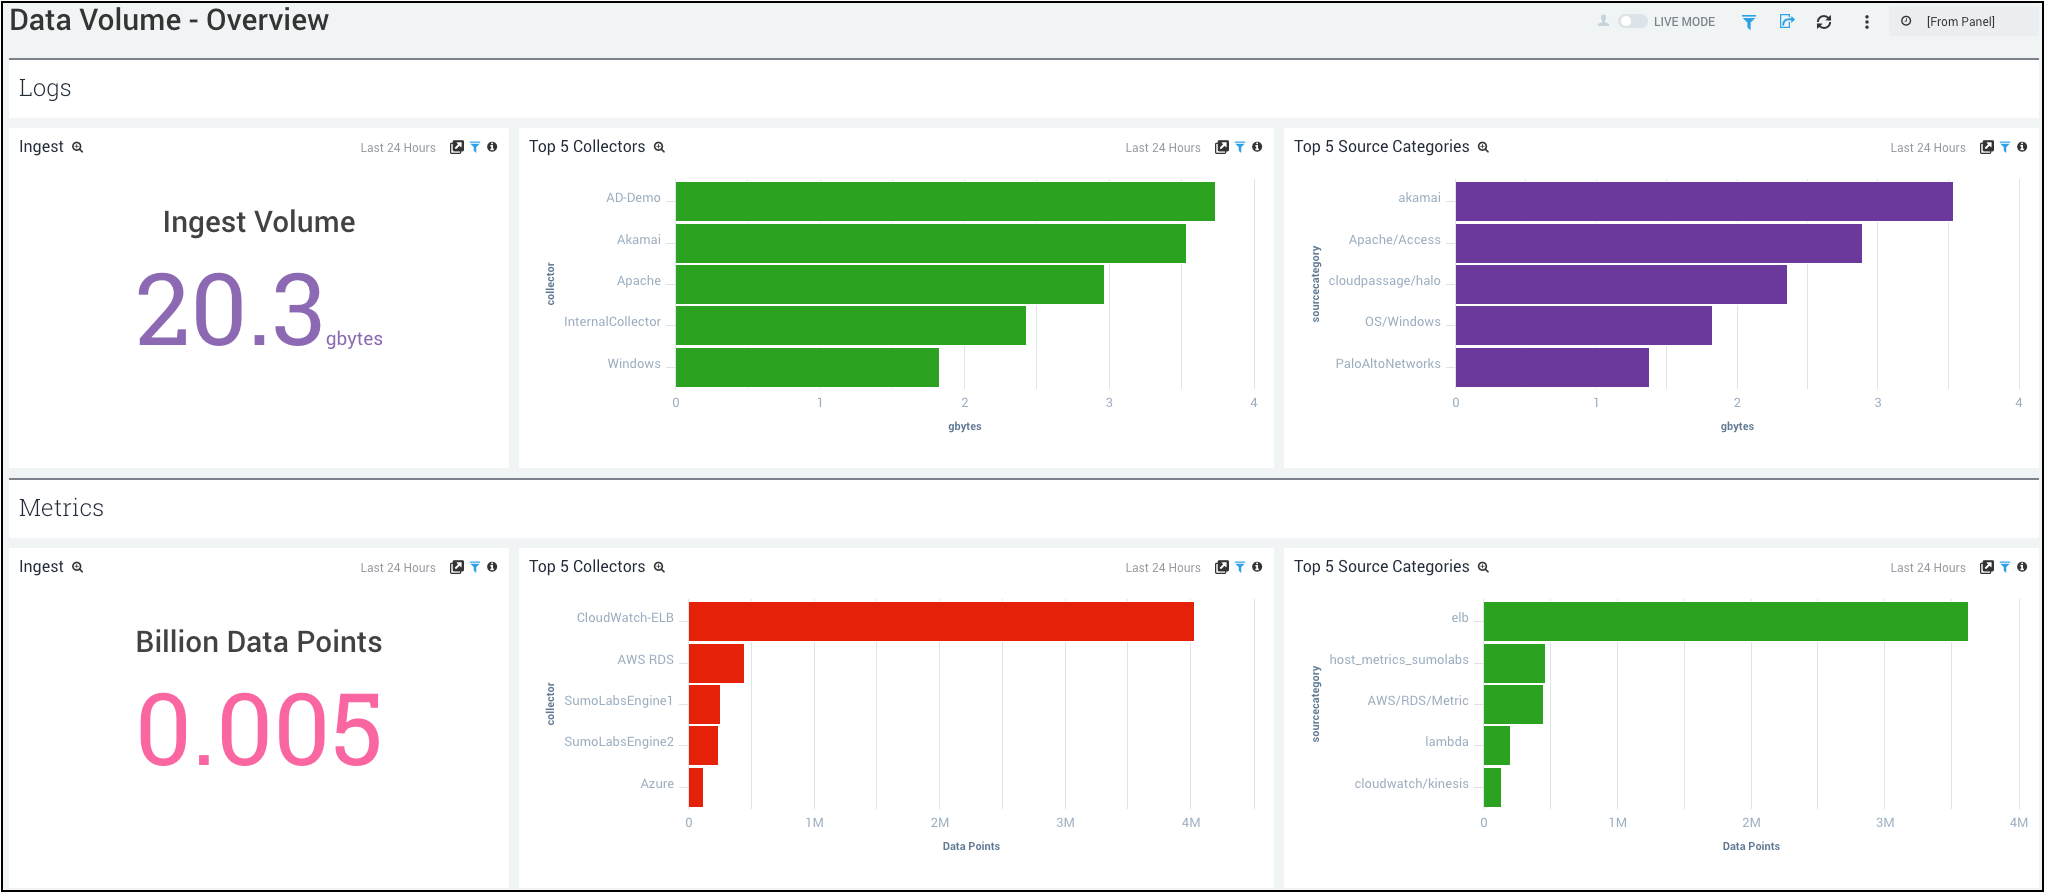
For example, in the Sumo Logic Data Volume App, the panels in the Overview dashboard provide information on the ingest, top five collectors and source categories being used in the last 24 hours, by logs and metrics.
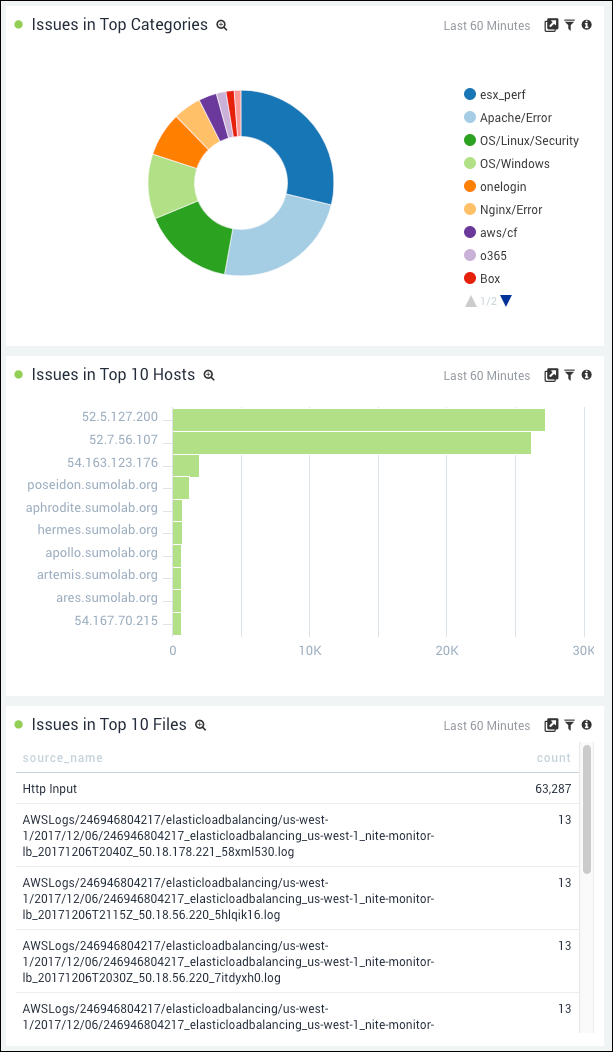
The Sumo Logic Log Analysis QuickStart App, in the Keywords and Metadata dashboard, you instantly see any issues that are appearing in your top source categories, source hosts, and in the top 10 files.
Once you have installed an app, you can view the pre-configured search queries that power the dashboards by launching a search from a panel.
For an extended use case example, see the Sumo Logic DevOps blog, "Building Software Release Cycle Health Dashboards in Sumo Logic."
Accessing Dashboards
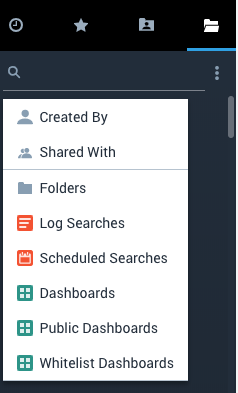
If you want to limit your search to all the available dashboards, you can access available dashboards from the Library tab. You can specifically call out Public and Whitelist dashboards:
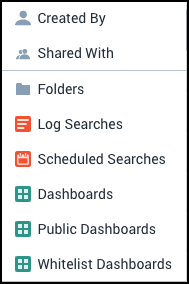
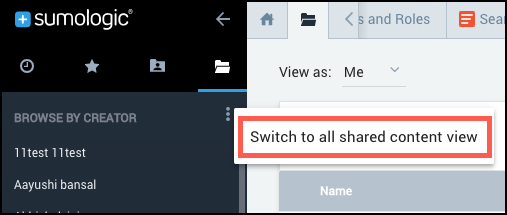
You can also do this from the left nav, but you have to switch into the all shared content view.
Then you will be able to search by the dashboard type:
What else do I need to know before I get started?
Here are a few things to keep in mind about dashboards.
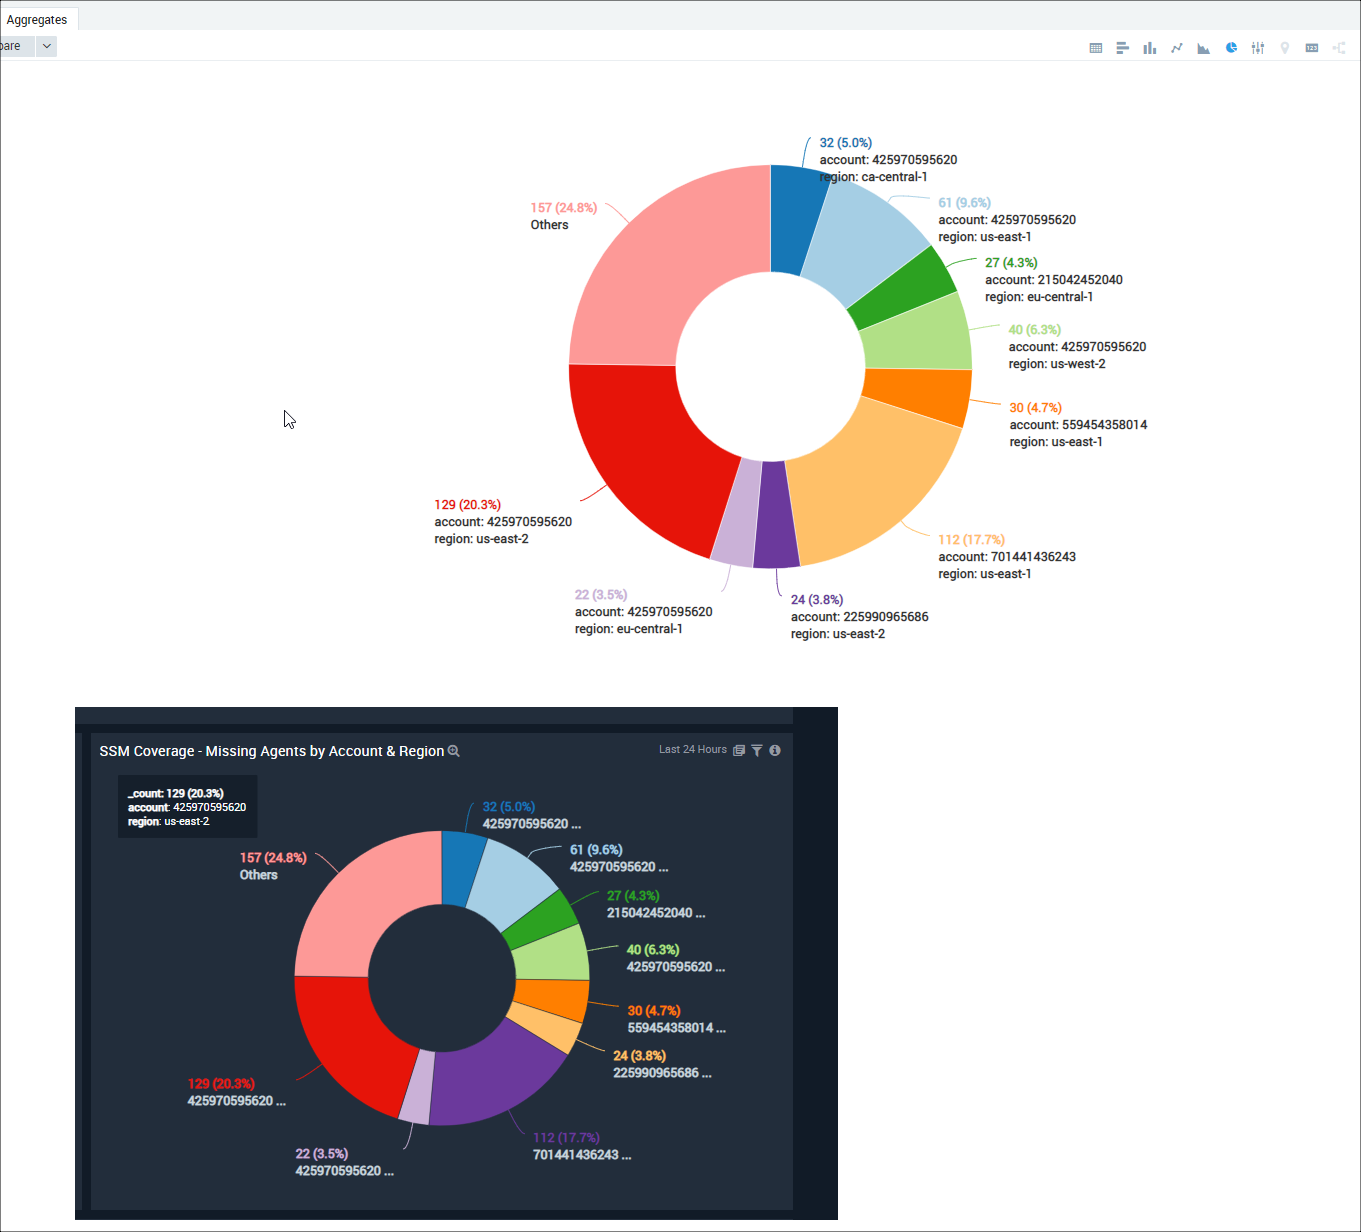
Pie chart labels on dashboards are meant to be single line
Pie chart labels on dashboard panels are intended to be a single line, due to the size of the display area. Pie chart labels are shown in multiple lines in the larger display area of a Search page. The comparison of single line and multi line Pie chart labels is illustrated in the following example.
Dashboards can be published and shared to leverage the data you've analyzed.
You've saved panels in a dashboard, and you'd like to enlighten others in your organization. Just publish the dashboard to allow everyone to see what you've uncovered through your analysis.
You can also share a dashboard from the Dashboards page.
Dashboards are built to your specifications.
As long as you run a search with aggregate results, you can save that search in a dashboard as a panel. For example, you could create a dashboard filled with performance-based searches, and another to track session length or other unique searches. Whatever makes sense for you and your organization—create a dashboard and you're set.
Dashboards require queries that have aggregate results.
Only searches that produce aggregate results can be saved as panels. What does that mean? Basically, to produce aggregate results, your query will contain a grouping function. This allows the data to be displayed properly in a graphical format.
Dashboards can't support all queries.
Because they are resource heavy, parsing libraries are not supported in dashboards.
Also, certain operators cannot be used in dashboard panels. A list of unsupported operators can be found in Restricted Operators.
Live Mode panel limitations
If you have a dashboard that contains a panel that has more than 1440 groups, if you switch to Live Mode a yellow warning icon will appear in the upper right corner of the panel. When you click the icon, this message appears:
Unable to include all results. Please edit your search to produce fewer results.
Dashboard Timezones
Dashboards use the Default Timezone setting found on the Preferences page. The dashboard's timezone cannot be edited once it is created.
Sumo Logic free accounts
Dashboards in Sumo Logic free accounts work the same way as those in enterprise accounts with one limitation: organizations with Sumo Logic free accounts have access to 20 Panels, shared between the three users in the account. You can decide to build as many dashboards as you'd like with the available panels in your account.
When you publish a dashboard, it's made available to all the users in the account. However, because Sumo Logic free accounts run on seven day intervals, Dashboard panel queries may not use a time range longer than 7 days. For more information, see the Account Usage help pages.