SLO Use Cases
A developer responsible for a microservice wants to create dashboard panels that depict the trend of SLI and error budget in a proprietary microservice. The recipes below show how to recreate the panels in the pre-built SLO dashboard for various combinations of evaluation types (windows or request-based) and calendar versus rolling compliance periods. The resulting panels can be added to any dashboard.
Scenario 1
The following query computes hourly SLI and error budget trend for a window-based SLO:
_view=sumologic_slo_output sloId="<your-SLO-ID>"
| where [subquery: _view=sumologic_slo_output sloId="<your-SLO-ID>"
| max(sloVersion) as sloVersion | compose sloVersion]
| dedup by _messagetime
| timeslice 1h  // data granularity for this panel
| sum(goodCount) as goodWindows, sum(totalCount) as totalWindows by _timeslice
| totalWindows - goodWindows as badWindows
| sort by _timeslice asc
| accum(totalWindows) as totalWindowsSoFar
| accum(badWindows) as badWindowsSoFar
| 7 * 24 * 60 as totalWindowsInCompliance // total number of windows in the SLO. Each window is 1m in size and compliance period is 7d. Replace 7 by number of days in compliance period.
| 0.999 as slo // replace this by target/100 here
| 100 - 100 * badWindowsSoFar / totalWindowsInCompliance as sli
| 100* (sli - slo)/(100-slo) as error_budget_pct_remaining
| slo*100 as slo
| fields _timeslice, sli, error_budget_pct_remaining, slo
This query can recreate a panel similar to the one below without the Trend Forecast: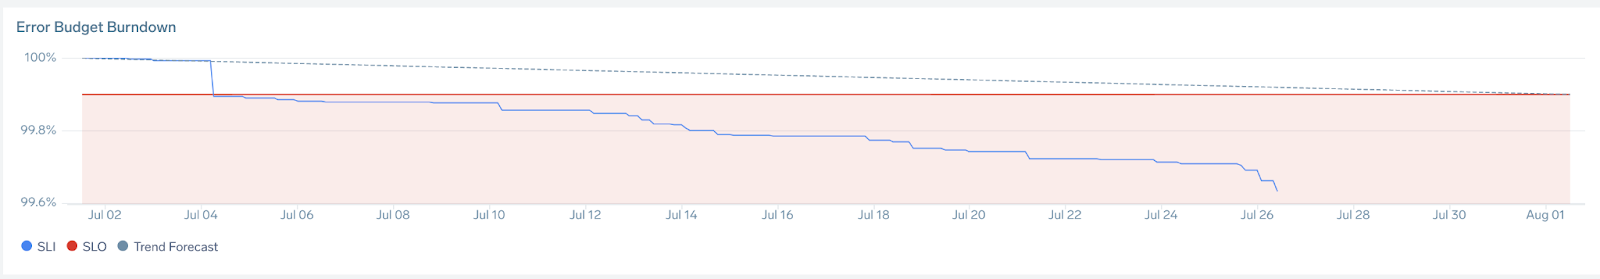
Adjust the chart by changing the “maximum value” to 100 and the “minimum value” to the lowest value you want to track using visualization settings under the line chart.
Scenario 2
The following query computes hourly SLI and error budget trend for a request-based SLO:
_view=sumologic_slo_output sloId="<your-SLO-ID>"
| where [subquery: _view=sumologic_slo_output sloId="<your-SLO-ID>"
| max(sloVersion) as sloVersion | compose sloVersion]
| dedup by _messagetime
| timeslice 1h  // data granularity for this panel
| sum(goodCount) as goodRequests, sum(totalCount) as totalRequests by _timeslice
| totalRequests - goodRequests as badRequests
| sort by _timeslice asc
| accum(totalRequests) as totalRequestsSoFar
| accum(badRequests) as badRequestsSoFar
| 0.99 as slo // replace this by target/100 here
| 100 - 100 * badRequestsSoFar / totalRequestsSoFar as sli
| 100* (sli - slo)/(100-slo) as error_budget_pct_remaining
| slo*100 as slo
| fields _timeslice, sli, error_budget_pct_remaining, slo
This query can recreate a panel similar to the one below without the Trend Forecast: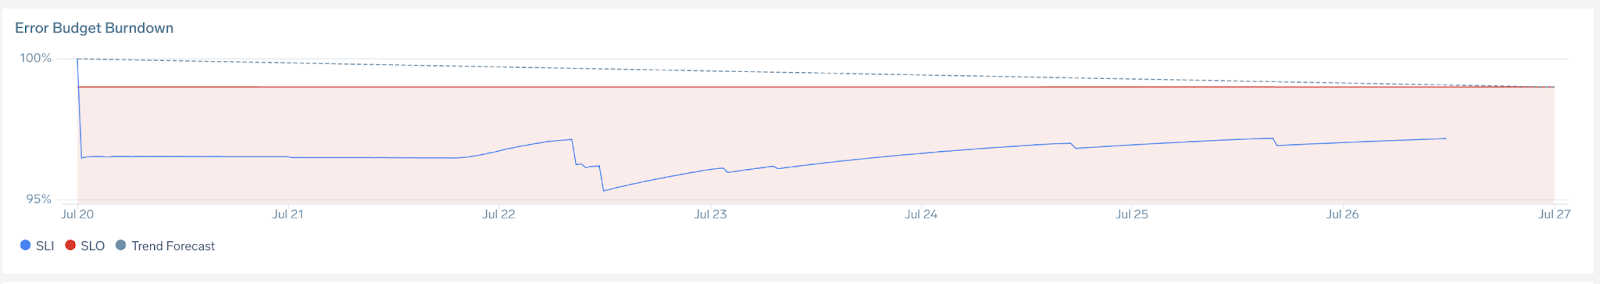
Adjust the chart by changing the “maximum value” to 100 and the “minimum value” to lowest value you want to track using visualization settings under the line chart.
Scenario 3
The following query computes SLI, Error Budget Remaining and Error Budget Remaining Minutes for a 30-day compliance and window-based SLO:
_view=sumologic_slo_output sloId="<your-SLO-ID>"
| where [subquery: _view=sumologic_slo_output sloId="<your-SLO-ID>"
| max(sloVersion) as sloVersion | compose sloVersion]
| dedup by _messagetime
| sum(goodCount) as goodCount, sum(totalCount) as totalCount
| goodCount*100/totalCount as sli
| 99.9 as target // replace the target here
| (sli - target)*100/(100 - target) as errorBudgetRemainingPercent
| errorBudgetRemainingPercent*30*86400*(100 - target)/100/100/60 as errorBudgetRemainingMins  // replace 30 by day count in your compliance period. Note that this is applicable for window based SLIs only
| goodCount - (totalCount*target/100) as errorBudgetRemainingRequests // applicable for request-based SLIs only
| if (errorBudgetRemainingPercent < 0, 0, errorBudgetRemainingPercent) as errorBudgetRemainingPercent
| fields -goodCount, totalCount
This query can recreate panels similar to the one below: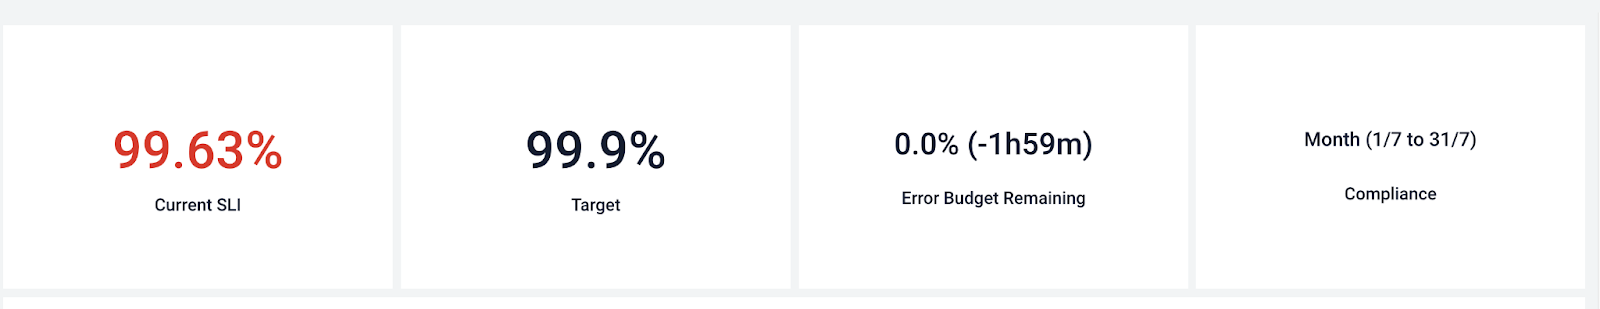
Scenario 4
The following query computes event history for an SLO:
_view=sumologic_slo_output sloId="<your-SLO-ID>"
| where [subquery: _view=sumologic_slo_output sloId="<your-SLO-ID>"
| max(sloVersion) as sloVersion | compose sloVersion]
| dedup by _messagetime
| timeslice 1h // granularity of data
| sum(goodCount) as goodCount, sum(totalCount) as totalCount by _timeslice
| goodCount*100/totalCount as successfulWindows // replace successfulWindows by successfulRequests and unsuccessfulWindows by unsuccessfulRequests (below) for request based SLO
| 100-successfulWindows as unsuccessfulWindows
| fields -goodCount, totalCount
This query can recreate panels similar to the one below: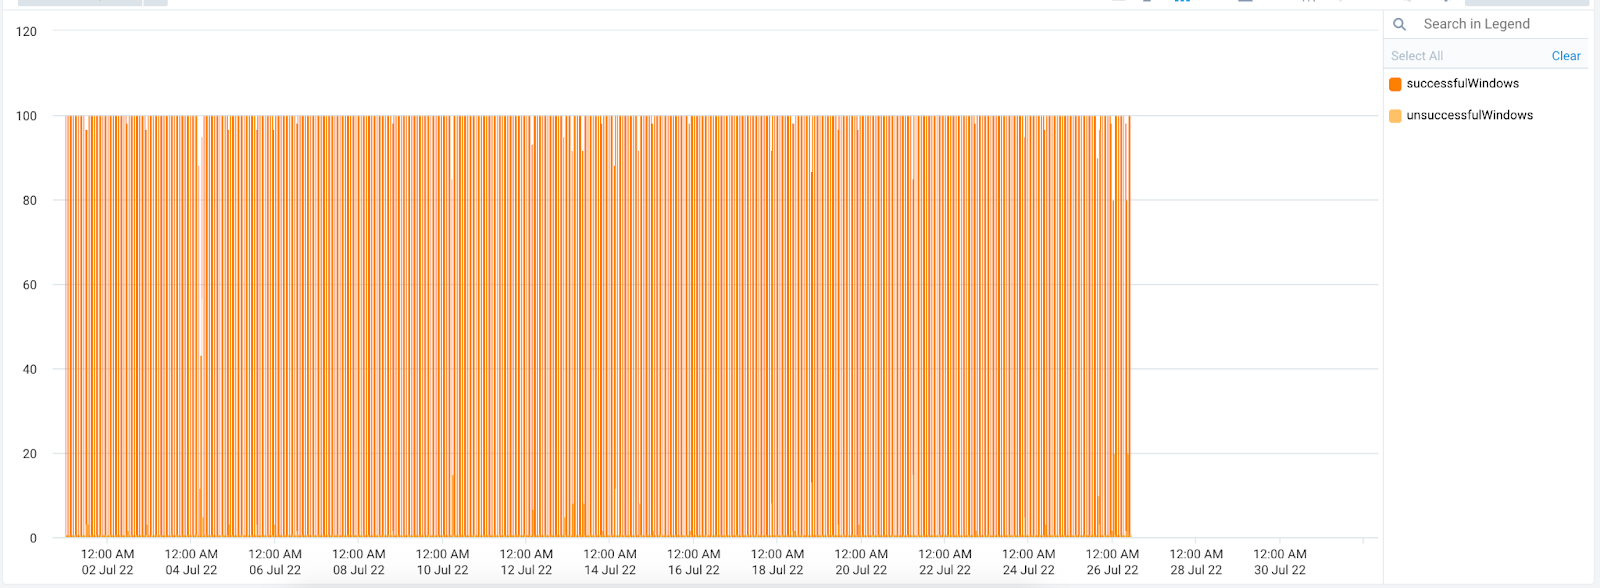
Adjust the chart by changing the “maximum value” to 100 and the “minimum value” to lowest value you want to track using visualization settings under line chart.
Scenario 5
The following query computes SLI trend over multiple 7d calendar compliance periods:
-- REQUEST-BASED, CALENDAR COMPLIANCE
-- Coffee Prep Latency should not exceed 1 second for 95% of requests in calendar 7d
-- This query works for both request based and window based SLOs
_view=sumologic_slo_output sloId="<your-SLO-ID>"
| where [subquery: _view=sumologic_slo_output sloId="<your-SLO-ID>"
| max(sloVersion) as sloVersion | compose sloVersion]
| dedup by _messagetime
| timeslice 7d // put compliance period here
| sum(goodCount) as goodRequests, sum(totalCount) as totalRequests by _timeslice
| totalRequests - goodRequests as badRequests
| sort by _timeslice asc
| accum(totalRequests) as cumTotalRequests
| accum(badRequests) as cumBadRequests
| 95 as slo // replace your target here
| 100 - 100 * cumBadRequests / cumTotalRequests as sli
| 100* (sli - slo)/(100-slo) as error_budget_pct_remaining
| fields _timeslice, sli, error_budget_pct_remaining, slo
This query replicates the following panel: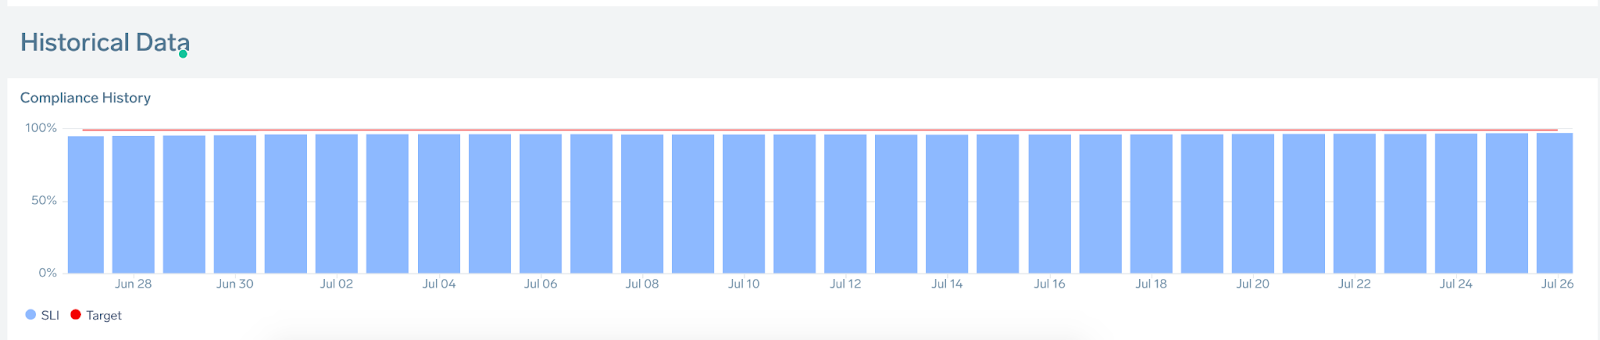
It is recommended to choose “change axis” -> set “maximum value” as 100.
To use this correctly, ensure the following:
- To render one compliance period, make sure that the time range of dashboard matches the compliance period
- To build a dashboard of compliance history over multiple compliance periods, change the
timesliceto match the compliance period and set the dashboard time range to multiple compliance periods
Dashboards built using such queries will show slightly different numbers from the pre-built dashboards due to differences in the storage backend for these two approaches. Use the pre-built dashboard if SLO precision is important.