Host and Process Metrics

The Sumo Logic App for Host and Process Metrics allows you to monitor the performance and resource utilization of hosts and processes that your mission critical applications are dependent upon. Preconfigured dashboards provide insight into CPU, memory, network, file descriptors, page faults, and TCP connectors. This app uses Telegraf, an open-source, plugin-based collector for the collection of both host and process metrics data.
This app uses Telegraf and associated input plugins to collect both host and process metrics. To use the installed collector to collect and analyze host metrics, please see the Host Metrics app.
This app has been validated on Linux(Ubuntu 20.04.2 LTS) and Windows (Microsoft Windows Server 2019) and higher using Telegraf 1.18.2. This app is not recommended in Kubernetes environments; instead please use the Kubernetes app.
Collecting Metrics for Host and Processes
We use the Telegraf agent for Host and Process metrics collection. Telegraf runs on the same system and uses the input plugins to obtain host and process metrics, and the Sumo Logic output plugin to send the metrics to Sumo Logic.
The following input plugins are used by Sumo Logic
For Linux:
For Windows:
Configuring Metrics Collection
This section provides instructions for configuring metrics collection for the Sumo Logic App for Host and Process metrics. Follow the below instructions to set up the metric collection for a given machine:
Configure a Hosted Collector
Configure an HTTP Logs and Metrics Source
Install Telegraf
Configure and start Telegraf
Configure a Hosted Collector
To create a new Sumo Logic hosted collector, perform the steps in the Configure a Hosted Collector section of the Sumo Logic documentation.
- Configure an HTTP Logs and Metrics Source
Create a new HTTP Logs and Metrics Source in the hosted collector created above by following these instructions. Suggestions for setting your source category:
For identifying a specific cluster or a group of hosts:
<clustername>/metricsFor identifying a group of hosts within a given deployment:
<environment name>/<clustername>/metricsMake a note of the HTTP Source URL and source category
- Install Telegraf
Use the following steps to install Telegraf on each host machine.
As part of collecting metrics data from Telegraf, we will use the input plugins (described earlier) to get data from Telegraf and the Sumo Logic output plugin to send data to Sumo Logic.
Create or modify telegraf.conf (in linux it’s located in /etc/telegraf/telegraf.d/ and on Windows, it’s located in C:\Program Files\InfluxData\Telegraf\). Copy and paste the inputs, outputs and processors section from one of the below files
for Linux - linux_sample_telegraf.conf
for Windows: windows_sample_telegraf.conf
Please enter values for the following parameters (marked with CHANGE_ME) in the downloaded file:
In the output plugins section which is
[[outputs.sumologic]]:URL - This is the HTTP source URL created in step 3. Please see this doc for more information on additional parameters for configuring the Sumo Logic Telegraf output plugin.
Here’s an explanation for additional values set by this Telegraf configuration that we request you to please do not modify these values as they will cause the Sumo Logic apps to not function correctly.
data_format = “carbon2” In the output plugins section which is
[[outputs.sumologic]]This indicates that metrics should be sent in the carbon2 format to Sumo LogicFor other optional parameters refer to the respective plugin documentation for configuring the input plugins for Telegraf.
For all other parameters, see [this doc](https://github.com/influxdata/telegraf/blob/master/docs/CONFIGURATION.md#agent) for more parameters that can be configured in the Telegraf agent globally.


Once you have finalized your `telegraf.conf` file, you can start or reload the telegraf service using instructions from the [doc](https://docs.influxdata.com/telegraf/v1.17/introduction/getting-started/#start-telegraf-service).

At this point, host and process metrics should start flowing into Sumo Logic.
Please see Telegraf’s Metric filtering capabilities to exclude metrics that you do not need from being sent to Sumo Logic.
Monitoring processes with certain pattern
exe: Selects the processes that have process names that match the string that you specify
pattern: Selects the processes that have command lines (including parameters and options used with the command) matching the specified string using regular expression matching rules.
For Linux
On Linux servers, the strings that you specify in an exe or pattern section are evaluated as regular expressions.
Example
For filtering executable name containing nginx (i.e., pgrep <exe>)
[[inputs.procstat]]
    pid_tag=false
    exe = "nginx"
For filtering command lines containing config (ie, pgrep -f <pattern>)
[[inputs.procstat]]
    pid_tag=false
        pattern = "config"
For Windows
On servers running Windows Server, these strings are evaluated as WMI queries. (Ex pattern: "%apache%"). For more information, see LIKE Operator.
Example
For filtering executable name containing nginx
[[inputs.procstat]]
    pid_finder = "native"
    pid_tag=false
    exe = "%nginx%"
For filtering command lines containing config
[[inputs.procstat]]
    pid_finder = "native"
    pid_tag=false
    pattern = "%config%"
For defining multiple patterns for multiple processes you can use the plugin multiple times
[[inputs.procstat]]
   pid_tag=false
   exe = "nginx"

[[inputs.procstat]]
   exe = "tomcat"
   pid_tag=false
Troubleshooting
- To identify the operating system version and name
- For Windows machines, run the command in Powershell to get the OS Version
[System.Environment]::OSVersion.Version
    (Get-WmiObject -class Win32_OperatingSystem).Caption
- For Linux run below command in terminal
uname -a
    lsb_release -a
- To enable debug logs, set
“debug = true”flag in telegraf.conf and run the command, it will output error in stdout
telegraf --config telegraf.conf --test
- If the telegraf conf changes are not reflecting make sure to restart Telegraf using the command
- Windows -
./telegraf.exe --service restart - Linux -
sudo service telegraf restart
- Windows -
- If certain metrics are not coming you may have to run the telegraf agent as root. Check the respective plugin documentation for more information.
Sample Queries
CPU Utilization by Host panel in Host Metrics - CPU Dashboard
host.name=* cpu=cpu-total metric=(host_cpu_usage_user OR host_cpu_usage_system OR host_cpu_usage_iowait OR host_cpu_usage_steal OR host_cpu_usage_softirq OR host_cpu_usage_irq OR host_cpu_usage_nice) | sum by host.name
CPU Usage panel in Process Metrics Details Dashboard
metric=procstat_cpu_usage host.name=* process.executable.name=* | avg by host.name, process.executable.name | outlier
Installing the Alerts
The next few sections provide instructions for installing the Sumo App and Alerts for hosts and processes, as well as the descriptions of each of the app dashboards. These instructions assume you have already set up a collection as described in Collecting Metrics for Host and Processes.
Sumo Logic has provided out-of-the-box alerts available through Sumo Logic monitors to help you monitor your hosts and processes. These alerts are built based on metrics and logs datasets and include preset thresholds based on industry best practices and recommendations.
For details on the individual alerts, see last section.
- To install these alerts, you need to have the Manage Monitors role capability.
- Alerts can be installed by either importing them a JSON or a Terraform script.
There are limits to how many alerts can be enabled - please see the Alerts FAQ for details.
Method A: Importing a JSON file
Download the JSON file describing all the monitors.
1. The JSON contains the alerts that are based on Sumo Logic searches that do not have any scope filters and therefore will be applicable to all hosts, the data for which has been collected via the instructions in the previous sections. However, if you would like to restrict these alerts to specific hosts or environments, update the JSON file by replacing the text **$$hostmetrics_data_source** with <your sourceCategory>.\ SourceCategory examples:
    1. For alerts applicable only to a specific cluster of hosts, your custom filter could be:  **<code>'_sourceCategory=yourclustername/metrics'</code>.</strong>
    2. For alerts applicable to all hosts that start with ec2hosts-prod, your custom filter could be: <strong><code>'_sourceCategory=ec2hosts-prod*/metrics'</code></strong>.
    3. For alerts applicable to a specific cluster within a production environment, your custom filter could be: <strong><code>'_sourceCategory=prod/yourclustername/metrics'</code></strong>
Go to Manage Data > Alerts > Monitors.
Click Add: \
Click Import to import monitors from the JSON above.
The monitors are disabled by default. Once you have installed the alerts using this method, navigate to the Host and Process Metrics folder under Monitors to configure them. See this document to enable monitors, to configure each monitor, to send notifications to teams or connections please see the instructions detailed in Alert Configuration of this document.
Method B: Using a Terraform script
Generate a Sumo Logic access key and ID
Generate an access key and access ID for a user that has the Manage Monitors role capability in Sumo Logic using these instructions. Please identify which deployment your Sumo Logic account is in, using this link.
Download and install Terraform 0.13 or later
Download the Sumo Logic Terraform package for Host and Process alerts
The alerts package is available in the Sumo Logic GitHub repository. You can either download it through the “git clone” command or as a zip file.
Alert Configuration
After the package has been extracted, navigate to the package directory terraform-sumologic-sumo-logic-monitor/monitor_packages/host_process_metrics/
Edit the host_and_processes.auto.tfvars file and add the Sumo Logic Access Key, Access Id, and Deployment from Generate a Sumo Logic access key and ID.
access_id   = "<SUMOLOGIC ACCESS ID>"
access_key  = "<SUMOLOGIC ACCESS KEY>"
environment = "<SUMOLOGIC DEPLOYMENT>"
Update the variable host_and_processes_data_source with your source category:
- SourceCategory examples:
- For alerts applicable only to a specific cluster of hosts, your custom filter could be:
_sourceCategory=yourclustername/metrics. - For alerts applicable to all hosts that start with ec2hosts-prod, your custom filter could be:
_sourceCategory=ec2hosts-prod*/metrics. - For alerts applicable to a specific cluster within a production environment, your custom filter could be:
_sourceCategory=prod/yourclustername/metrics.
- For alerts applicable only to a specific cluster of hosts, your custom filter could be:
All monitors are disabled by default on installation. If you would like to enable all the monitors, set the parameter monitors_disabled to false in this file.
By default, the monitors are configured in a monitor folder called “Host and “Process Metrics”, if you would like to change the name of the folder, update the monitor folder name in this file.
If you would like the alerts to send email or connection notifications, configure these in the file host_process_metrics_notifications.auto.tfvars. For configuration examples, refer to the next section.
Email and Connection Notification Configuration Examples
To configure notifications, modify the file host_process_metrics_notifications.auto.tfvars file and fill in the connection_notifications and email_notifications sections. See the examples for PagerDuty and email notifications below. See this document for creating payloads with other connection types.
connection_notifications = [
    {
      connection_type       = "PagerDuty",
      connection_id         = "<CONNECTION_ID>",
      payload_override      = "{\"service_key\": \"your_pagerduty_api_integration_key\",\"event_type\": \"trigger\",\"description\": \"Alert: Triggered {{TriggerType}} for Monitor {{Name}}\",\"client\": \"Sumo Logic\",\"client_url\": \"{{QueryUrl}}\"}",
      run_for_trigger_types = ["Critical", "ResolvedCritical"]
    },
    {
      connection_type       = "Webhook",
      connection_id         = "<CONNECTION_ID>",
      payload_override      = "",
      run_for_trigger_types = ["Critical", "ResolvedCritical"]
    }
  ]
Replace <CONNECTION_ID> with the connection id of the webhook connection. The webhook connection id can be retrieved by calling the Monitors API.
email_notifications = [
    {
      connection_type       = "Email",
      recipients            = ["abc@example.com"],
      subject               = "Monitor Alert: {{TriggerType}} on {{Name}}",
      time_zone             = "PST",
      message_body          = "Triggered {{TriggerType}} Alert on {{Name}}: {{QueryURL}}",
      run_for_trigger_types = ["Critical", "ResolvedCritical"]
    }
  ]
Install the Alerts
- Navigate to the package directory
terraform-sumologic-sumo-logic-monitor/monitor_packages/host_process_metrics/and run terraform init. This will initialize Terraform and will download the required components. - Run terraform plan to view the monitors which will be created/modified by Terraform.
- Run terraform apply.
Post Installation
If you haven’t enabled alerts or configured notifications through the Terraform procedure outlined above, we highly recommend enabling alerts of interest and configuring each enabled alert to send notifications to other people or services. This is detailed in Step 4 of this document.
Installing the Host and Process Metrics App
This section demonstrates how to install the Host and Process Metrics App.
Now that you have set up a log and metric collection for the Host and Process Metrics App, you can install the Sumo Logic App for Host and Processes to use the pre-configured searches and dashboards.
To install the app, do the following:
Locate and install the app you need from the App Catalog. If you want to see a preview of the dashboards included with the app before installing, click Preview Dashboards.
- From the App Catalog, search for and select the app.
- Select the version of the service you're using and click Add to Library.
7 Version selection is applicable only to a few apps currently. For more information, see the Install the Apps from the Library. 3. To install the app, complete the following fields.
1. **App Name.** You can retain the existing name, or enter a name of your choice for the app.

2. **Data Source.** Select either of these options for the data source.
- Choose Source Category, and select a source category from the list.
- Choose Enter a Custom Data Filter, and enter a custom source category beginning with an underscore. Example: (
_sourceCategory=MyCategory).
- Choose Enter a Custom Data Filter, and enter a custom source category beginning with an underscore. Example: (
- Advanced. Select the Location in Library (the default is the Personal folder in the library), or click New Folder to add a new folder.
- Click Add to Library.
Once an app is installed, it will appear in your Personal folder, or another folder that you specified. From here, you can share it with your organization.
Panels will start to fill automatically. It's important to note that each panel slowly fills with data matching the time range query and received since the panel was created. Results won't immediately be available, but with a bit of time, you'll see full graphs and maps.
Viewing Host and Process Metrics Dashboards
Template variables provide dynamic dashboards that can rescope data on the fly. As you apply variables to troubleshoot through your dashboard, you view dynamic changes to the data for a quicker resolution to the root cause. You can use template variables to drill down and examine the data on a granular level. For more information, see Filter with template variables.
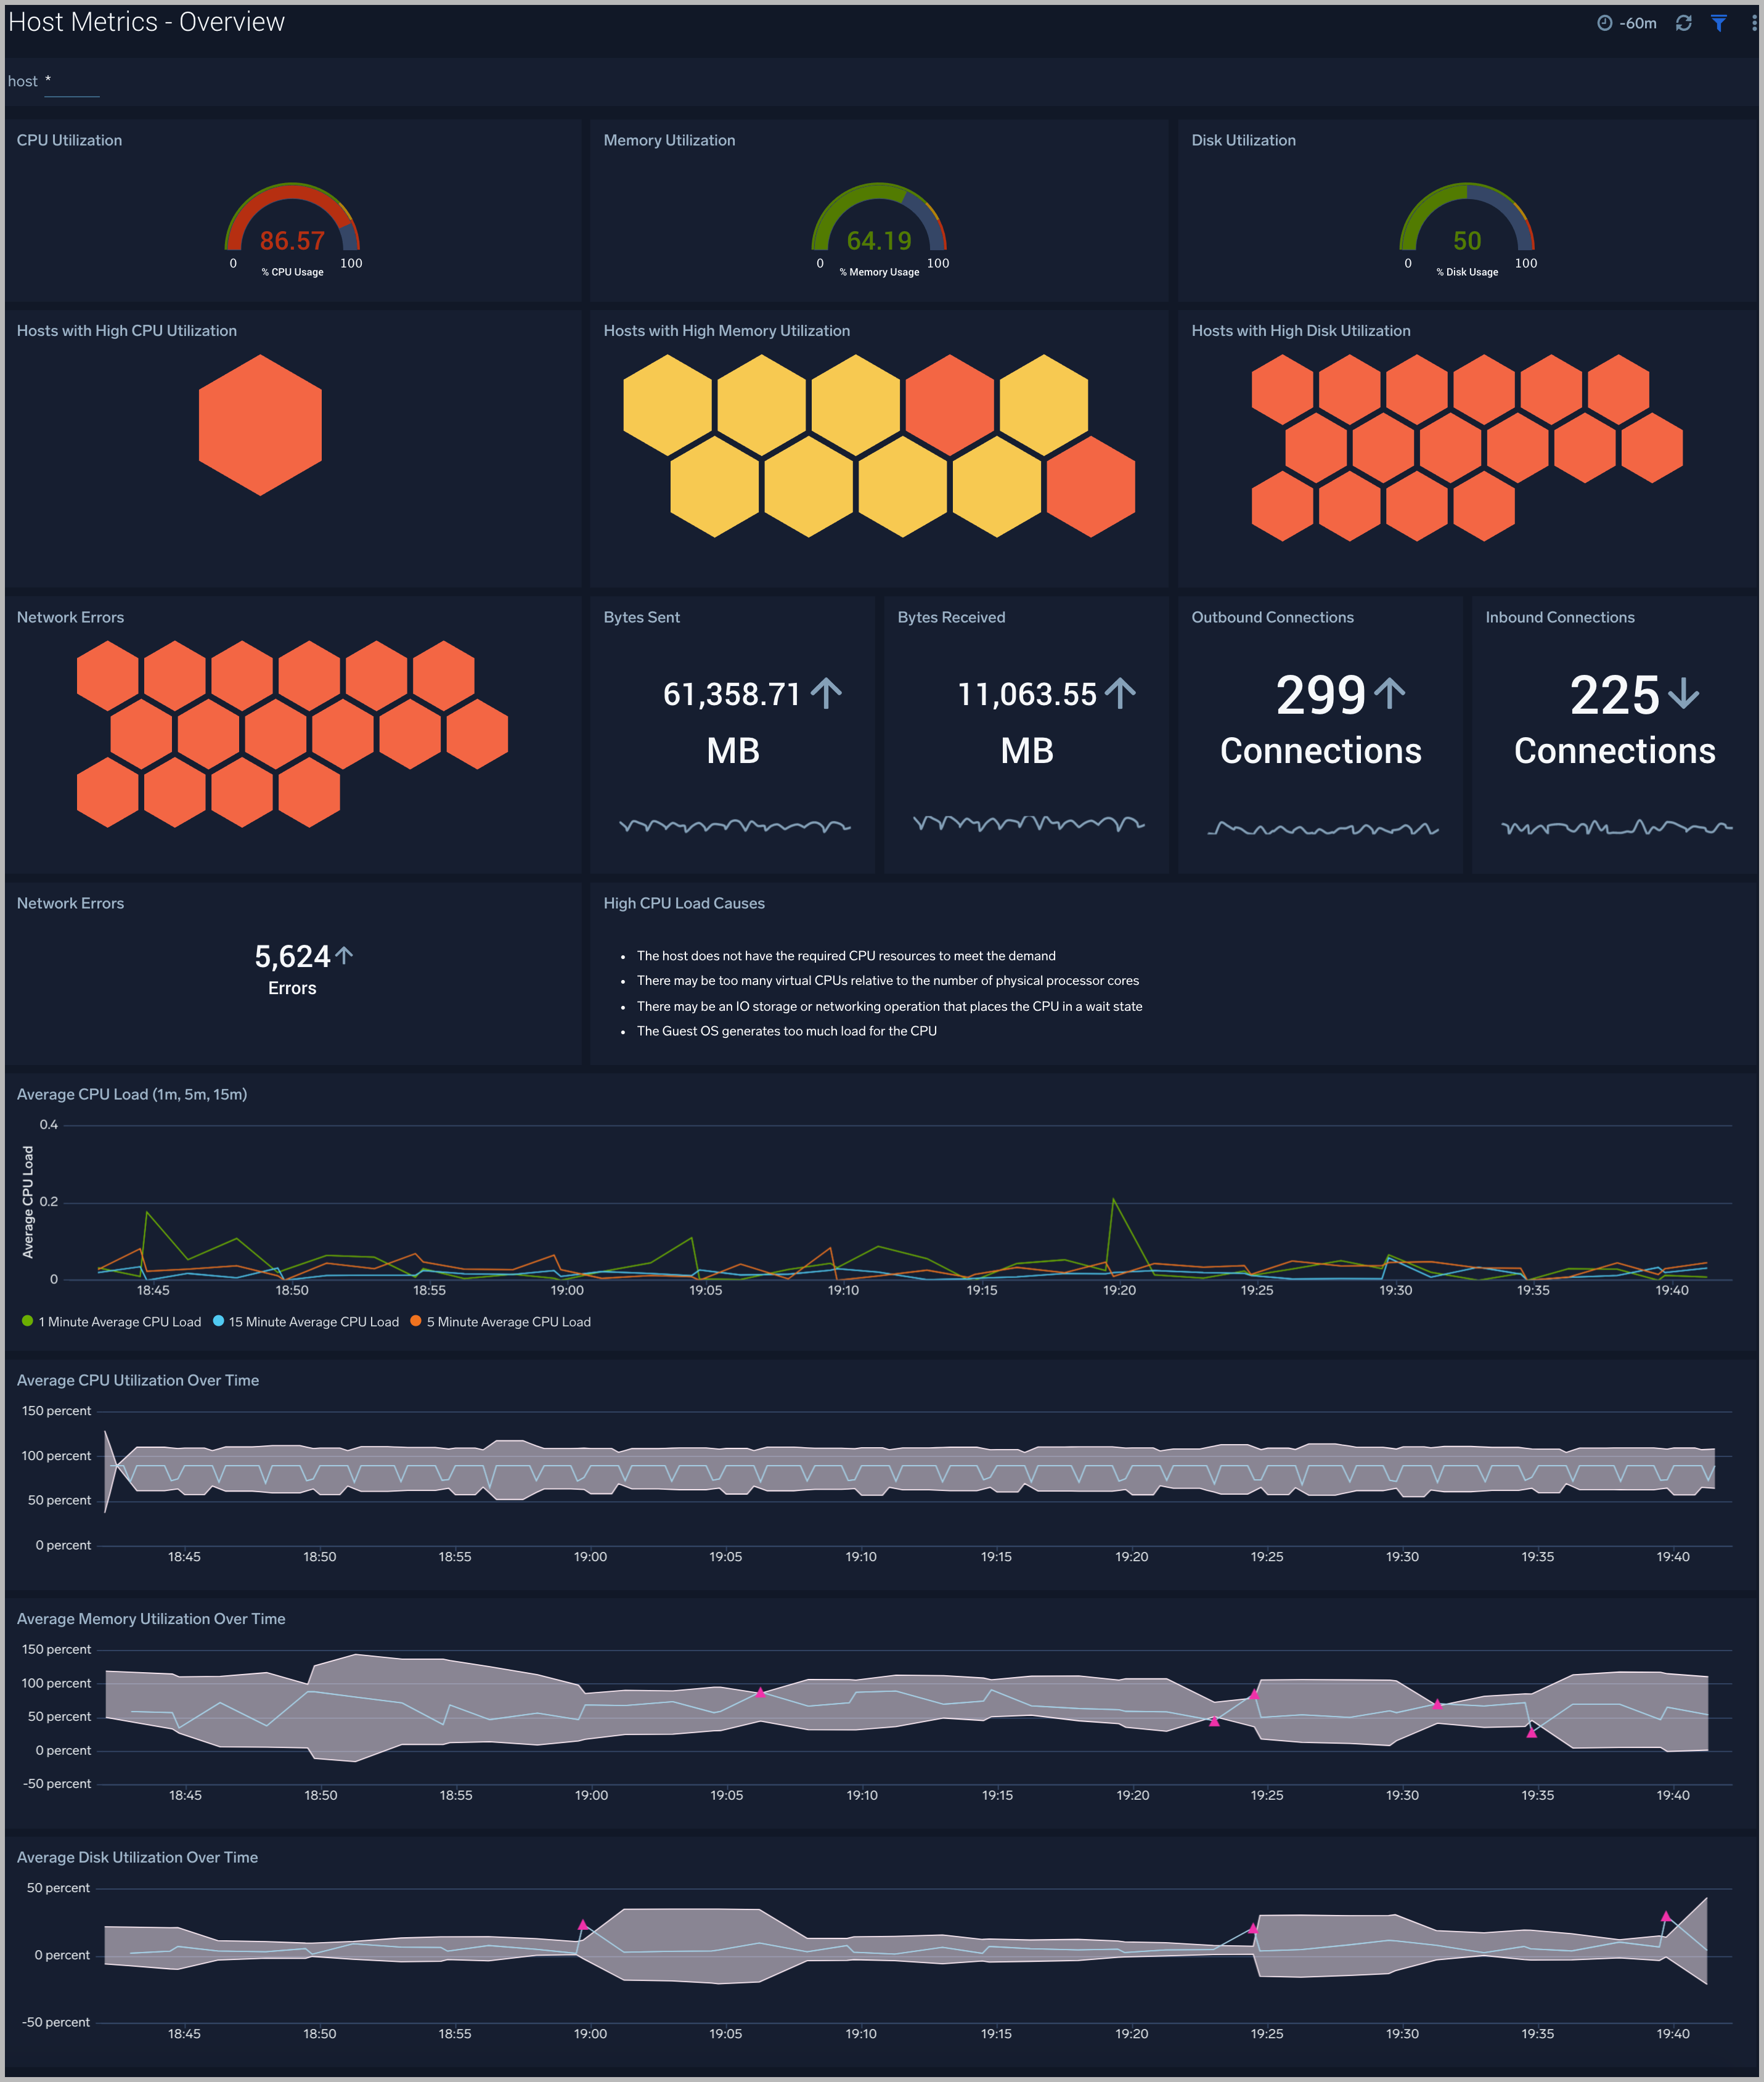
Host Metrics - Overview
The Host Metrics - Overview dashboard gives you an at-a-glance view of the key metrics like CPU, memory, disk, network, and TCP connections of all your hosts. You can drill down from this dashboard to the Host Metrics - CPU/Disk/Memory/Network/TCP dashboard by using the honeycombs or line charts in all the panels.
Use this dashboard to:
- Identify hosts with high CPU, disk, memory utilization, and identify anomalies over time.
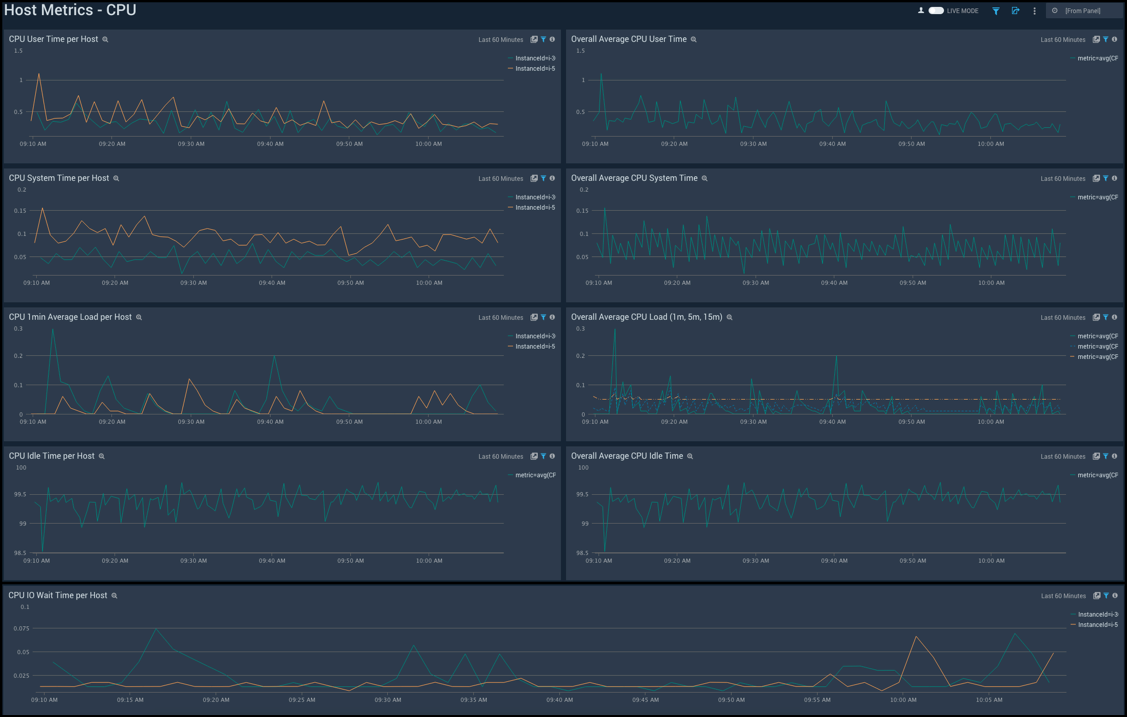
Host Metrics - CPU
The Host Metrics - CPU dashboard provides a detailed analysis based on CPU metrics. You can drill down from this dashboard to the Process Metrics - Details dashboard by using the honeycombs or line charts in all the panels.
Use this dashboard to:
- Identify hosts and processes with high CPU utilization.
- Examine CPU usage by type and identify anomalies over time.
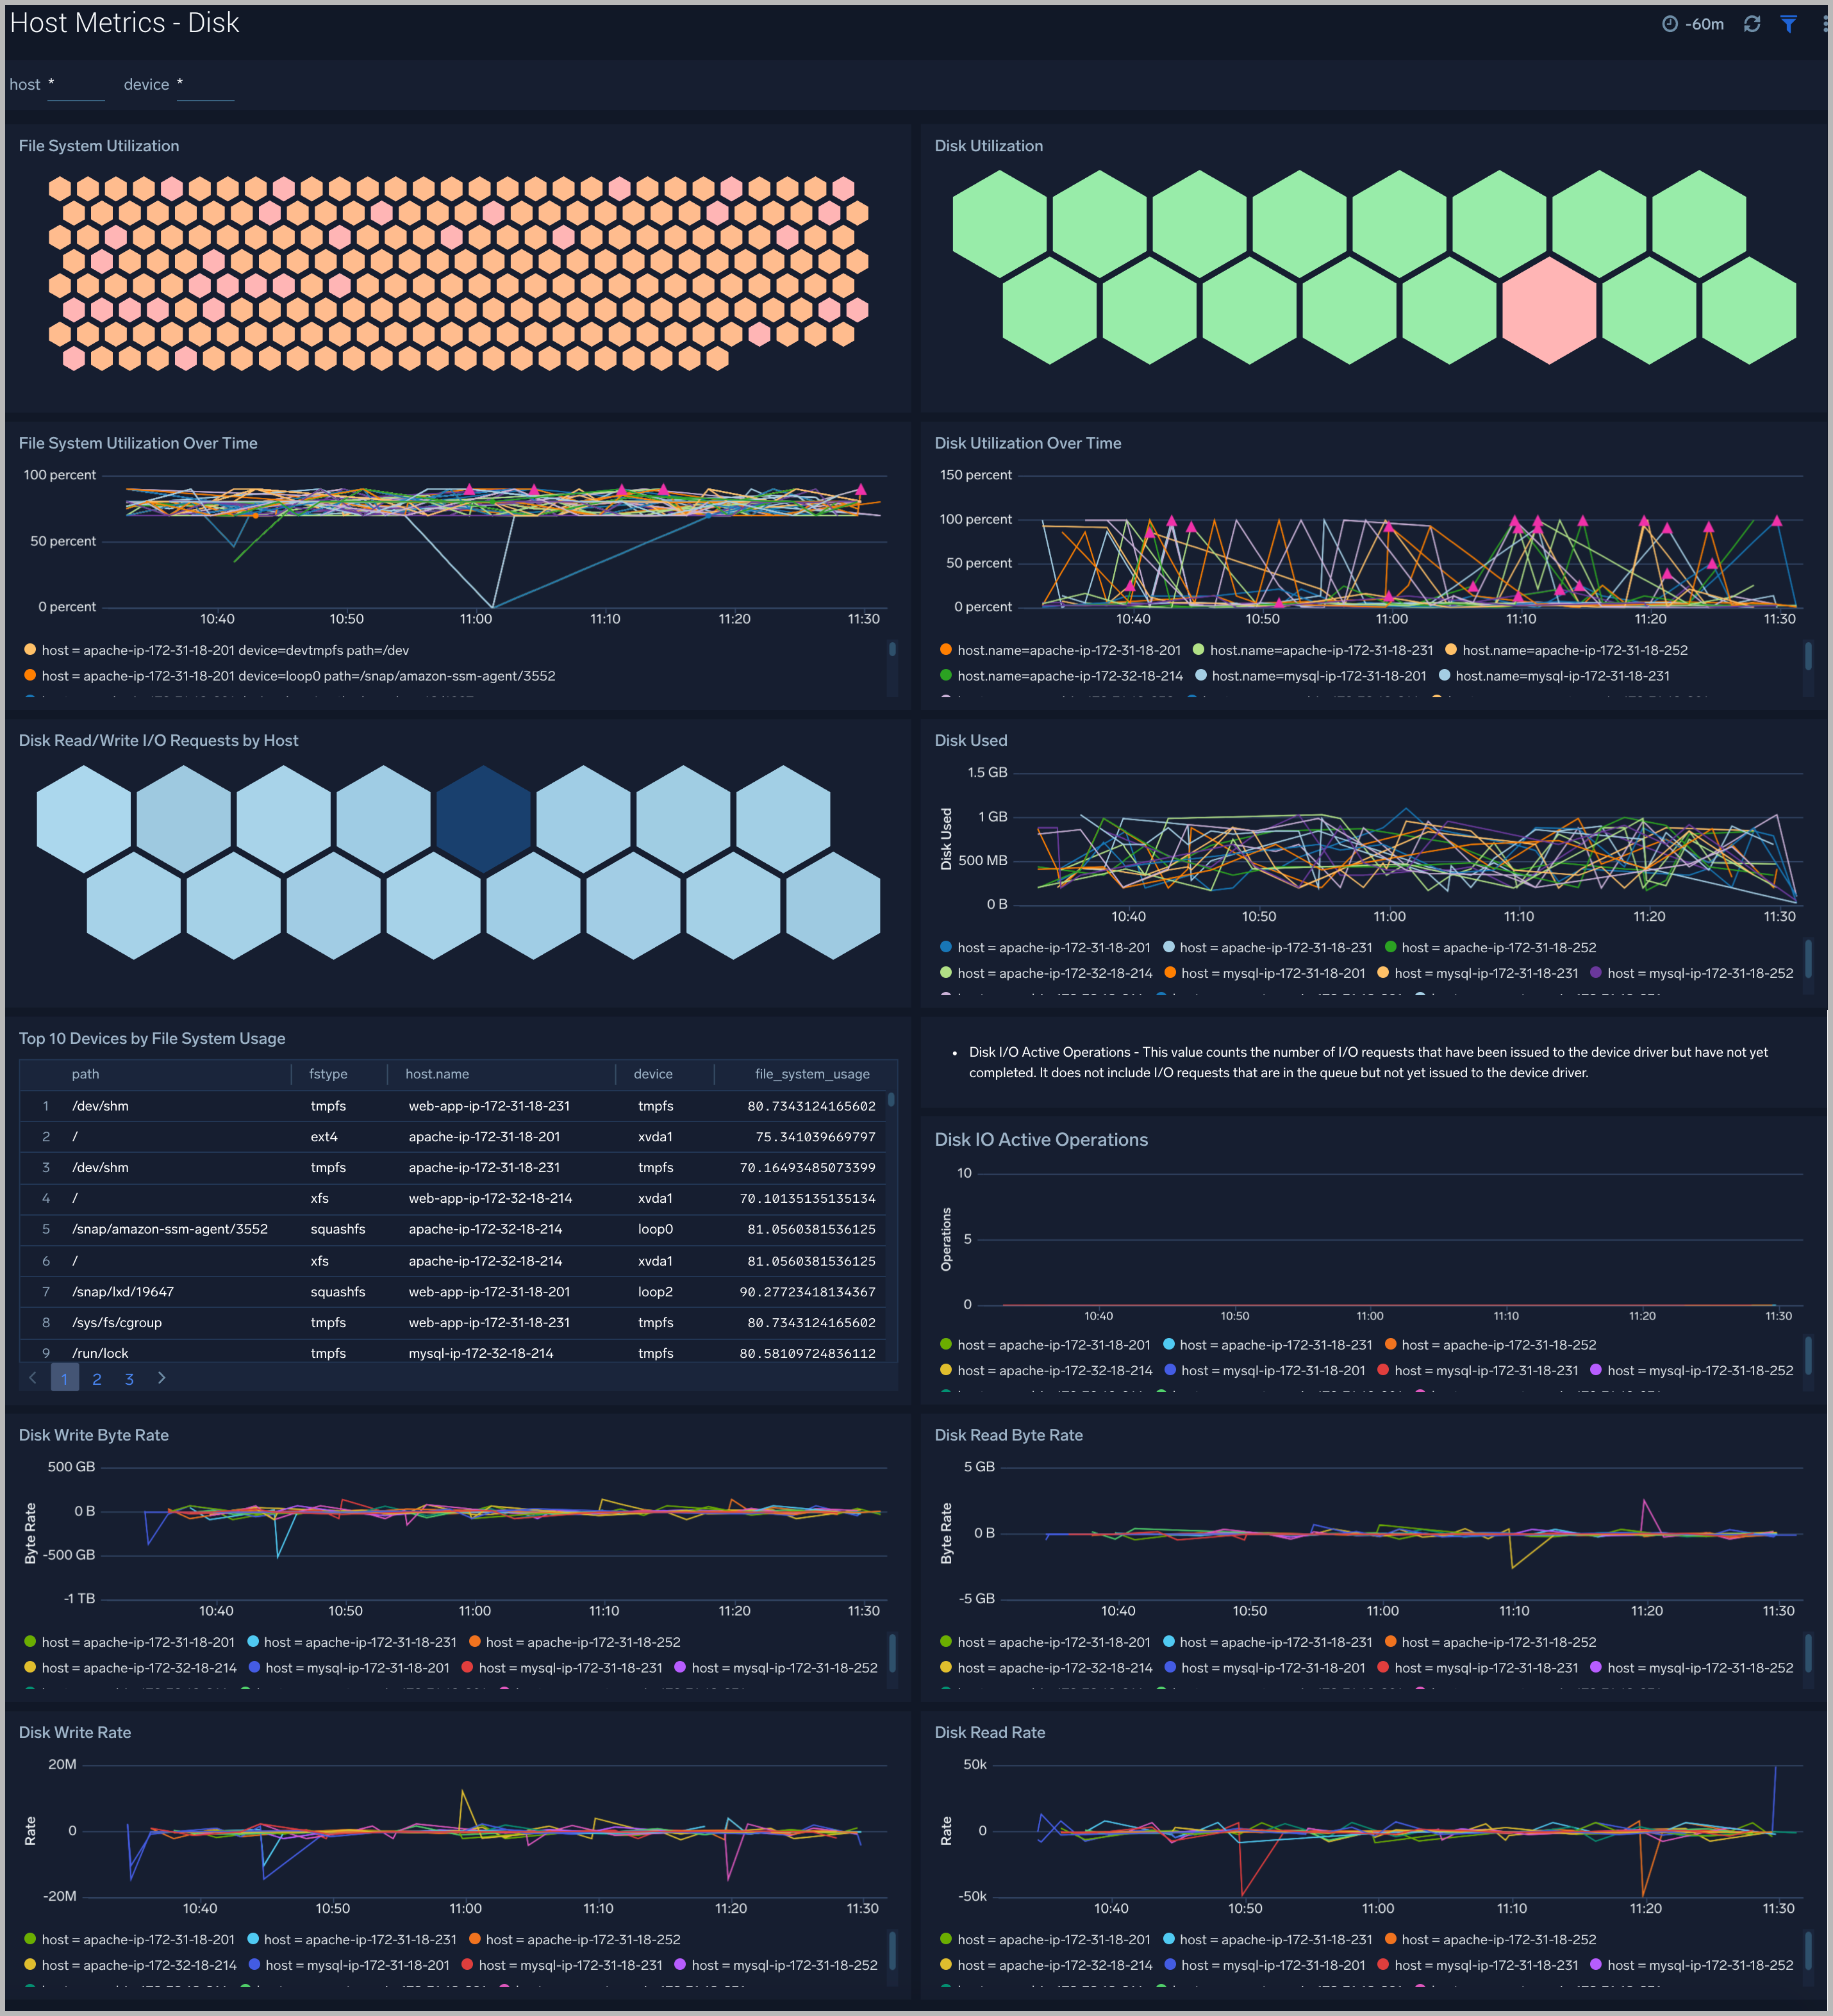
Host Metrics - Disk
The Host Metrics - Disk dashboard provides detailed information about on disk utilization and disk IO operations.You can drill down from this dashboard to the Process Metrics - Details dashboard by using the honeycombs or line charts in all the panels.
Use this dashboard to:
- Identify hosts with high disk utilization and disk IO operations.
- Monitor abnormal spikes in read/write rates.
- Compare disk throughput across storage devices of a host.
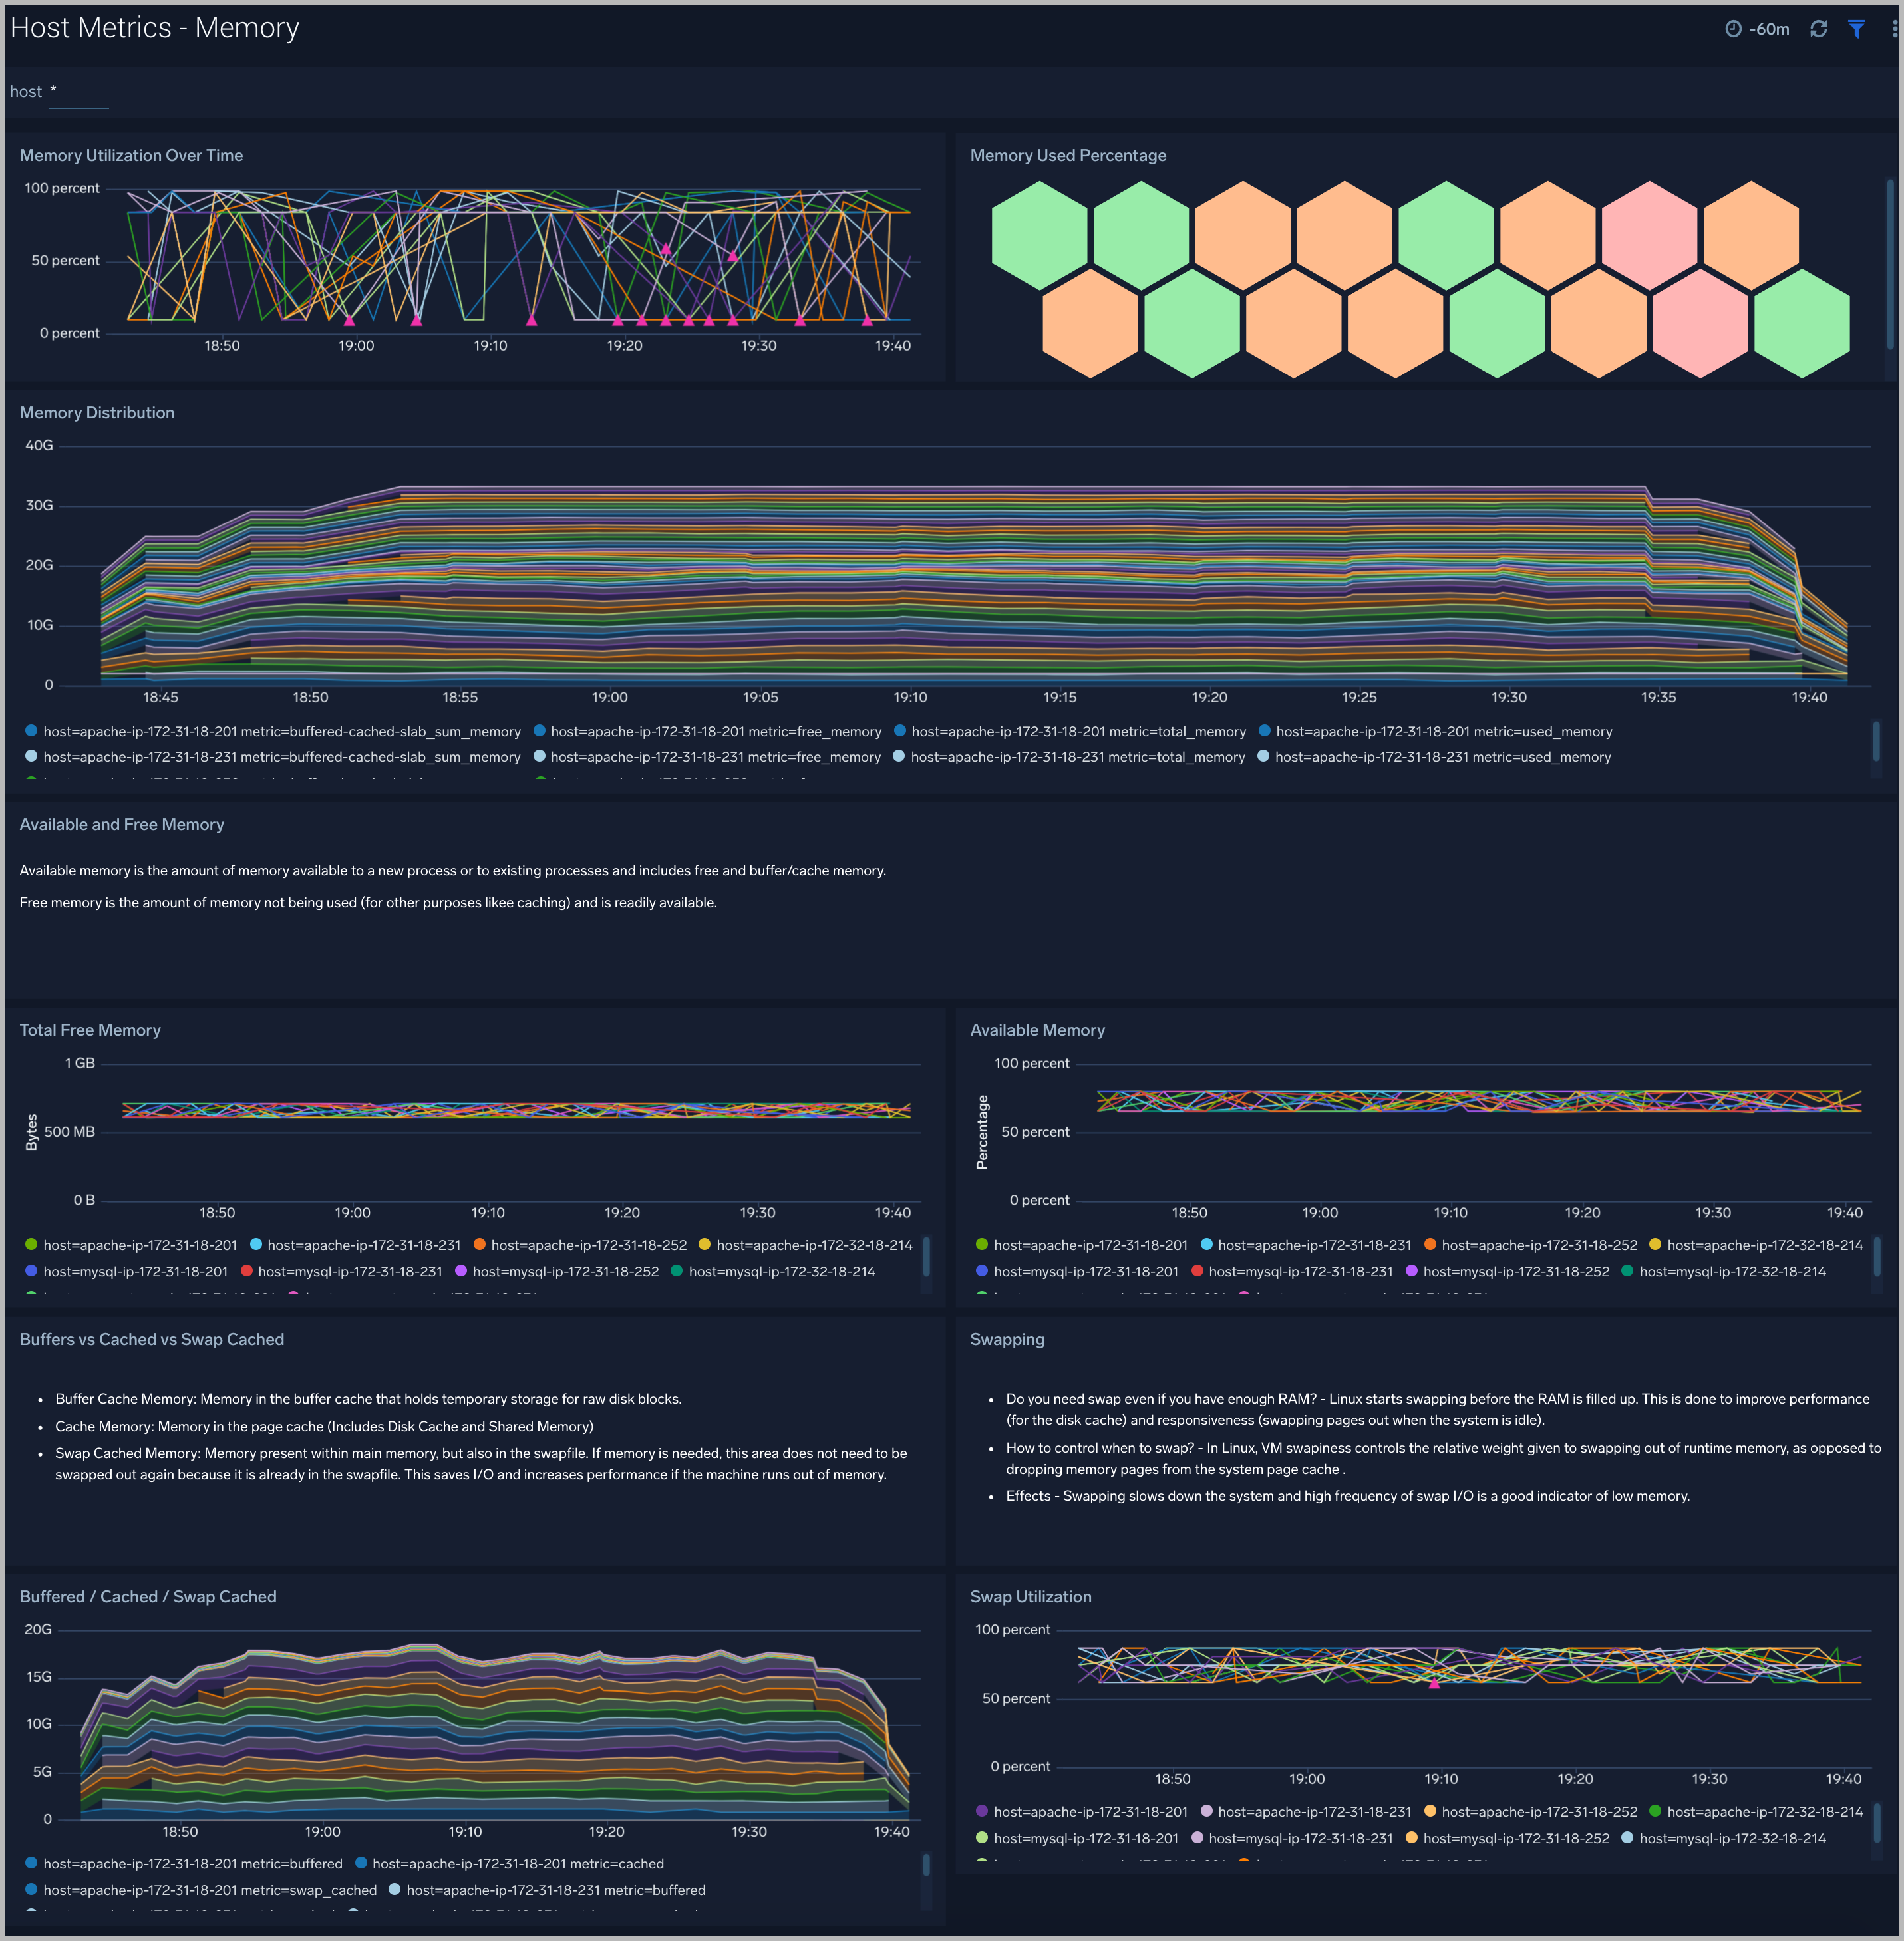
Host Metrics - Memory
The Host Metrics - Memory dashboard provides detailed information on host memory usage, memory distribution, and swap space utilization. You can drill down from this dashboard to the Process Metrics - Details dashboard by using the honeycombs or line charts in all the panels.
Use this dashboard to:
- Identify hosts with high memory utilization.
- Examine memory distribution (free, buffered-cache, used, total) for a given host.
- Monitor abnormal spikes in memory and swap utilization.
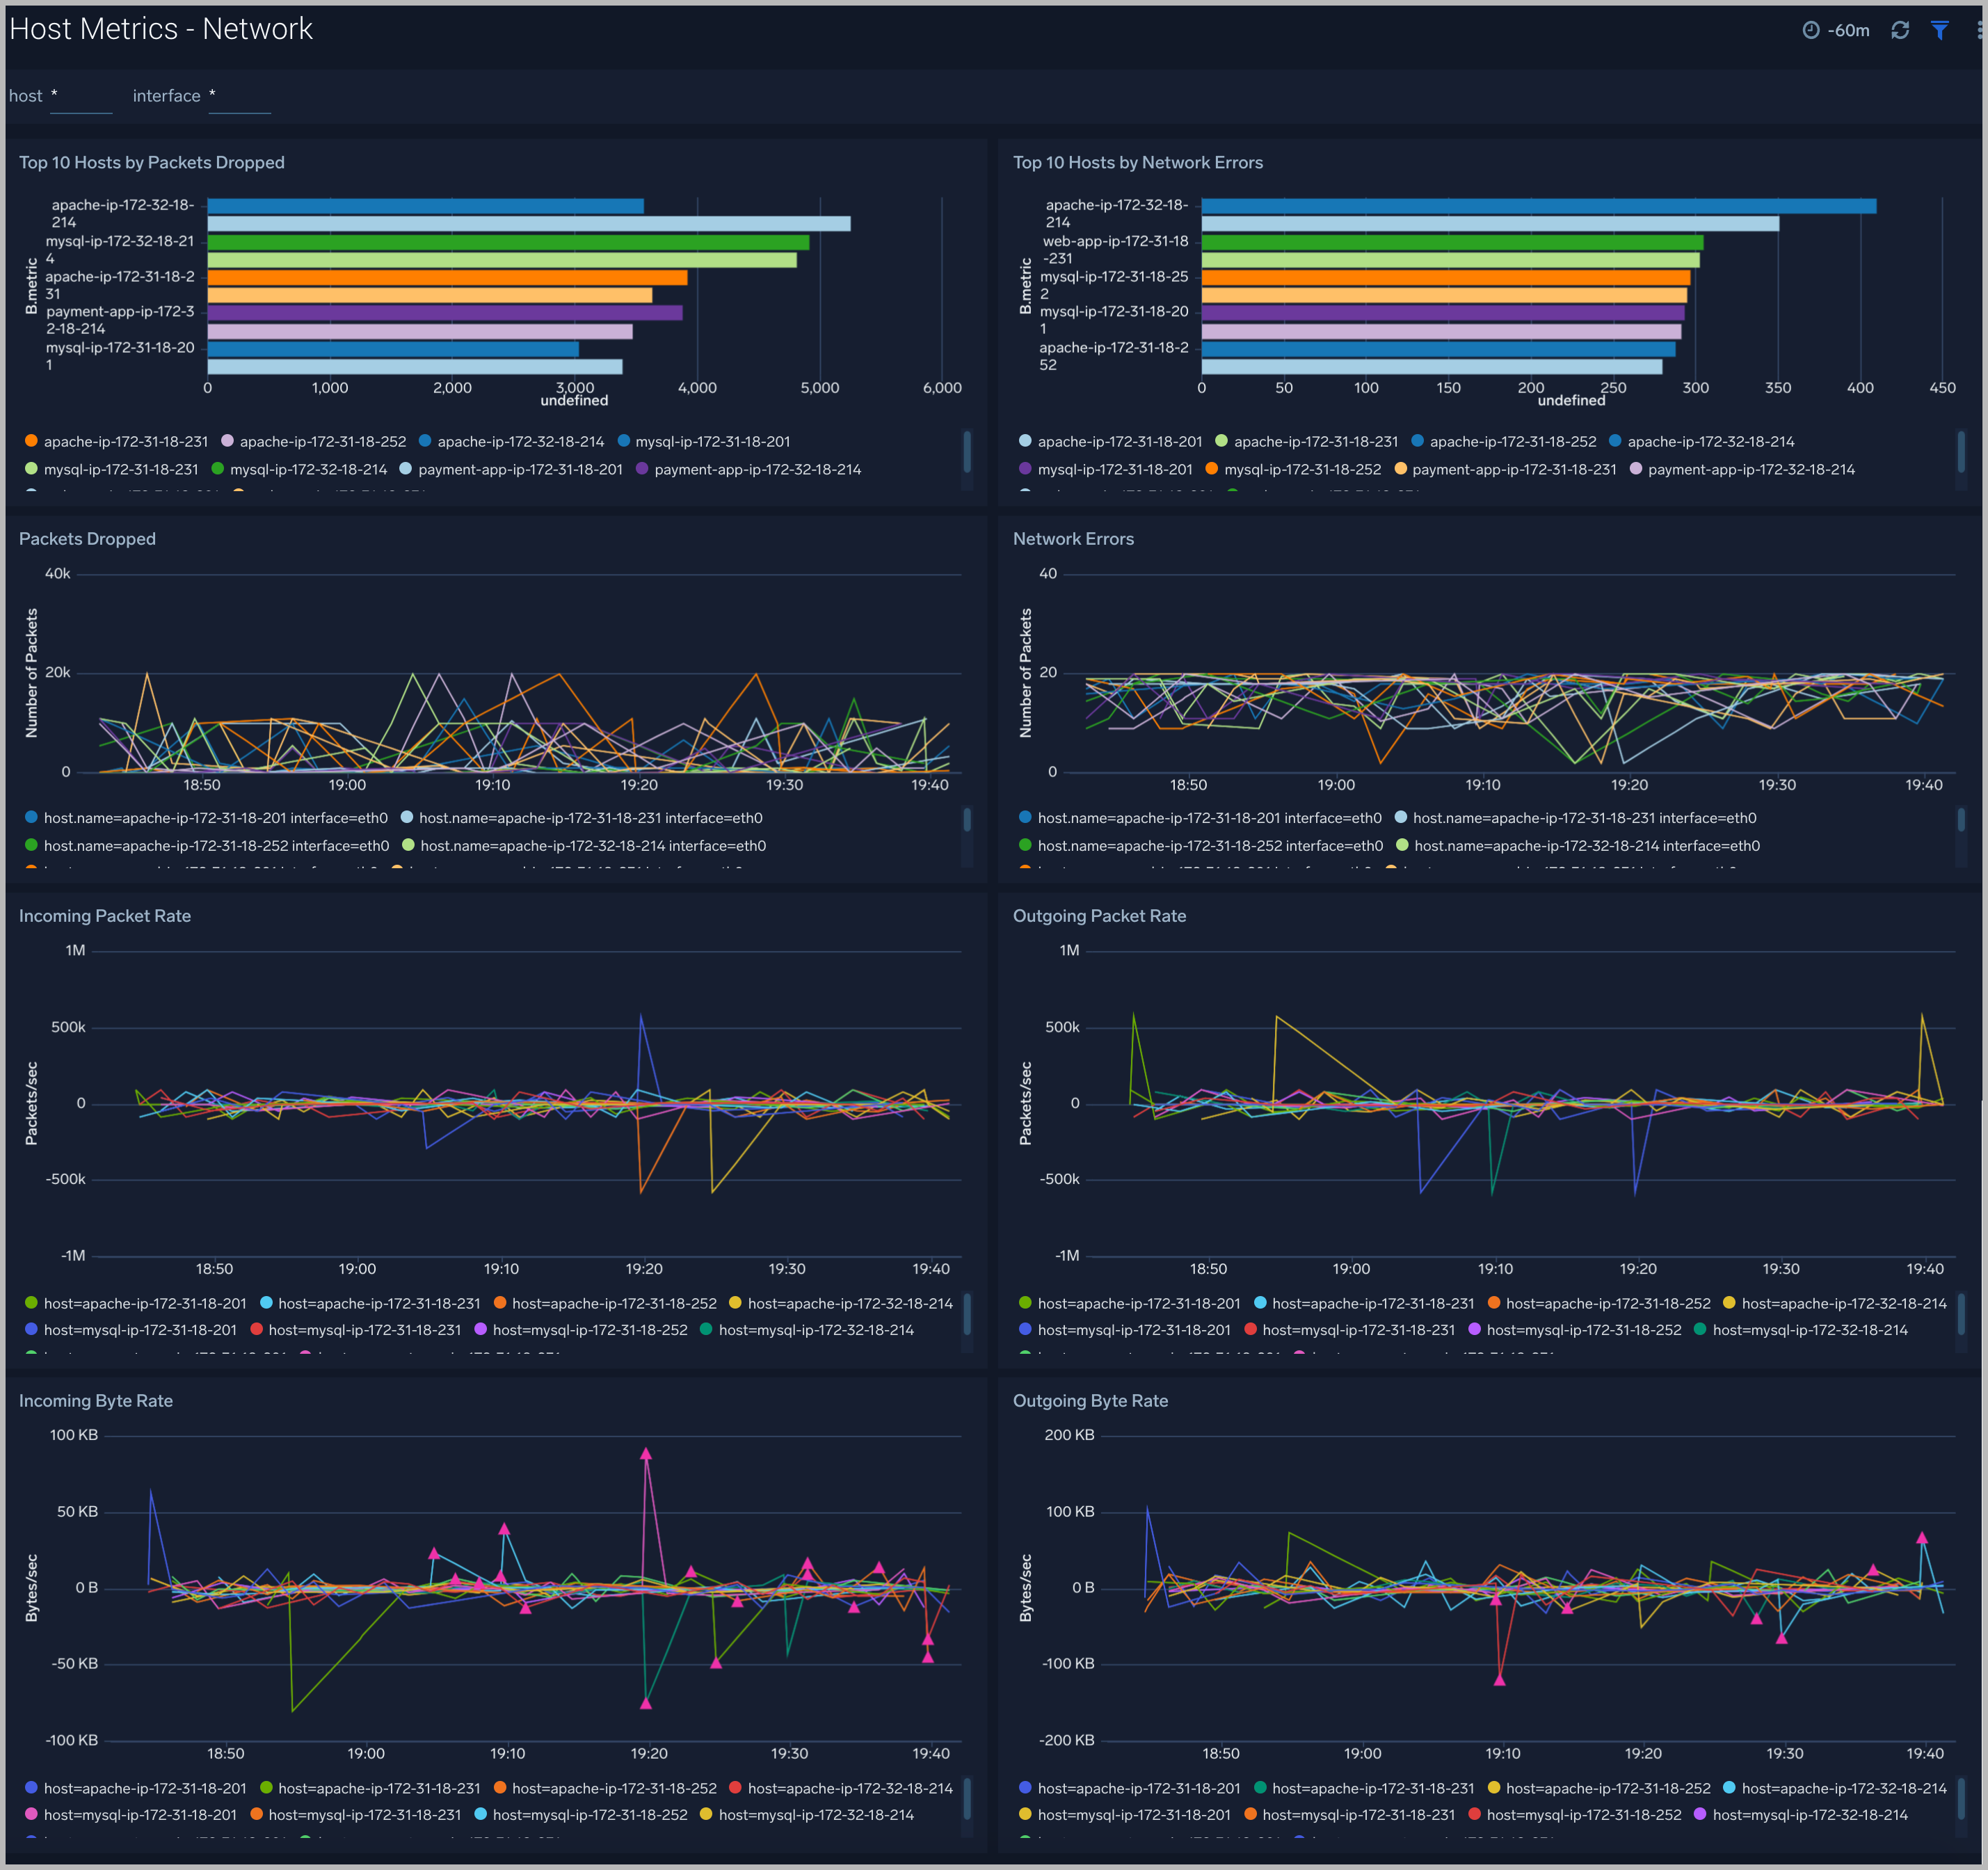
Host Metrics - Network
The Host Metrics - Network dashboard provides detailed information on host network errors, throughput, and packets sent and received.
Use this dashboard to:
- Determine top hosts with network errors and dropped packets.
- Monitor abnormal spikes in incoming/outgoing packets and bytes sent and received.
- Use dashboard filters to compare throughput across the interface of a host.
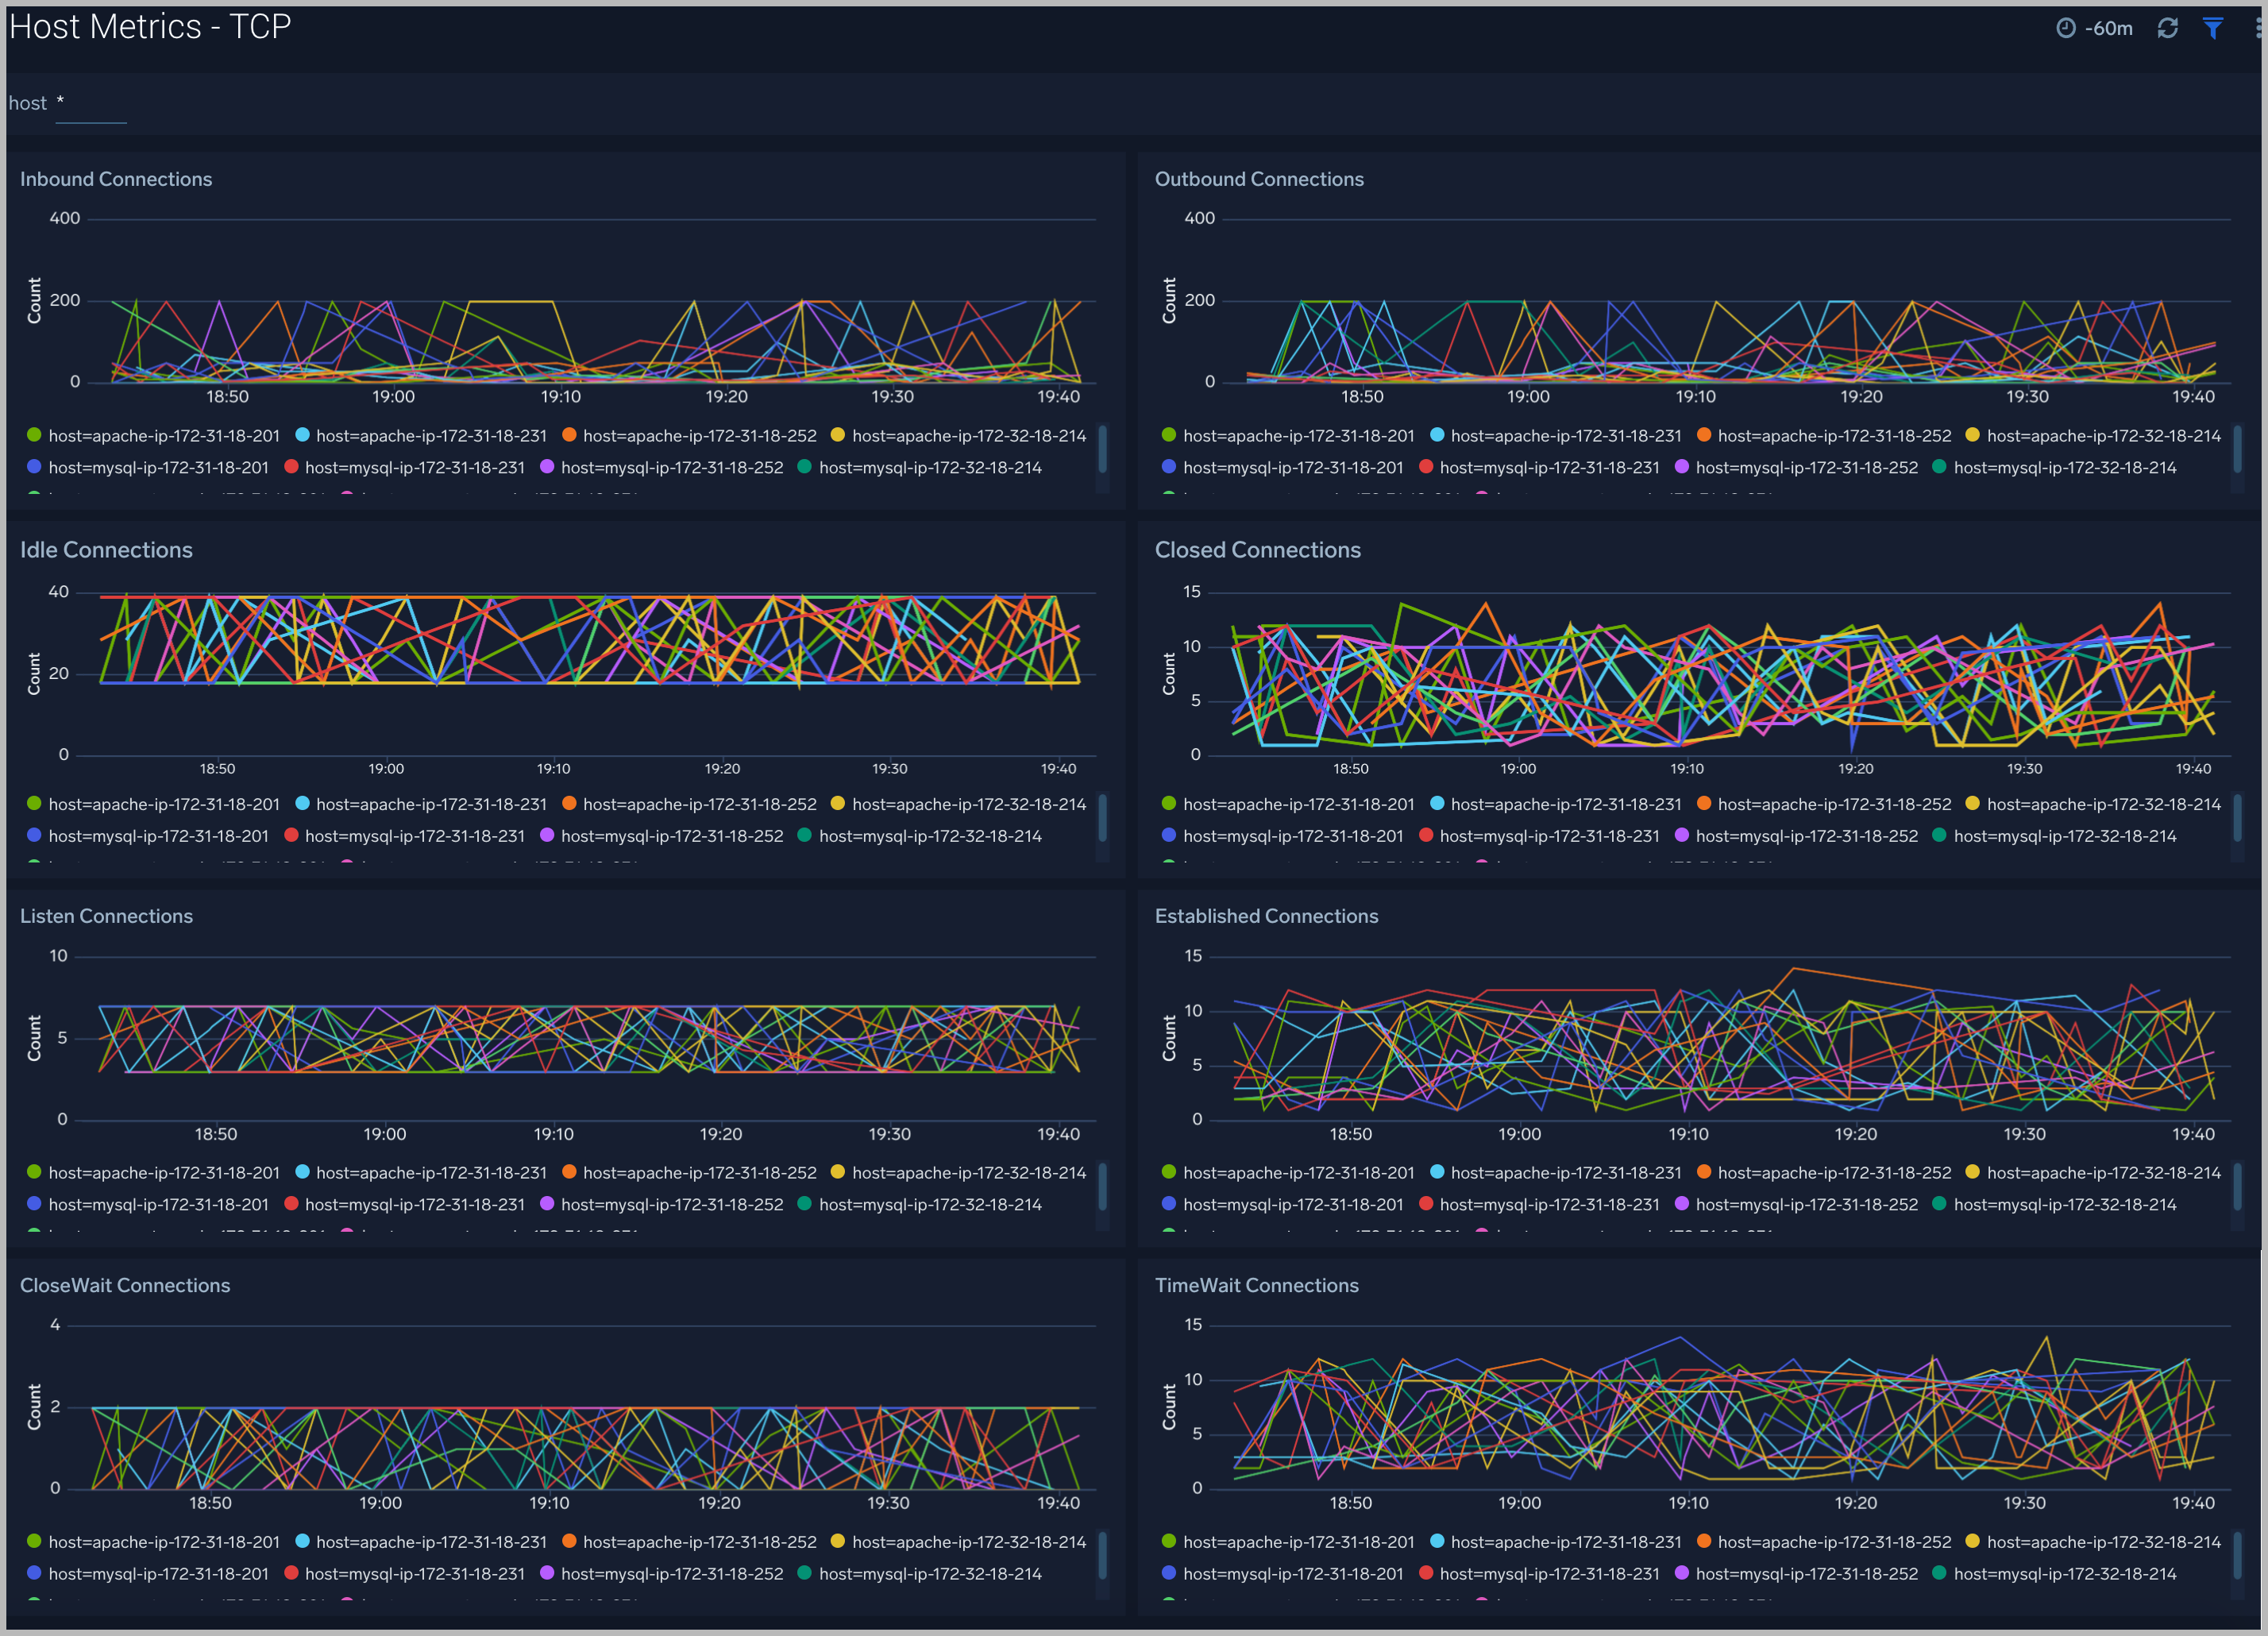
Host Metrics - TCP
The Host Metrics - TCP dashboard provides detailed information around inbound, outbound, open, and established TCP connections.
Use this dashboard to:
- Identify abnormal spikes in inbound, outbound, open, or established connections.
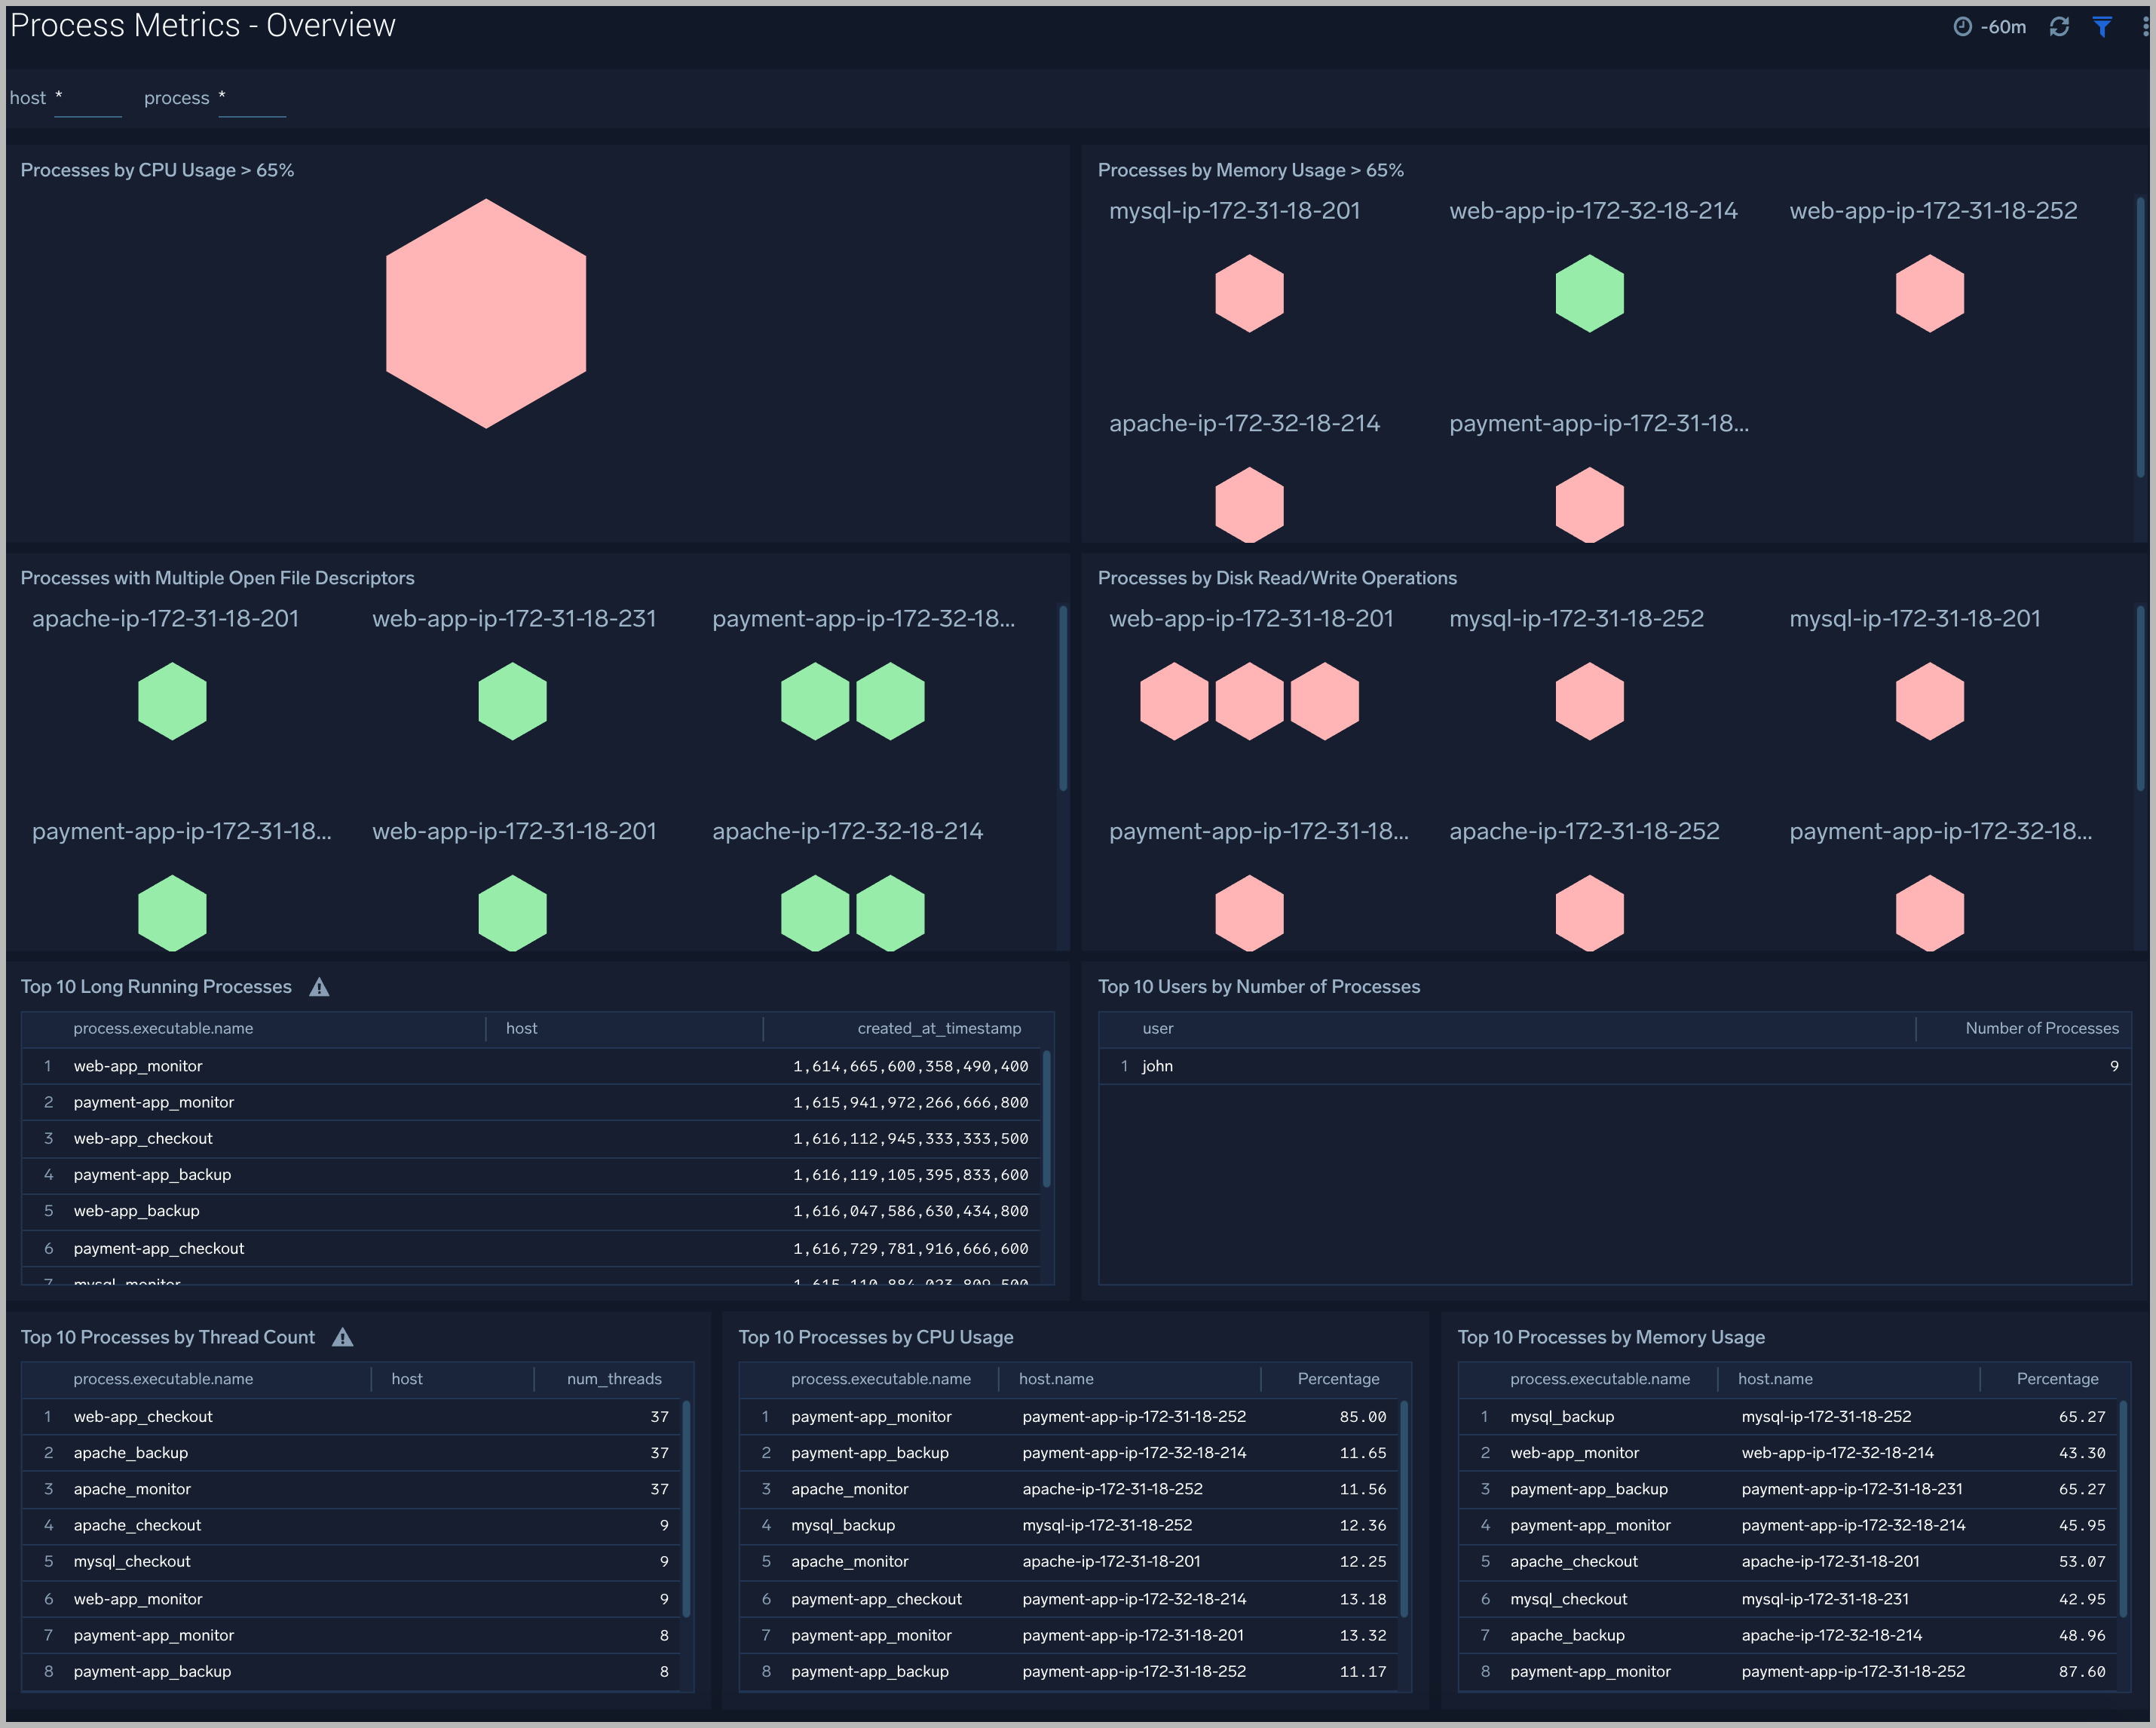
Process Metrics - Overview
The Process Metrics - Overview dashboard gives you an at-a-glance view of all the processes by open file descriptors, CPU usage, memory usage, disk read/write operations and thread count.You can drill down from this dashboard to the Process Metrics - Details dashboard by using the honeycombs or line charts in all the panels.
Use this dashboard to:
- Identify top processes by CPU, memory usage, and open file descriptors.
- Determine the longest running processes and users that have spawned the most number of processes.
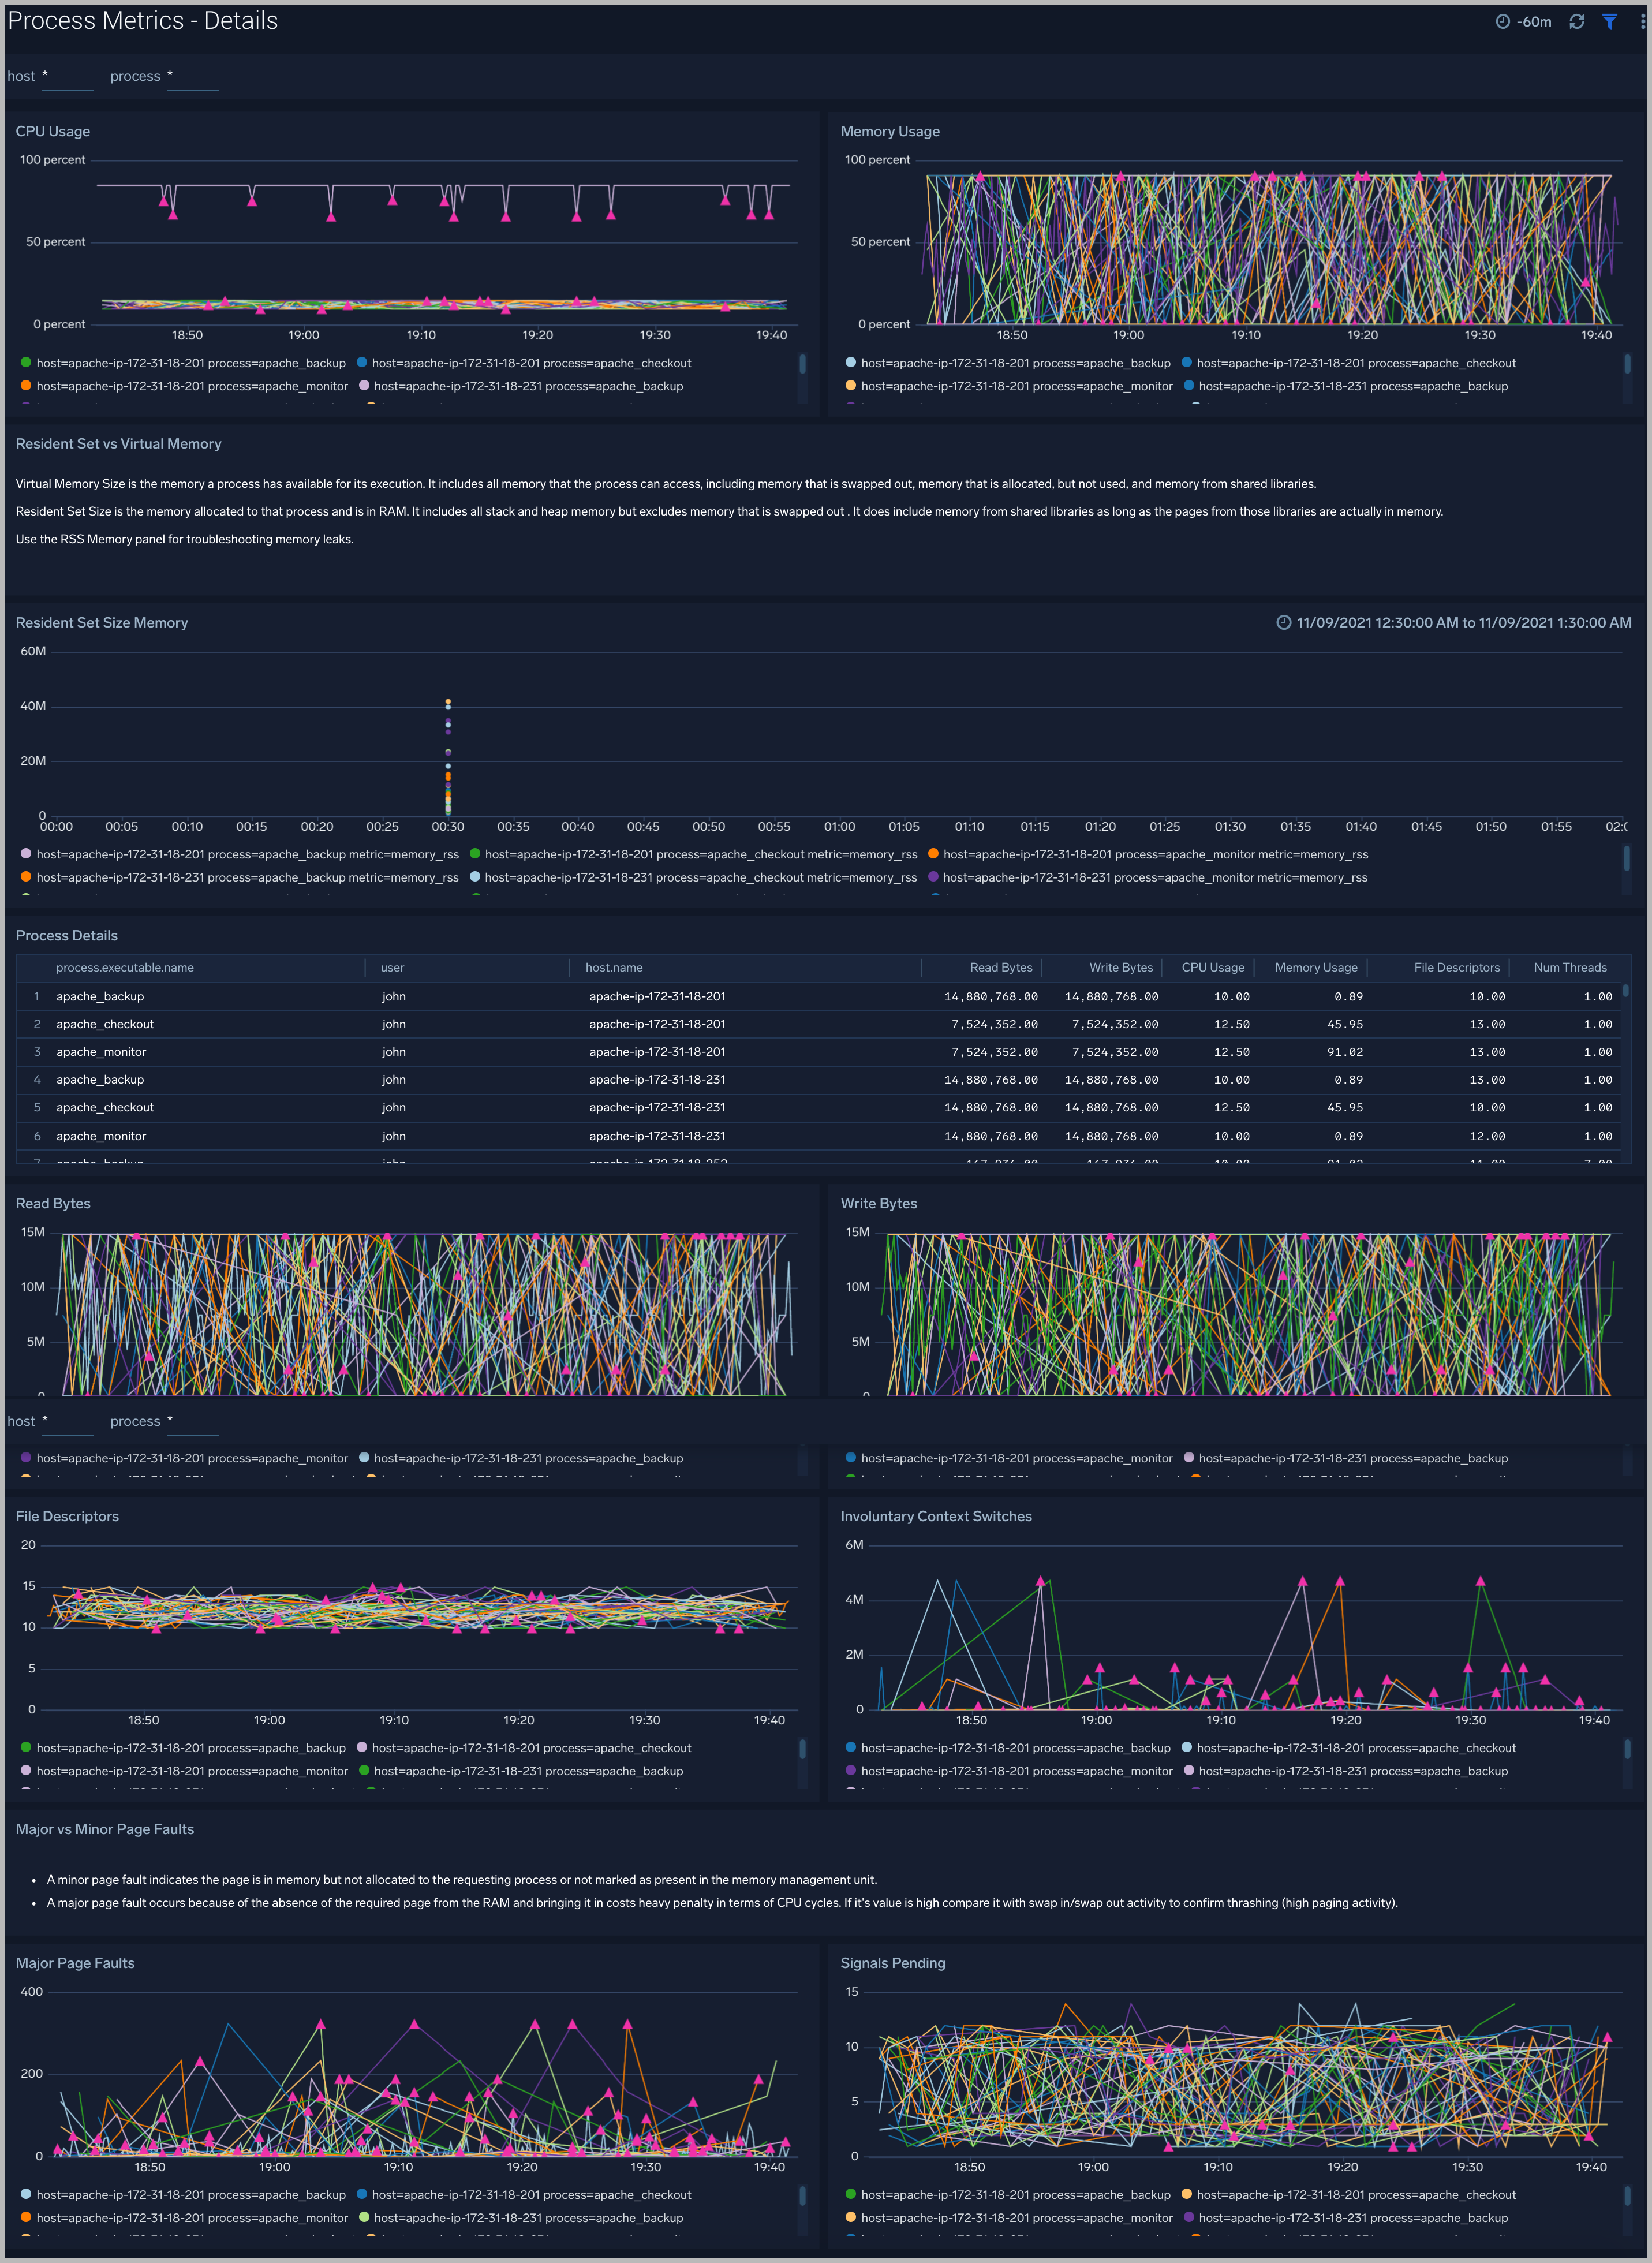
Process Metrics - Details
The Process Metrics - Details dashboard gives you a detailed view of key process related metrics such as CPU and memory utilization, disk read/write throughput, and major/minor page faults.
Use this dashboard to:
- Determine the number of open file descriptors in all hosts. If the number of open file descriptors reaches the maximum file descriptor limits,, it can cause IOException errors.
- Identify anomalies in CPU usage, memory usage, major/minor page faults and reads/writes over time.
- Troubleshoot memory leaks using the resident set memory trend chart.
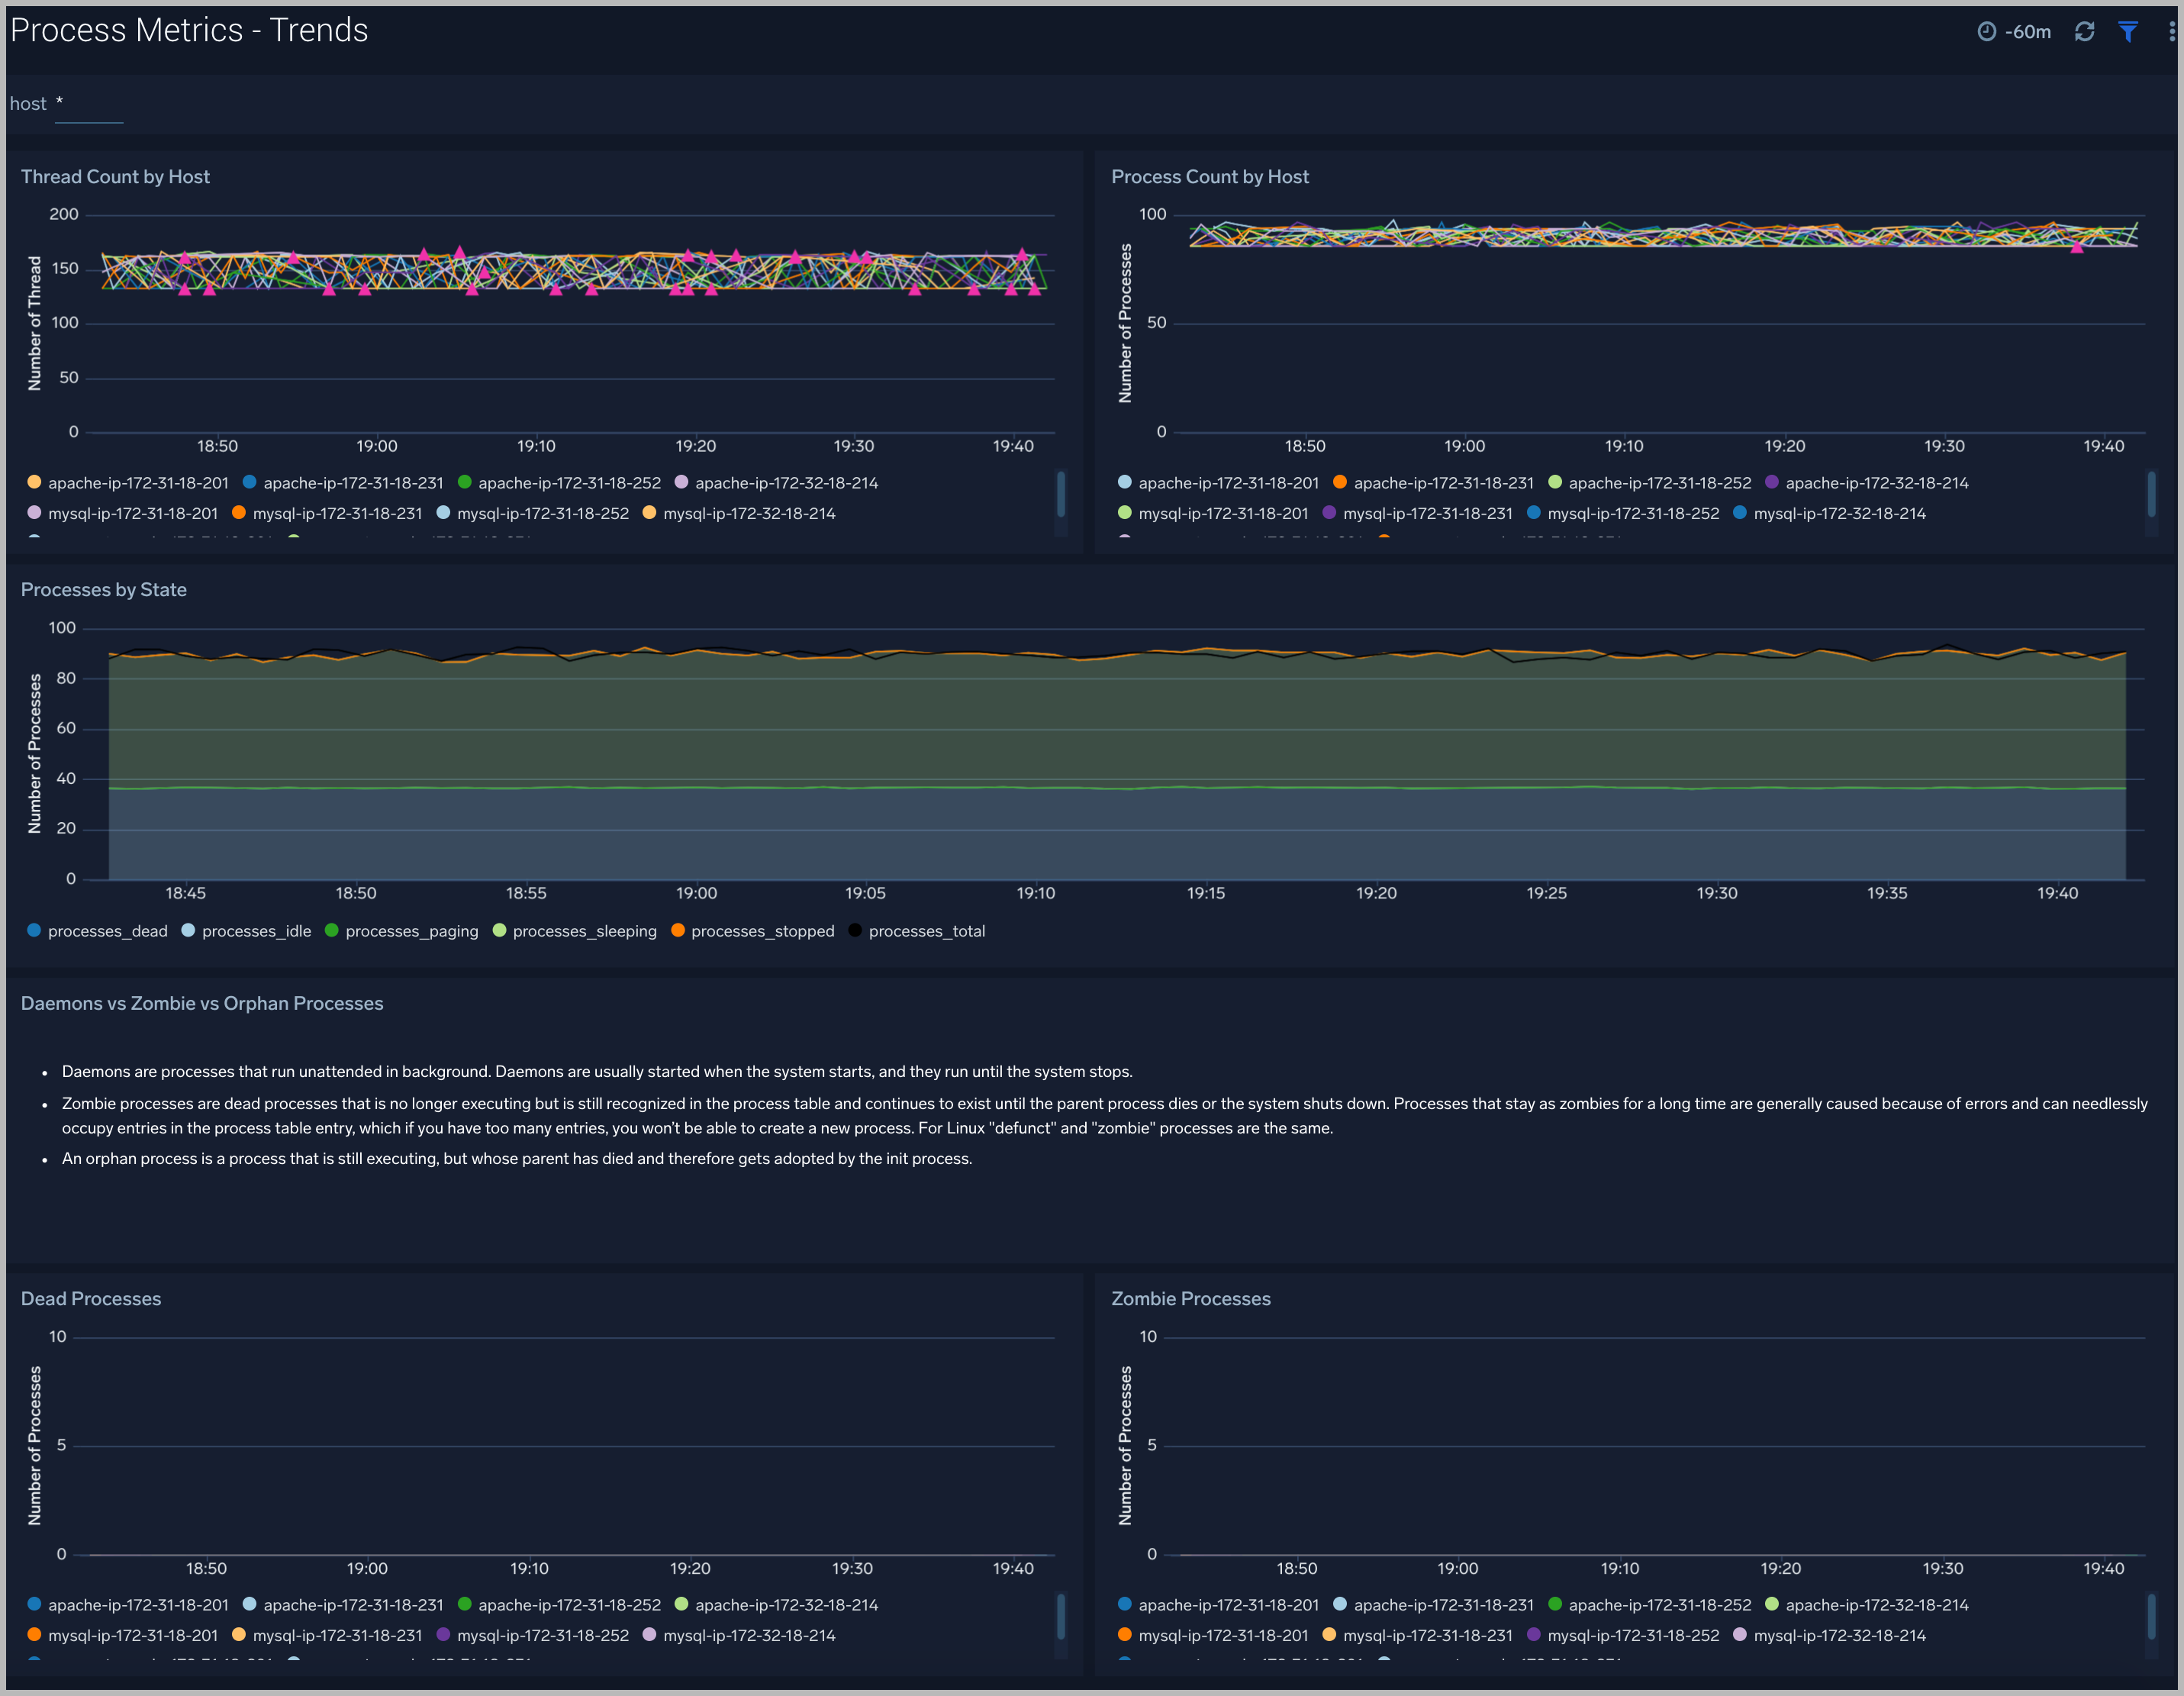
Process Metrics - Trends
The Process Metrics - Trend dashboard gives you insight into the state of your processes over time.
Use this dashboard to:
- Analyze the current state of all the processes (sleeping, dead, idle, stopped, total, paging)
- Identify anomalies over time in the number of threads, zombie processes, and total processes
Host and Process Metrics Alerts
For Host Metrics
Sumo Logic provides out-of-the-box alerts available via Sumo Logic monitors. These alerts are built based on metrics datasets and have preset thresholds based on industry best practices and recommendations.
| Alert Name | Alert Description | Alert Condition | Recover Condition |
|---|---|---|---|
| Host Metrics - High CPU Utilization | This alert fires when host CPU utilization is over 80%. | > 80 % | <= 80 % |
| Host Metrics - High Network Errors | This alert fires when a host has encountered network errors in the last five minutes. | > 1% | <= 1% |
| Host Metrics - Unusual network throughput in | This alert fires when host network interfaces are receiving an unusually high amount of data (> 100 MB/s) over a 5-minute time interval. | > 100 MB/sec | <= 100 MB/sec |
| Host Metrics - Unusual network throughput out | This alert fires when host network interfaces are sending an unusually high amount of data (> 100 MB/s) over a 5-minute time interval. | > 100 MB/sec | <= 100 MB/sec |
| Host Metrics - Host out of memory | This alert fires when memory utilization is over 90%. | > 90 % | <= 90 % |
| Host Metrics - Host out of inodes | This alert fires when a host's filesystem is close to running out of available iNodes (> 90% used). | > 90 % | <= 90 % |
| Host Metrics - Host swap is filling up | This alert fires when swap utilization is over 80%. | > 80 % | <= 80 % |
| Host Metrics - Host out of disk space | This alert fires when disk utilization is over 90%. | > 90 % | <= 90 % |
| Host Metrics - Unusual disk read rate | This alert fires when the disk is reading an unusually high amount of data (> 50 MB/s) over a 5-minute time interval. | > 50 MB/sec | <= 50 MB/sec |
| Host Metrics - Unusual disk write rate | This alert fires when the Disk is writing an unusually high amount of data (> 50 MB/s) over a 5-minute time interval. | > 50 MB/sec | <= 50 MB/sec |
For Process Metrics
Sumo Logic provides out-of-the-box alerts available via Sumo Logic monitors. These alerts are built based on metrics datasets and have preset thresholds based on industry best practices and recommendations.
| Alert Name | Alert Description | Alert Condition | Recover Condition |
|---|---|---|---|
| Process Metrics - High CPU Usage | This alert fires when the CPU utilization of a process is over 80% of the system CPU. | > 80 % | <= 80 % |
| Process Metrics - High Read Rate | This alert fires when a process is reading an unusually high amount of data (> 20 MB/s) over a 5-minute time interval. | > 50 MB/sec | <= 50 MB/sec |
| Process Metrics - High Write Rate | This alert fires when a process is writing an unusually high amount of data (> 20 MB/s) over a 5-minute time interval. | > 50 MB/sec | <= 50 MB/sec |
| Process Metrics - High Page Faults | This alert fires when the rate of page faults is high (> 1000). | > 1000 | <= 1000 |
| Process Metrics - High Memory Usage | This alert fires when the memory used by a process is over 80% of system memory. | > 80 % | <= 80 % |
| Process Metrics - High Open file descriptors | This alert fires when the number of file descriptors used by a process is more than 1000. | > 1000 | <= 1000 |