CSE Heads Up Display
This topic describes CSE’s Heads Up Display (HUD), the landing page for the CSE UI. The HUD provides an at-a-glance overview of Insight status and activity.
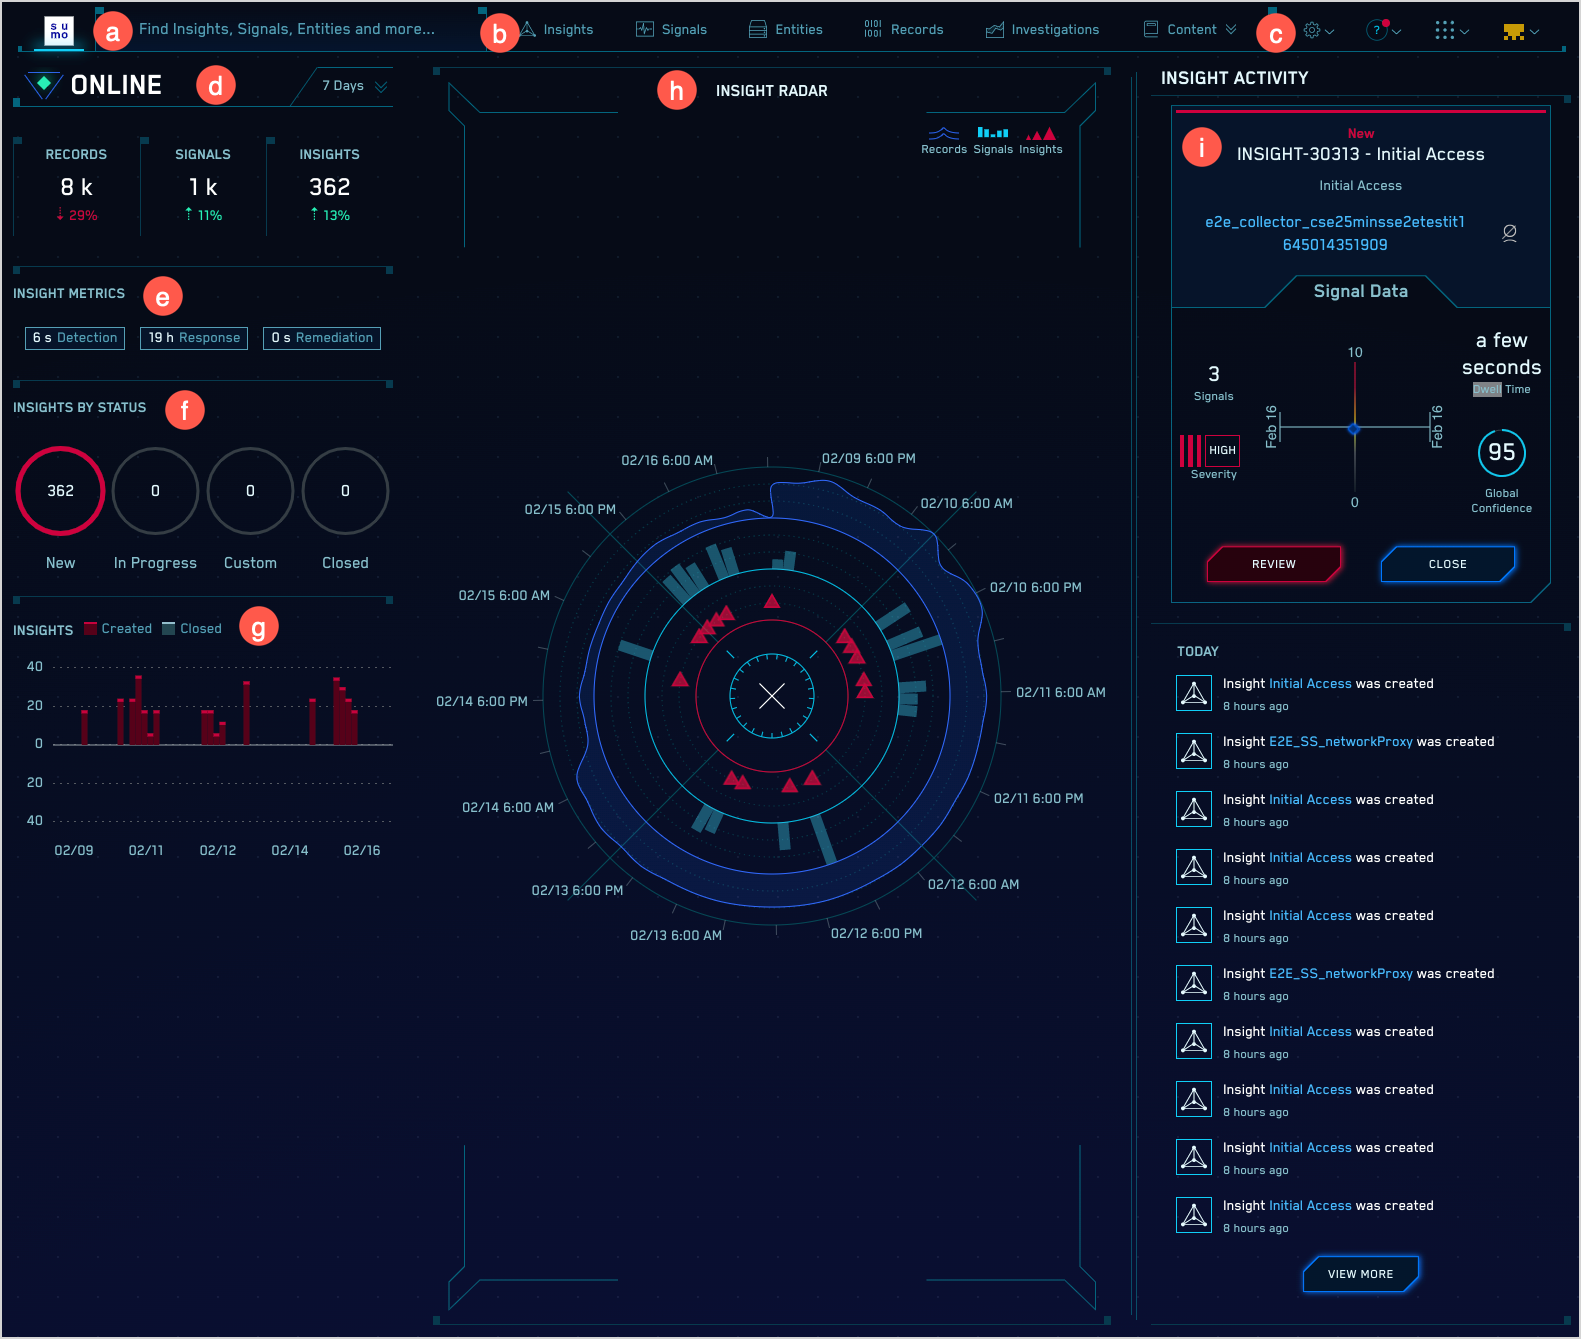
HUD overview
The left side of the HUD is a compact view of Insight activity and status in your environment. You can see the volume of Records being processed and how many Signals and Insights those Records result in. The HUD tells you how long it’s taking your team to spot, respond, and close Insights. You can see how many Insights are open, in progress, and closed. You can adjust the time range of the display depending on your interest.
The middle part of the HUD—the radar—visualizes the Record, Signal, and Insight volumes that are summarized on the left side of the page. It’s a circular timeline. The outer blue ring shows Record volume. Just inside the ring of Records is a histogram-like view of Signal volume. Nearest to the center are triangles that represent Insights. As you mouse around the radar, small popups provide a count of the Records, Signals, or Insights in that timeslice, depending on your focus.
The right side of the HUD contains a list of recent Insight activity. The card above the list shows key information about the latest new Insight with the highest severity.
See the sections below for more details on each element of the HUD.
Search bar
The search bar, labeled a in the screenshot, is where you search for Insights, Signals, Entities, and Records. When you click in the search bar, you’re prompted to select one of those types. Once you select a type, you're presented with a list of fields to filter on.
Tabs
A set of tabs appear in the area labeled b in the screenshot.
The Insights, Signals, Entities, Records tabs open pages that display those types in a list view. The Content tab provides dropdown access to pages for viewing and managing content items, including rules, threat intel, match lists, suppressed lists, and so on.
Command center
The section labeled c contains four icons.
| Icon | Description |
|---|---|
 | Click this icon to see a menu of CSE configuration options that you can use to manage incoming data, Entities, users and roles, integrations, and so on. |
 | Click this icon to access CSE help, API documentation, release announcements, and service status. |
 | Click this icon to open the Sumo Logic platform UI in a new tab. |
 | Click this icon to open your CSE user profile. Your profile is where you can manage your password, browser timezone, security options, and email notifications. |
Counts
The section labeled d shows the count of Records ingested, Signals fired, and Insights generated during the currently selected time range, along with the percentage change compared to the previous time period. For example, if the currently selected time range is 24 hours, the percentage change is compared to the counts for the 24 hours previous to that.
The default time range is 24 hours. You can change the time range using the dropdown to the right of the currently selected time range; the options range from 4 hours to 7 days. When you change the time range, the counts and metrics in the left and middle columns of the HUD update accordingly.
Insight Metrics
The Insight Metrics section, labeled e, displays the following metrics for the currently selected time range:
- Dwell. The average dwell time, which is the average period of time between when the first event occurred (when the first Record in the Insight was generated) and when the Insight was generated, in seconds.
- Response. The average response time, which is the average time between when an Insight was generated and when its status was set to In Progress, in seconds.
- Remediation. The average remediation time, which is the average time between when the Insight was created and when its status was set to Closed, in seconds.
If you use an HTTP POST V2 Action to send Insights to the Sumo Logic platform or another system, the Insight metrics are included in the Insight JSON object. The fields are timeToDetection, timeToResponse , and timeToRemediation.
Insights by Status
The Insights by Status section, labeled f in the screenshot, provides a quick view of what analysts are working on. The counts are a breakdown, by current Status—New, In Progress, Closed, and Custom—of the Insights created during the currently selected time range. Note that the count labeled Custom includes all Insights that have a custom Status.
Insights created and closed
This section, labeled g in the screenshot, contains a stacked bar chart that shows the count of Insights opened and closed over time during the time range. When you hover over a bar, you’ll see the breakdown.
Insight Radar
In the middle of the display is the Insight Radar, the HUD’s key feature. The radar visualizes the volume of Records, Signals, and Insights over time in a bulls eye-like view. Like the panels on the left side of the HUD, the radar updates when you select a different time range. The radar automatically refreshes every 60 seconds.
In the circular visualization the three outermost rings represent Records, Signals, and Insights.
The blue ring around the outside of the Radar represents Records. The selected time range is broken down into intervals, and as you hover over the outer border of the ring, traversing the time range, the count of Records created during each interval is displayed.
Within the blue ring is another ring that contains light blue bars, each of which represents the Signals that fired during a time interval. The height of a column corresponds to the number of Signals that fired. If no Signals fired during an interval, no column appears. As you hover over an interval, the count of Signals that fired is displayed. If you click a column, the Signals page appears, and displays the corresponding Signals.
The third ring contains triangles, each of which represents one or more Insights. As you hover over an interval, the count of Insights that fired is displayed. If you click a triangle, the Insights page appears, and displays the corresponding Insights.
Insight Activity
The Insight Activity pane, labeled i in the screenshot, shows recently created Insights and recent Insight activity.
The card at the top of the pane provides key information about the latest new Insight with the highest severity. The card provides the following information:
- The Insight ID and name, separated by a dash character. The name is typically formed from the MITRE stage(s) associated with the Signals in the Insight. In the case of a custom Insight, the name is the one supplied when the Insight was configured.
- The Insight description, typically formed from the MITRE stage(s) associated with the Signals in the Insight. In the case of a custom Insight, the description is the one supplied when the Insight was configured.
- The Entity the Insight fired on. You can click on the Entity to view its details. Note that there is a six-button context menu that has options for searching for the Entity in other Insights and in Signals and Records. It also has the built-in Add to Match List and Add to Suppressed List actions, along with any custom Context Actions defined in your environment.
- The analyst assigned to the Insight, if the Insight has been assigned to one.
- The number of Signals in the Insight.
- Duration of the Insight. The time between the moment of first activity observation (when the oldest Signal in the Insight was fired) and when the Insight was created.
- Global Confidence for the Insight, if available.
- The severity of the Insight.
- Review button. Click this button to view Insight details
- Close button. Click this button to close the Insight.
- Today’s Insight activity. The list in the lower part of the pane contains recent Insight changes: Insights created today, and status changes and comments made today, in chronological order, with the newest first.